2009, Vol. 53, No. 4
Printed in the Republic of Korea
요 약. o-phenylenediamine, 3-acetyl-6-methyl-(2H) pyran, 2,4 (3H)-dione (dehydroacetic acid or DHA) 및 살리실 알데히드로부터 유도한 4-hydroxy-3-(1-{2-(2-hydroxy-benzylidene)-amino phenylimino}-ethyl)-6- methy-pyran-2-one (H2L) 의 Cu(II), Ni(II), Co(II), Mn(II) 및 Fe(III) 고체 착물을 합성한 후, 원소분석, 전도 도법, 수자율, 자외선-가시선, 적외선, 1H-NMR 스펙트라, X-선 회절, 열분석을 통해 특성을 규명하고 항 균 활성을 조사하였다. IR 스펙트럼 데이터로부터 이 리간드가 중심 금속이온에 대해 ONNO 주개원자 배열을 갖는 이염기성 네자리 리간드로 행동함을 제안하였다. 원소분석 데이터로부터 이들 착물의 화 학량론이 1:1 (금속:리간드)임을 알았다. 물리-화학적 데이타로부터 Cu(II) 및 Ni(II) 착물이 사각평면 기 하구조, 그리고 Co(II), Mn(II) 및 Fe(III) 착물이 팔면체 기하구조임을 제안하였다. X-선 회절 데이터로 부터 Cu(II) 착물이 사방정계(orthorhombic) 결정계, Ni(II), Co(II) 및 Fe(III) 착물이 단사계(monoclinic) 결정계 그리고 Mn(II) 착물이 정방정계(tetragonal) 결정계임을 제안하였다. 착물의 열적 행동(TG/DTA) 을 연구하였으며 Coats-Redfern 방법으로 반응속도 파라메터를 결정하였다. 리간드와 이들 금속 착물을 이용하여 Staphylococcus aureus 및 Escherichia coli에 대한 향균 활성과 Aspergillus Niger 및 Trichoderma 에 대한 살균 활성을 조사하였다.
주제어: 디하이드로아세트산, 비대칭 네자리 리간드성 Schiff 염기, 전이금속 착물, 열분석, 분말 X-선 회절
ABSTRACT. The solid complexes of Cu(II), Ni(II), Co(II), Mn(II) and Fe(III) with 4-hydroxy-3-(1-{2-(2-hydroxy- benzylidene)-amino phenylimino}-ethyl)-6-methy-pyran-2-one (H2L) derived from o-phenylenediamine, 3-acetyl- 6-methyl-(2H) pyran, 2,4 (3H)-dione (dehydroacetic acid or DHA) and salicylic aldehyde have been synthesized and characterized by elemental analysis, conductometry, magnetic susceptibility, UV-visible, IR, 1H-NMR spectra, X-ray diffraction, thermal analysis, and screened for antimicrobial activity. The IR spectral data suggest that the ligand behaves as a dibasic tetradentate ligand with ONNO donor atoms sequence towards central metal ion.
From the microanalytical data, the stoichiometry of the complexes has been found to be 1:1 (metal: ligand).
비대칭 Tetradentate Schiff 염기 리간드의 전이금속 착물에 대한 합성 및 특성
A. S. Munde†, A. N. Jagdale‡, S. M. Jadhav, and T. K. Chondhekar*
Department of Chemistry, Dr. Babasaheb Ambedkar Marathwada University, Aurangabad-431 004, Maharashtra, India
†Department of Chemistry, Milind College of Science, Aurangabad-431 004, Maharashtra, India
‡Department of Chemistry, D. P. College, Karjat, Dist: Ahemdnager, Maharashtra, India (접수 2008. 10. 15; 수정 2008. 11. 26; 게재확정 2009. 4. 24)
Synthesis and Characterization of Some Transition Metal Complexes of Unsymmetrical Tetradentate Schiff Base Ligand
A. S. Munde†, A. N. Jagdale‡, S. M. Jadhav, and T. K. Chondhekar*
Department of Chemistry, Dr. Babasaheb Ambedkar Marathwada University, Aurangabad-431 004, Maharashtra, India
†Department of Chemistry, Milind College of Science, Aurangabad-431 004, Maharashtra, India
‡Department of Chemistry, D. P. College, Karjat, Dist: Ahemdnager, Maharashtra, India (Received October 15, 2008; Revised November 26, 2008; Accepted April 24, 2009)
The physico-chemical data suggests square planar geometry for Cu(II) and Ni(II) complexes and octahedral geo- metry for Co(II), Mn(II) and Fe(III) complexes. The x-ray differaction data suggests orthorhombic crystal system for Cu(II) complex, monoclinic crystal system for Ni(II), Co(II) and Fe(III) and tetragonal crystal system for Mn(II) complex. Thermal behaviour (TG/DTA) of the complexes was studied and kinetic parameters were determined by Coats-Redfern method. The ligand and their metal complexes were screened for antibacterial activity against Staphylococcus aureus and Escherichia coli and fungicidal activity against Aspergillus Niger and Trichoderma.
Keywords: Dehydroacetic acid, Unsymmetrical tetradentate Schiff Base, Transition metal complexes, Thermal analysis, Powder X-ray diffraction
O O
OH C
H3
N C H3
N O H
H
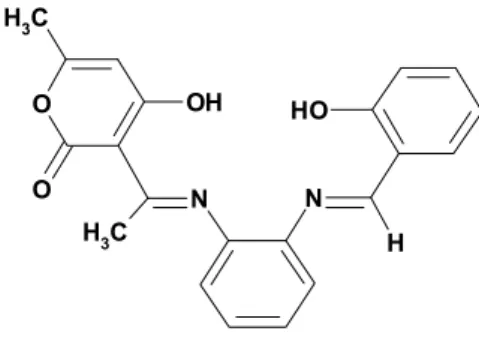
Fig. 1. Structure of ligand.
INTRODUCTION
Tetradentate Schiff bases with N2O2 donor atoms are well known to coordinate with various metal ions and have attracted a great deal of interest in recent years due to their rich co-ordination chemi- stry.1-5 Schiff bases of o-phenylenediamine reported to have variety of applications including biological,6 clinical7 and analytical8 fields. Many symmetrical tetradentate bis-type Schiff bases of 1,2-diamines with o-hydroxy aldehyde/ketone have been prepared and studied intensively. However much less atten- tion has been focused on unsymmetrical tetradentate Schiff bases derived from 1,2-diamines and different aldehydes/ketones. In particular those derived from aromatic 1,2 diamines have been under-investigated.9 It is worthwhile to mention here that unsymmetrical Schiff bases of this type are difficult to obtain and are not easily isolated.10
A search of literature revels that no work has been done on the transition metal complexes of the un- symmetrical Schiff bases derived from aromatic 1,2- diamine, dehydroacetic acid and salicylic aldehyde.
In this communication, we report the synthesis of unsymmetrical tetrdentate Schiff base formed by the condensation of o-phenylenediamine, dehydro- acetic acid and salicylic aldehyde (Fig. 1). The solid complexes of Cu(II), Ni(II), Co(II), Mn(II) and Fe(III) with this ligand have also been prepared and charac- terized by different physicochemical methods.
EXPERIMENTAL
Dehydroacetic acid obtained from Merck was used as supplied. O-phenylenediamine and salicylic
aldehyde of A.R. grade were used for synthesis of ligand. A.R. grade metal chlorides were used for the complex preparation. The carbon, hydrogen and nitrogen contents were determined on Perkin Elmer (2400) CNS analyzer. IR spectra were recorded on FT-IR spectrometer, Perkin Elmer Company using KBr pellets. 1H-NMR spectra of ligand were mea- sured in CDCl3 using TMS as internal standard.
The TG/DTA and XRD were recorded on Perkin Elmer TA/SDT-2960 and Philips 3701 respectively.
The uv-vis spectra of the complex were recorded on Shimadzu UV-1601 spectrometer. Magnetic suscep- tibility measurements of the metal chelates were determined on a Guoy balance at room temperature using Hg[Co(SCN)4] as calibrant. Molar conduc- tance of complexes was measured on Elico CM 180 conductivity meter using 10-3 M solution in DMF.
Synthesis of ligand
The ligand was prepared by a modification of the reported methods.11-13 A typical procedure for synthesis of Schiff bases is as follows: a 50 mL solution of 10 mmol (0.168 g) of dehydroacetic acid, 10mmol (0.108 g) of o-phenylenediamine and 10
비대칭 Tetr adentate Schiff 염기 리간드의 전이금속 착물에 대한 합성 및 특성
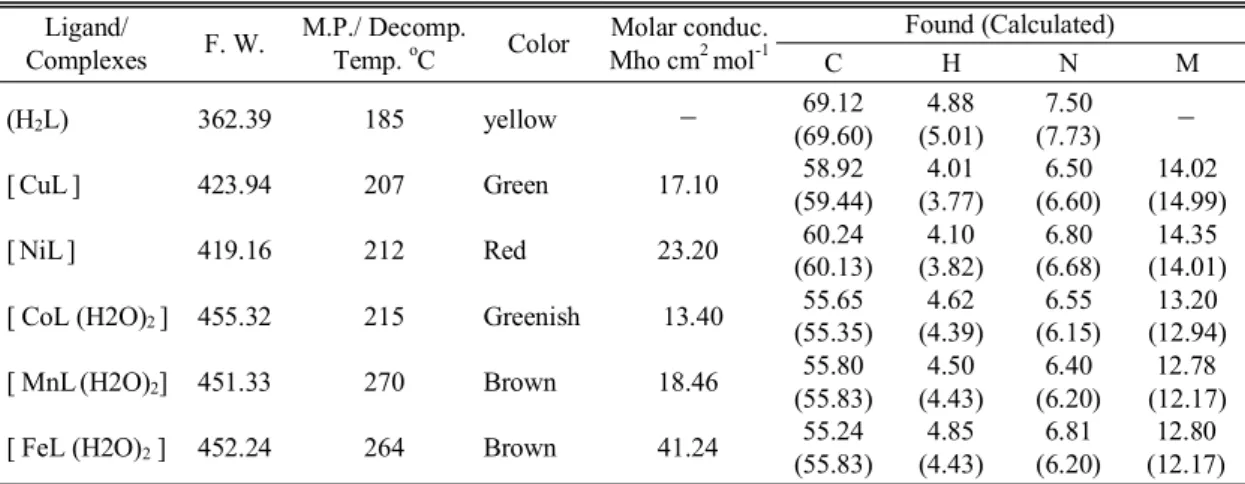
Table 1. Physical characterization, analytical and molar conductance data of compounds Ligand/
Complexes F. W. M.P./ Decomp.
Temp. oC Color Molar conduc.
Mho cm2 mol-1
Found (Calculated)
C H N M
(H2L) 362.39 185 yellow - 69.12
(69.60)
4.88 (5.01)
7.50
(7.73) -
[CuL] 423.94 207 Green 17.10 58.92
(59.44)
4.01 (3.77)
6.50 (6.60)
14.02 (14.99)
[NiL] 419.16 212 Red 23.20 60.24
(60.13)
4.10 (3.82)
6.80 (6.68)
14.35 (14.01) [ CoL (H2O)2 ] 455.32 215 Greenish 13.40 55.65
(55.35)
4.62 (4.39)
6.55 (6.15)
13.20 (12.94)
[ MnL(H2O)2] 451.33 270 Brown 18.46 55.80
(55.83)
4.50 (4.43)
6.40 (6.20)
12.78 (12.17)
[ FeL (H2O)2 ] 452.24 264 Brown 41.24 55.24
(55.83)
4.85 (4.43)
6.81 (6.20)
12.80 (12.17) mmol (0.122 g) of salicylic aldehyde in super dry
ethanol was refluxed for about 4 h. the precipitate thus formed was cooled to room temperature and collected by filtration, followed by recrystalliza- tion in ethanol (yield: 80%).
Synthesis of complexes
To a hot methanol solution (25 mL) of the ligand (0.01 mol), methnolic solution (25 mL) of metal chloride (0.01 mol) was added with constant stirring.
The pH of reaction mixture was adjusted to 7.5∼
8.5 by adding 10% alcoholic ammonia solution and refluxed for about 3 h, the precipitated solid metal complex was filtered off in hot condition and washed with hot methanol, petroleum ether (40∼60 oC) and dried over calcium chloride in vacuum desiccator (yield: 55%).
RESULT AND DISCUSSION Physical characteristics, micro analytical, and molar conductance data of ligand and metal com- plexes are given in Table 1. The analytical data of complexes revels 1: 1 molar ratio (metal: ligand) and corresponds well with the general formula [ML]
(where M = Cu(II) and Ni(II)) and [ML(H2O)2] (where M = Co(II), Mn(II) and Fe(III)). The mag- netic susceptibilities of Cu(II) and Ni(II)complexes at room temperature are consistent with square- planar geometry and that of Co(II), Mn(II) and Fe(III)
complexes with high spin octahedral structure with two water molecules coordinated to metal ion. The presence of two coordinated water molecules was confirmed by TGA-DTA analysis. The metal chelate solution in DMF shows low conductance and this supports their non-electrolyte nature.
1H-NMR spectra of ligand
The 1H-NMR spectrum of the free ligand in CDCl3
at room temperature shows the following signals.
2.18 δ (s, 3 H, C6-CH3), 2.55 δ (s, 3 H, N = C-CH3), 5.5 δ (s, 1 H, phenolic OH), 5.8 δ (s, 1 H, C5-H), 6.9∼7.5 δ (m, 8H, Phenyl ), 8.65 δ (s, 1 H, N = C-H) and 15.85 δ (s, 1 H, enolic OH of DHA moiety).
Infrared spectra
The IR spectrum of free ligand shows charac- teristic bands at 3060∼3300, 1703, 1657, 1354, and 1219 cm-1 assignable to intramolecular hydrogen bonded (υ OH), lactone carbonyl (υ C = O), azome- thine (υ C = N), aryl azomethine (υ C-N) and phenolic (υ C-O) stretching modes respectively.14-15 The ab- sence of a weak broad band in the 3060∼3300 cm-1 region, noted in the spectra of the metal complexes indicates deprotonation of the intramolecular hydro- gen bonded OH group on complexation and sub- sequent coordination of phenolic oxygen to the metal ion. This is further supported by upward shift in phenolic (υ C-O)16 to the extent of 30∼50 cm-1. On complexation, the υ (C = N) band is shifted to
Table 2. Magnetic and Electronic absorption spectral data of compounds Ligand/Complexes Magnetic moment µeff
(B.M.) Frequency in cm‐1
(ε in L mol‐1 cm‐1) Band Assignment Geometry
(H2L) - 31347 (9060)
40816 (9300)
I N C Ta
I N C T -
[CuL] 1.71 17825 (15)
26809 (773) 37313 (1289)
dxy→ dx2‐y2
MLCTb I N C T
Square planar
[NiL] Diamagnetic 17361 (92)
26666 (1085) dxy→ dx2‐y2
I N C T Square planar
[ CoL (H2O)2 ] 4.55 10660 (7)
18796 (208) 26385 (374)
dxy→ dx2‐y2
dyz → dx2‐y2
I N C T
Octahedral
[ MnL(H2O)2] 5.84 14727 (214)
21929 (2008) 26455 (1208)
dxy→ dx2‐y2
MLCT I N C T
Octahedral
[ FeL (H2O)2 ] 5.77 12787 (22)
18621 (82) 33898 (907)
dxy→ dz2
dxy → dx2‐y2
I N C T
Octahedral
aINCT: Intra-ligand charge transfer. bMLCT: Metal to ligand charge transfer.
lower wave number with respect to free ligand, de- noting that the nitrogen of the azomethine group is coordinated to the metal ion. This is supported by upward shift in υ C-N to the extent of 10∼50 cm-1.17 The IR spectra of metal chelates showed new bands in the 457∼540 and 407∼478 cm-1 regions which can be assigned to υ M-O and M-N vibrations res- pectively.18 The IR spectra of Co(II), Mn(II) and Fe(III) show a strong band in the 3150∼3600 cm-1 region, suggesting the presence of coordinated water in these metal complexes. The presence of coordi- nated water is further confirmed by the appearance of non-ligand band in the 830∼840 cm-1 region, assignable to the rocking mode of water.19 The pre- sence of coordinated water is also established and supported by TG/DTA analysis of these complexes.
Hence coordination takes place via phenolic oxygen and azomethine nitrogen of ligand molecule.
Magnetic susceptibility and electronic absorp- tion spectra
The magnetic and electronic spectral data is given in Table 2. The spectra of ligand exhibit two main peaks at 31347 and 40816 cm-1 attributed carbonyl π-π* and imino π-π* transitions respectively. The elec- tronic absorption spectrum of Cu(II) show three
bands at 17825, 26809 and 37313 cm-1, assignable to the transitions dxy → dx2-y2 and two intra-ligand transition bands. These electronic transitions and ob- served 1.71 B.M magnetic moment value suggests square-planar geometry around the Cu(II).18,20 The electronic absorption spectrum of Ni(II)complex consists of two bands at about 17361 cm-1 and 26666 cm-1 assignable to dxy → dx2-y2 and charge transfer transitions respectively. Observed electronic transi- tions, the diamagnetic nature and red colour of the complex suggests square-planar geometry for Ni(II) complex.21,22 The electronic absorption spectrum of Co(II) complex show three bands at 10660, 18796 and 26385 cm-1 which may be attributed to the transitions dxy → dz2, dyz → dx2-y2 and charge transfer respectively. Electronic transitions along with magnetic moment value 4.45 B.M. suggests high spin octahedral geometry for the Co(II) com- plex.23,24 The octahedral geometry is further su- pported by ratio υ2/ υ1 = 1.763 which is close to the value expected for octahedral geometry. The elec- tronic absorption spectrum of Mn(II)complex show three bands at 14727, 21929 and 26455 cm-1 assign- able to the transitions dxy → dz2, MLCT and charge transfer respectively. Electronic transitions along with magnetic moment value 5.84 B.M. which is
비대칭 Tetr adentate Schiff 염기 리간드의 전이금속 착물에 대한 합성 및 특성
almost close to spin only value (5.92 B.M.) suggests high spin octahedral geometry for the Mn(II) com- plex.23,25 The electronic absorption spectrum of Fe(III) complex show three weak bands at 12787, 18621 and 33898 cm-1 which may be assigned to the transi- tions dxy → dz2 dxy → dx2-y2 and charge transfer res- pectively. Electronic transitions together with mag- netic moment value 5.77 B.M. suggests high spin octahedral geometry for the Fe(III) complex.23,26
Thermal analysis
The simultaneous TG/DT analysis of metal com- plexes was studied from ambient temperature to 1000 oC in nitrogen atmosphere using α-Al2O3 as reference. In the TG curve of Cu(II) and Ni(II)com- plexes, no mass loss up to 270 oCindicates absence of coordinated water in these complexes.17 In the TG curve of Cu(II) complex, the first step of de- composition from 285 to 400 oC, with a mass loss 24.70% (calcd. 23.11%), an exothermic peak
∆Tmax = 335 oCin DTA may be attributed to the decomposition of non coordinated part of ligand.
The second slow step from 410∼905 oC with mass loss 58.80% (calcd. 61.46%), corresponds to decom- position of coordinated part of ligand. A broad en- dotherm in DTA is observed for this step. The mass of the final residue corresponds to stable CuO, 18.5%
(calcd. 17.82%). the TG curve of Ni(II) complex, show two step decomposition. The first step from 288 oCto 435 oC, with a mass loss 24.00% (calcd.
23.38%), an exothermic peak ∆Tmax = 330 oC in DTA may be attributed to the decomposition of non coordinated part of ligand. The slow decom- position in second step from 565∼868 oC with mass loss 60.20% (calcd. 62.05%), corresponds to removal of coordinated part of ligand. A broad endo- therm in DTA is observed for this step. The mass of the final residue 10% does not corresponds to any stoichiometry of end product.
The thermogram of Co(II) complex show mass loss 7.5% (calcd. 7.9%) in the range 180∼230 oC, an endothermic peak in this region ∆Tmin = 207 oC, corresponds to the removal of two coordinated water molecules.27,28 The anhydrous complex first show slow decomposition from 240∼550 oC, with
28% (calcd. 27.01%) mass loss, a broad exotherm
∆Tmax = 248 oC in DTA may be attributed to re- moval of non coordinated part of ligand. The second step decomposition from 580∼870 oC, with mass loss of 51.30% (calcd. 52.08%) corresponds to de- composition of coordinated part of ligand. A broad endotherm in DTA is observed for this step. The mass of the final residue corresponds to stable CoO, 10.25% (calcd. 12.94%). The TG curve of Mn(II) complex show first mass loss 7.20% (calcd.
7.97%) in the range 145∼210 oC, an endothermic peak in this region ∆Tmin = 175 oC, indicates re- moval of two coordinated water molecules. The anhydrous complex shows single step slow decom- position from 260∼1000 oC, with 52% mass loss, a broad endotherm in DTA indicates that the complex is thermally quite stable. The thermal profile of Fe(III) complex shows mass loss 7.5% (calcd. 7.96%) in the range 160∼250 oC, an endothermic peak in this region ∆Tmin = 207 oC, indicates loss of two coordinated water molecules. The anhydrous com- plex first show slow decomposition from 250∼
625 oC, with 27% (calcd. 27.20%) mass loss, a broad exotherm ∆Tmax = 283 oC in DTA may be attributed to removal of non coordinated part of ligand. The second step decomposition is sharp from 655∼665 oC, with mass loss of 14.50%, a sharp endotherm in DTA at 655 oC is observed for this step. The third step decomposition is from 670∼
800 oC with 22% mass loss. The mass of the final residue 9.2% does not corresponds to any stoichio- metry of end product.
Kinetic calculations
The kinetic and thermodynamic parameters viz order of reaction (n), energy of activation (Ea), fre- quency factor (log A), entropy of activation (∆S#) and free energy change (∆G#) together with cor- relation coefficient (r) for non-isothermal decom- position of metal complexes have been determined by Coats-Redfern integral method.29 Kinetic study was not attempted for decomposition stage such as in Fe(III) chelate which occurs within a narrow tem- perature range resulting in a too steep TG curve for enough data to be collected. The data is given in
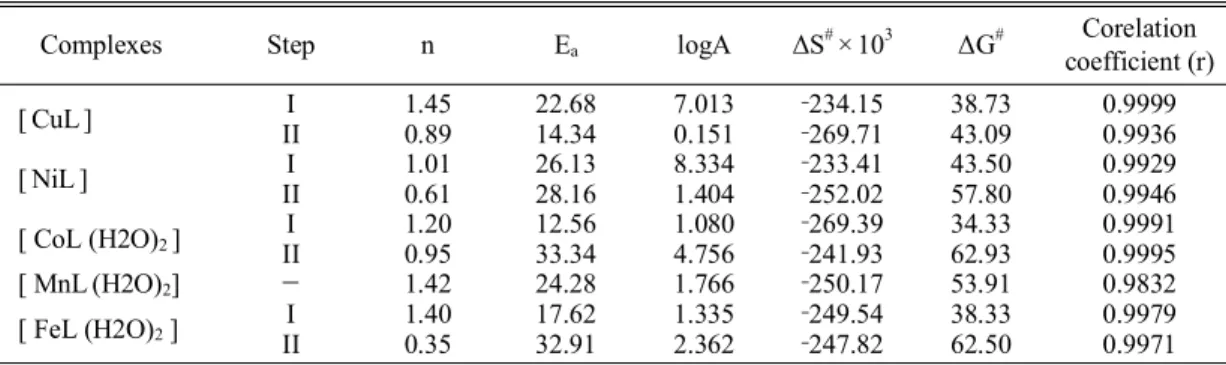
Table 3. Kinetic parameters of metal complexes calculated by the Coats-Redfern (CR) method
Complexes Step n Ea logA ∆S# ×103 ∆G# Corelation
coefficient (r)
[CuL] I 1.45 22.68 7.013 ‐234.15 38.73 0.9999
II 0.89 14.34 0.151 ‐269.71 43.09 0.9936
[NiL] I 1.01 26.13 8.334 ‐233.41 43.50 0.9929
II 0.61 28.16 1.404 ‐252.02 57.80 0.9946
[ CoL (H2O)2 ] I 1.20 12.56 1.080 ‐269.39 34.33 0.9991
II 0.95 33.34 4.756 ‐241.93 62.93 0.9995
[ MnL(H2O)2] - 1.42 24.28 1.766 ‐250.17 53.91 0.9832
[ FeL (H2O)2 ] I 1.40 17.62 1.335 ‐249.54 38.33 0.9979
II 0.35 32.91 2.362 ‐247.82 62.50 0.9971
Ea in kJ mol-1, logA in min-1, ∆S* in kJK-1mol-1 and ∆G* in kJ mol-1
Table 3. The calculated free energy of activation is relatively low indicating the autocatalytic effect of metal ion on thermal decomposition of the com- plex.30,31 ∆S# values were negative, which indicates a more ordered activated state that may be possible through the chemisorptions of oxygen and other decomposition products. The more ordered nature may be due to the polarization of bonds in acti- vated state which might happen through charge transfer electronic transition.
Powder X-ray diffraction
The x-ray diffractogram of metal complexes was scanned in the range 5∼100o at wavelength 1.543 Å.
The diffractogram and associated data depict the 2 θ value for each peak, relative intensity and inter- planar spacing (d-values). The diffractogram of Cu(II) complex had nine reflections with maxima at 2 θ = 8.473o corresponding to d value 10.427 Å. The diffrac- togram of Ni(II) complex shows twelve reflections with maxima at 2 θ = 22.504o corresponding to d value 3.954 Å. The diffractogram of Co(II) complex had thirteen reflections with maxima at 2 θ = 59.845o corresponding to d value 1.544 Å. Where as The diffrac- togram of Mn(II) complex had seven reflections with maxima at 2 θ = 36.129o corresponding to d value 2.484 Å. The x-ray diffraction pattern of these complexes with respect to major peaks having re- lative intensity grater than 10% have been indexed by using computer programme.32 The above indexing method also yields miller indices (hkl), unit cell parameters and unit cell volume. The unit cell of
Cu(II) complex yielded values of lattice constants a = 16.4410 Å, b = 13.8836 Å, c = 3.8408 Å and unit cell volume V = 876.8318 Å3. In concurrence with these cell parameters, the condition such as a ≠ b ≠ c and α = β = γ = 90o required for sample to be orthorhombic were tested and found to be satisfac- tory. Hence it can be concluded that Cu(II) complex has orthorhombic crystal system. The unit cell of Ni(II) complex yielded values of lattice constants a = 14.8910 Å, b = 8.9216 Å, c = 8.4799 Å and unit cell volume V = 910.4587 Å3. The unit cell of Co(II) complex yielded values of lattice constants a = 10.8962 Å, b = 5.4401 Å, c = 7.9007 Å and unit cell volume V = 441.7221 Å3. In concurrence with these cell parameters, the condition such as a ≠ b ≠ c and α = γ = 90o ≠ β required for sample to be mono- clinic were tested and found to be satisfactory.
Hence it can be concluded that Ni(II) and Co(II) complex has monoclinic crystal system. The unit cell of Mn(II) complex yielded values of lattice constants a = 5.2046 Å, b = 5.2046 Å, c = 16.5209 Å and unit cell volume V = 447.5319 Å3. In con- currence with these cell parameters, the condition such as a = b ≠ c and α = β = γ = 90o required for sample to be tetragonal were tested and found to be satisfactory. Hence it can be concluded that Mn(II) complex has tetragonal crystal system. The expe- rimental density values of the complexes were deter- mined by using specific gravity method 33 and found to be 3.222, 1.5024, 1.7200 and 3.3654 g·cm-3 for Cu(II), Ni(II), Co(II) and Mn(II) complexes respec- tively. By using experimental density values, mole-
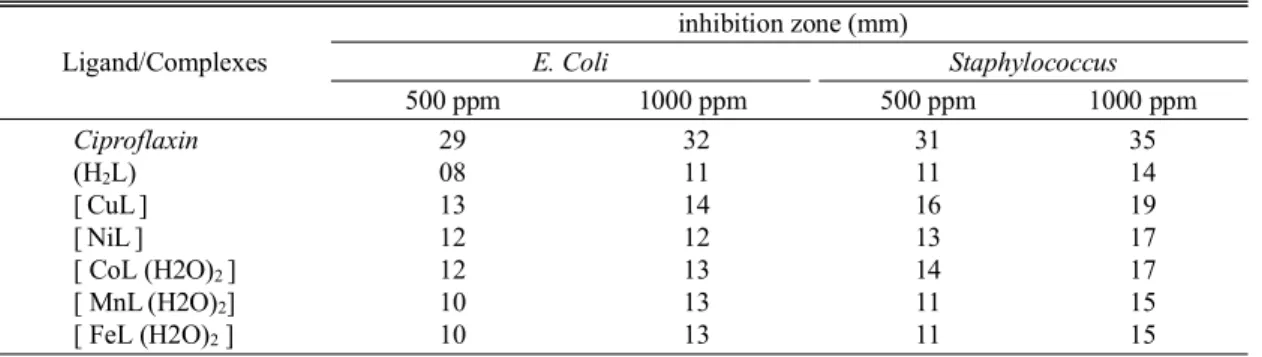
비대칭 Tetr adentate Schiff 염기 리간드의 전이금속 착물에 대한 합성 및 특성 Table 4. Antibacterial activity of compounds
Ligand/Complexes
inhibition zone (mm)
E. Coli Staphylococcus
500 ppm 1000 ppm 500 ppm 1000 ppm
Ciproflaxin 29 32 31 35
(H2L) 08 11 11 14
[CuL] 13 14 16 19
[NiL] 12 12 13 17
[ CoL (H2O)2 ] 12 13 14 17
[ MnL(H2O)2] 10 13 11 15
[ FeL (H2O)2] 10 13 11 15
Table 5. Yield of Mycelial dry weight in mg (% inhibition)
Ligand/Complexes Aspergillus Niger Trichoderma
250 ppm 500 ppm 250 ppm 500 ppm
Control 79 79 70 70
(H2L) 61 (23) 24 (70) 40 (43) 19 (73)
[CuL] 40 (49) 10 (87) 20 (71) 02 (97)
[NiL] 43 (46) 13 (84) 22 (69) 03 (96)
[ CoL (H2O)2 ] 50 (37) 16 (80) 32 (54) 04 (94)
[ MnL(H2O)2] 53 (33) 18 (77) 34 (51) 08 (89)
[ FeL (H2O)2 ] 54 (32) 18 (77) 35 (50) 12 (83)
cular weight of complexes, Avogadro’s number, volume of the unit cell, the number of molecules per unit cell were calculated by using equation ρ = nM/NV and was found to be four, two, one and two for Cu(II), Ni(II), Co(II) and Mn(II) complexes respectively. With these values, theoretical density were computed and found to be 3.2109, 1.5287, 1.7114 and 3.3486 g·cm-3 for respective complexes.
Comparison of experimental and theoretical density value shows good agreement within the limits of experimental error.34
Antimicrobial activity
The antimicrobial activity of ligand and metal complexes were tested in vitro against bacteria such as Staphylococcus aureus and Escherichia coli by paper disc plate method.35 The compounds were tested at the concentration 0.5 mg·mL-1 and 1 mg·mL-1 in DMF and compared with known antibiotics viz ciproflaxin (Table 4). For fungicidal activity, com- pounds were screened in vitro against Aspergillus Niger and Trichoderma by mycelia dry weight method16 with glucose nitrate media. The compounds were tested at the concentration 250 and 500 ppm in
DMF and compared with control (Table 5). From Tables 4 and 5, it is clear that the inhibition by metal chelates is higher than that of a ligand and results are in good agreement with previous findings with respect to comparative activity of free ligand and its complexes.16,35 Such enhanced activity of metal chelates is due to lipophilic nature of the metal ions in complexes.36 The increase in activity with concentration is due to the effect of metal ions on the normal process. The action of compounds may involve the formation of hydrogen bond with the active center of cell constituents, resulting in interference with the normal cell process.37
CONCLUSION
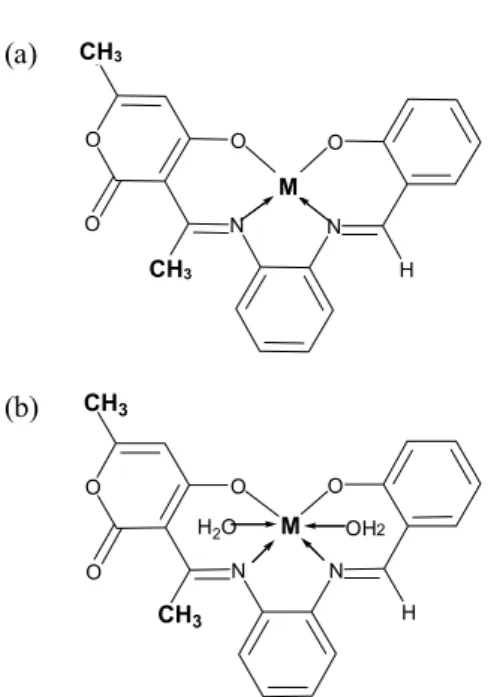
In the light of above discussion we have proposed square-planar geometry for Cu(II) and Ni(II) com- plexes and octahedral geometry for Co(II), Mn(II) and Fe(III) complexes. On the basis of the physico- chemical and spectral data discussed above, one can assume that the ligand behave as dibasic, ONNO tetradentate, coordinating via phenolic oxygen and imino nitrogen as illustrated in Fig. 2. The complexes
M
O O
H N O
O
CH3
CH3
N
M
O O
H N O
O CH3
CH3 N
H2O OH2
(a) CH3
CH3
M
(b)
Fig. 2. The proposed structure of the complexes: (a) when M = Cu(II)and Ni(II); (b) when M = Co(II), Mn(II) and Fe(III).
are biologically active and show enhanced anti- microbial activities compared to free ligand. Thermal study reveals thermal stability of complexes. The XRD study suggests orthorhombic crystal system for Cu(II) complex and tetragonal crystal system for Mn(II) complex, where as monoclinic crystal system for Ni(II) and Co(II) complexes.
REFERENCES
1. Atkins, R.; Brewer, G.; Kokot. E.; Mockler, G. M.;
Sinn, E. Inorg. Chem. 1985, 24, 127.
2. Yuan, R.; Chai, Y.; Liu, D.; Gao, D.; Li, J.; Yu, R.
Anal. Chem. 1993, 65, 2572.
3. Ramesh, R.; Saganthy, P. K.; Natarajan, K. Synth.
React. Inorg. Met-Org. Chem. 1996, 26, 47-60.
4. Ohashi, Y. Bull. Chem. Soc. Jpn. 1997, 70, 1319.
5. Jeong, B.-G.; Rim, C.-P.; Chae, H.-N.; Chjo, K.-H.;
Nam, K.-C.; Choi, Y.-K. Bull. Korean Chem. Soc.
1996, 17, 688.
6. Singh, P.; Geol, R. L.; Singh, B. P. J. Indian Chem.
Soc. 1975, 52, 958.
7. Mahindru, A.; Fisher, J. M.; Rabinovitz, M. Nature 1983, 303, 64.
8. Patel, P. R.; Thaker, B. T.; Zele, S. Indian J. Chem.
1999, 38A, 563.
9. Phan, N. T. S.; Brown, D. H.; Adams, H.; Spey, S.
E.; Styring, P. Dalton Trans. 2004, 9, 1348.
10. Tan, S. F.; Ang, K. P. Transition Met. Chem. 1988, 13, 64-68.
11. Marzilli, L. G.; Marzilli, P. A.; Halpern, J. J. Am.
Chem. Soc. 1971, 93, 1374.
12. Jha, N. K.; Joshi, D. M. Synth. React. Inorg. Met-Org.
Chem. 1984, 14, 455.
13. Qayyoom, M. A.; Hanumanthu, P.; Ratnam, C. V.
Indian J. Chem. 1982, 21B, 883.
14. Ramarao, N.; Rao, V. P.; Tyaga, R. V. J.; Ganorkar, M. C., Indian J. Chem. 1985, 24A, 877.
15. Tan, S. F.; Ang, K. P.; Jatchandran, H. L. Transition Met. Chem. 1984, 9, 390-395.
16. Venketeswar, R. P.; Venkata, N. A. Indian J. Chem.
2003, 42A, 896.
17. Dash, D. C.; Panda, A. K.; Jena, P.; Patjoshi, S. B.;
Mahapatra, A. J. Indian Chem. Soc. 2002, 79, 48-50.
18. Natrajan, R.; Antonysamy, K.; Thangaraja, C.
Transition Met. Chem. 2003, 28, 29-36.
19. Nakamoto, K. Infrared Spectra of Inorganic and Coordination Compounds (Wiley Interscience, New York), 1970, pp 159, 167, 214.
20. Raman, N.; Pitchaikaniraja, Y.; Kulandaisamy, A. P.
Indian Acad. Sci.(Chem. Sci.) 2001, 113(3), 183-189.
21. Reddy, K. M.; Halli, M. B.; Hiremath, A. C. J.
Indian Chem. Soc. 1994, 17, 118.
22. Mokhle,s A.-E. M. J. Chinese Chem. Soc. 2001, 48, 153-158.
23. Lever, A. B. P. Inorganic Electronic Spectroscopy Elsevier, Amsterdam, 1968, pp 275-361.
24. Satpathy, K.C.; Panda, A. K.; Mishra, R.; Pande, I.
Transition Met. Chem. 1991, 16, 410.
25. Sacconi, L.; Transition Met. Chem. 1968, 61, 943.
26. Patel, M. N.; Patel, V. J. Synth. React. Inorg. Met.
Org. Chem. 1989, 19, 137.
27. Bhave, N. S.; Kharat, R. B. J. Inorg. Nucl. Chem.
1980, 42, 977.
28. Revankar, V. K.; Mahale, V. B. Indian J. Chem. 1979, 28A, 683.
29. Coats, A. W.; Redfern, I. P. Nature 1964, 20, 68.
30. El-Awad, A. M. J. Therm. Anal. Cal. 2000, 61, 197.
31. Impura, A.; Inoue, Y.; Yasumori, I. Bull. Chem. Soc.
Jpn. 1983, 56, 2203.
32. Carvajal, J. R. Roisnel, T. Winplotr, A Graphic Tool for Powder Diffraction Laborataire leon brillouin (ceal/enrs) 91191 gif suryvette cedex, 2004, France.
33. Shoemaker D. P.; Garland C.W. Experiments in Physical Chemistry, 5th edn, McGraw-Hill Inter- national Edition, New York, 1989, pp 17-27.
34. Deshmukh M.B., Dhongade-Desai S.; Chavan S. S.
Indian J. Chem. 2005, 44, 1659.
35. Mane P. S., Shirodkar S. G., Arbad B. R. and Chondhekar T. K. Indian J. Chem. 2001, 40, 648.
36. Mishra L.; Singh V.K. Indian. J. Chem. 1993, 32A, 446.
37. Dharamraj N. Viswanathamurthi P.; Natarajan K.
Transition Met. Chem 2001, 26, 105.