The Burden of Cancer in Korea during 2012: Findings from a Prevalence-Based Approach
Cancer causes a significant deterioration in health and premature death and is a national socioeconomic burden. This study aimed to measure the burden of cancer using the disability-adjusted life year (DALY) metric based on the newly adopted methodology from the Global Burden of Disease Study in 2010. This study was conducted based on data from the Korean National Cancer Registry. The DALYs were calculated using a prevalence-based method instead of the incidence-based method used by previous studies. The total burden of cancer in 2012 was 3,470.79 DALYs per 100,000 persons. Lung cancer was the most prevalent cancer burden, followed by liver, stomach, colorectal, and breast cancer. The DALYs for lung, liver, stomach, colon and rectum, and pancreatic cancer were high in men, whereas the DALYs for breast, lung, stomach, colorectal, and liver cancer were high in women. Health loss from leukemia and cancer of the brain and nervous system was prevalent for those younger than age 20; from stomach, breast, and liver for those aged 30-50; and from lung, colon and rectum, and pancreas for a large proportion of individuals over the age of 60. The most important differences were that the DALYs were calculated by prevalence and that other components of the DALYs were measured by a population-based perspective. Thus, prevalence-based DALYs could provide more suitable data for decision making in the healthcare field.
Keywords: Burden of Disease; Disability-Adjusted Life Years; Neoplasms; Prevalence;
Korea Young-hoon Gong,1 Seok-Jun Yoon,1
Min-Woo Jo,2 Arim Kim,1 Young Ae Kim,3 Jihyun Yoon,1 Hyeyoung Seo,1
and Dongwoo Kim1
1Department of Preventive Medicine, Korea University College of Medicine, Seoul, Korea;
2Department of Preventive Medicine, University of Ulsan College of Medicine, Seoul, Korea; 3Cancer Policy Branch, National Cancer Control Institute, National Cancer Center, Goyang, Korea Received: 21 January 2016
Accepted: 19 May 2016 Address for Correspondence:
Seok-Jun Yoon, MD
Department of Preventive Medicine, Korea University College of Medicine, 73 Inchon-ro, Seongbuk-gu, Seoul 02841, Korea E-mail: [email protected]
https://doi.org/10.3346/jkms.2016.31.S2.S168 • J Korean Med Sci 2016; 31: S168-177
INTRODUCTION
As the epidemiological transition continues to progress, cancer has become one of the most prevalent diseases globally. Cancer imposes a large burden on national health systems, and this phenomenon has commonly appeared in both developed and developing countries (1). In Korea, cancer has been the leading cause of mortality since the beginning of the 2000s, and the in- cidence of ‘all cancers’ has increased annually (2). The econo- mic burden of cancer also increases continuously which has been measured in many studies (3-5).
It is important to understand the magnitude of the burden of disease on a quantitative scale as this can affect decisions made regarding health-care policies such as setting priorities for allo- cation of resources, health-care research and interventions, and may identify the effects of such interventions. In addition, it may help identify vulnerable groups. One of the metrics used in the summary measures of population health is the disability- adjusted life year (DALY). A DALY for a disease is equal to the sum of the years of life lost (YLL) due to premature death and the years lived with disability (YLD) due to the morbidity of the disease. DALY has been a commonly used metric for estimat- ing the global burden of disease since the 1990s and was also
introduced in Korea and used in many studies measuring the burden of several diseases (6-10).
The Institute for Health Metrics and Evaluation, which leads the Global Burden of Disease (GBD) research, published the GBD for 2010 in 2013 (11). This study introduced new method- ology for measuring the burden of disease in many aspects. The key aspects of the GBD 2010 study include, first, that DALYs were calculated based on the prevalence of disease instead of the incidence (12). Second, age-weighting and discounting for time, which had been debated, were omitted in the calculation of DALYs (13). Third, the prevalence of disease was analyzed based on a scheme comprising cause, sequelae, and health state, which place emphasis on the disability that patients experienc- ed (13). Fourth, the disability weight, which quantifies health losses for nonfatal outcomes of disease, was surveyed from the general public instead of from the healthcare professionals us- ing different methods of measurement than those used in a previous study (14). Table 1 shows the comparison approaches by incidence-based and by prevalence-based for DALYs esti- mation.
Because the purpose of the GBD study was to estimate the burden of disease for the entire country, they gathered all of the available data and developed Bayesian meta-regression tools
such as DisMod-MR and used many assumptions and model- ing methods to provide estimation. In comparison, the burden of disease study in Korea measured YLD by estimating incidence cases using National Health Insurance Service (NHIS) data and YLL using the mortality data and life tables from the Korean Na- tional Statistical Office (7-9). Although the burden of disease study in Korea has evolved under Korea’s unique healthcare system and with the existence of health insurance for all popu- lation with a single insurer, which could identify data on the medical services used by individuals within the country, limita- tions exist caused by the properties of the administrative data, such as the validity of the definition of incidence case and of disease coding (15).
DALYs calculated by a prevalence-based approach are con- sistent with a cross-sectional and population-based perspective (13). In terms of the healthcare policy, prevalence-based DALYs could provide appropriate data because all nonfatal health loss is captured by the prevalence-based approach, whereas only cases arising from a new diagnosis are captured by the incidence- based approach. For this reason, this study aimed to measure the DALYs of cancer in Korea in 2012 by a prevalence-based ap- proach as used in the GBD 2010 study. In addition, National Cancer Registry data and statistics were used to provide valid estimations of YLD.
MATERIALS AND METHODS
This study used a model to determine the distribution of com- mon sequelae based on National Cancer Registry data and the Annual Report on Cancer Statistics from 2008 to 2012, which provided statistics pertaining to cancer incidence, 5-year preva- lence, 5-year survival rate, and survival rate by stage for each cancer. In comparison with the GBD 2010 study, this study mod- ified the classification of some cancers, such as ‘kidney and oth- er urinary organs’ that were divided into kidney cancer (C64)
and other urinary organ cancer (C65-66) and added bone and connective tissue cancer (C40-41, 49). As a result, 30 categories of cancers were studied based on the disease classification from the GBD 2010 study and mapped using the International Clas- sification of Disease (ICD) (16). The 30 cancers and matched ICD codes were as follows: mouth cancer (C00-08); cancer of other parts of the pharynx and oropharynx (C9-10, 12-13); na- sopharyngeal cancer (C11); esophageal cancer (C15); stomach cancer (C16); colorectal cancer (C18-21); liver cancer (C22); gall- bladder and biliary tract cancer (C23-24); pancreatic cancer (C25); laryngeal cancer (C32); trachea, bronchus, and lung can- cers (C33-34); bone and connective tissue cancer (C40-41, 49);
malignant melanoma of the skin (C43); non-melanoma skin cancer (C44); breast cancer (C50); cervical cancer (C53); uter- ine cancer (C54); ovarian cancer (C56); prostate cancer (C61);
testicular cancer (C62); kidney cancer (C64); other urinary or- gan cancer (C65-66); bladder cancer (C67); brain and nervous system cancer (C70-72); thyroid cancer (C73); Hodgkin’s dis- ease (C81); non-Hodgkin’s lymphoma (C82-85, 96); multiple myeloma (C88-90); leukemia (C91-95); and other neoplasms and unspecified cancer.
Early diagnosis of cancer using screening tests and improve- ment of treatment techniques have increased the number of cancer survivors who does not suffer by cancer anymore. To distinguish patients with cancer from cancer survivors or pa- tients who are cancer-free, a prevalence case was defined as a cancer patient who survived 5 years after registration of their diagnosis and whose mortality rate was approximately the same as a person who is cancer-free (2). Prevalence cases were includ- ed for patients who had survived as of January 1, 2013, and who were registered from January 1, 2008, to December 31, 2012, ac- cording to the annual report from the National Cancer Registry Statistics. The cancer patients with multiple primary sites were calculated in duplicate.
YLL caused by each cancer were estimated by using the mor- tality data and statistics on the cause of death from the Korean National Statistical Office in 2012. The causes of death that should not have been identified or were misclassified, which are called garbage codes, were reassigned to a probable underlying cause of death according to a developed algorithm (17). The standard expected years of life lost (SEYLL) was adopted as a metric rep- resenting premature death. Life expectancy according to age and sex was referenced using the Korean standard life expec- tancy of life table in 2012 from the Korean National Statistical Office, which is different from the reference standard life table of the GBD 2010 study (13). Regarding the calculation of the YLL, age weighting and time discount were not applied as in the GBD 2010 study. The following formula was used for the calculation of YLL:
YLL = SEYLL = ∑lx = 0dxex*
dx: Number of deaths at each age x Table 1. Comparison approaches by incidence-based and by prevalence-based for
DALY estimation
DALY component Incidence-based approach Prevalence-based approach YLD Calculation YLDcause = Icause * DWcause *
Lcause
YLDsequela = Psequela * DWhealth state(s) I: number of incident cases P: number of prevalent cases L: average duration of the case
until remission or death (years)
DW By healthcare professional By general population
YLL Calculation YLLcause = Ncause * L
N: number of deaths for the given age A L: a standard loss function specifying years of life lost for a
death at age A Age weighting &
discount
Both applied Both omitted
software package DisMod II DisMod-MR
DALY, disability-adjusted life year; YLD, years lived with disability; YLL, years of life lost; DW, disability weight.
ex*: Standard life expectancy at age x l: Last observed age
The GBD 2010 study adopted a prevalence-based approach as a new methodology where every burden of disease was cap- tured whether it was caused by the incidence or by the preva- lence of the disease. In contrast to a previous study that was in- cidence-based and in which the YLD of disease were calculated from the incidence to the end of the disease, the YLD were cal- culated for only 1 year using a prevalence-based method. There- fore, discounting for the time of future health loss in YLD was no longer needed. In addition, weighting by age was also omit- ted. The formula used for the calculation of YLD was simplified as follows:
YLD = prevalence (sequelae) × disability weight (health state)
To estimate the YLD of the disease, this study used a cause- sequelae-health states scheme, which was introduced by the GBD 2010 study. Sequelae are designed to capture the conse- quences of disease, and health states are designed to reflect com- mon sequelae of the disease (12). Most cancers have four com- mon sequelae that are categorized into diagnosis and primary therapy, controlled, metastatic, and terminal phases. Sequelae of all cancers are same with health states.
Because the National Cancer Registry registered patients’
status by surveillance, epidemiology, and end results (SEER) stage, we converted the distribution by SEER stage to the se- quelae distribution from the burden of disease study by follow- ing their modeling. Following the assumptions is the basis for the model of conversion. It was assumed for every registered patient that their cancer occurred on the first day of the year.
For every patient who died, it was assumed that their death oc- curred in the middle of the year of their registered stage. The relative survival rate provided by the Annual Report of Cancer Statistics was used as an absolute survival rate. In cases where the relative survival rate was over 100%, a 100% survival rate was applied. If the distribution by SEER stage was not provided in 2008, the mean distribution from other years was applied. If the survival rate of the designated cancer was not provided, that of ‘other neoplasms’ was used as the cancer.
The SEER stage comprises the following categories: local, re- gional, distant, and unknown. The distributions of the registered cancer patients from 2008 to 2012 by SEER stage were confirm- ed, and the patients in the ‘unknown’ category were redistrib- uted as a ratio of the other stages. In addition, the number of deaths in 2012 and the number of survivors by each stage and by each year were calculated using the relative survival rates from 1 to 5 years after diagnosis and survival rates by SEER stage that were provided by the Annual Report on Cancer Statistics.
In regards to the survivors by each stage and by each year, pa- tients who were diagnosed in 2012 (excluding the number of
deaths) were designated as having the health state of ‘diagnosis and primary treatment’. The number of patient deaths was des- ignated as ‘terminal’. Survivors who were diagnosed from 2008 to 2011 and categorized as ‘distant’ were designated as ‘metas- tasis’, and the remaining patients were designated as ‘controlled’.
The designations of ‘metastasis’ and ‘controlled phase’ for pa- tients were modified based on the natural history of each can- cer. To determine the distribution of cancer-specific sequelae such as stoma due to colorectal cancer, laryngectomy due to la- ryngeal cancer, urinary incontinence due to bladder cancer, and incontinence and impotence due to prostate cancer, we used the 2011 National Disability Survey and analyzed the 2012 National Patient Sample Data from the review of health insur- ance and assessment services.
Disability weight, another component used to calculate YLD, is used to capture the severity of the health loss as a consequence of disease (12) and has a value from 0 to 1. Therefore, every health state is distributed between two values. A value of 0 indicates a health state equivalent to full health, and a value of 1 indicates a health state equivalent to death (14). In accordance with the population-oriented perspective of the GBD 2010 study, the disability weight of a health state was also newly evaluated us- ing a population-based survey with paired comparisons of the lay descriptions that described the two health states (18). We used the newly measured disability weights of the health states related to cancers. If a patient had two health states, for exam- ple, a controlled patient who has a stoma, the disability weight was calculated by considering the two states together. Because the value of the disability weight should be < 1, the following formula was used:
DWab = 1-(1-DWa) × (1-DWb) DWa: disability weight of health state a
Ethics statement
The study protocol was approved by the institutional review board of Korea University [IRB No.1040548-KU-IRB-13-164-A- 1(E-A-1)(E-A-1)]. Informed consent was exempted by the board.
RESULTS
The total population of Korea in 2012 was 50,832,898 persons according to statistics compiled by the Ministry of the Interior.
The total number of cancer cases was 734,065, which included 5-year cancer survivors, with an overall prevalence of 1.44%. The prevalence according to sex, age group, and cancer is shown in Table 2. The prevalence of female cases was higher than that of male cases (54% vs. 46%), and the highest prevalence was in patients aged 50-60 years (48.44%). Thyroid cancer was the most common cancer type (179,019 cases, 24.41% of all cancers), fol- lowed by stomach (112,419 cases, 15.33%), colorectal (104,348 cases, 14.23%), breast (69,657 cases, 9.50%), and lung (39,074
cases, 5.33%) cancer.
The burden of cancers in 2012 as measured by the preva- lence-based approach was 3,470.79 DALYs per 100,000 persons (1,764,302 DALYs). Table 3 shows the burden of all cancers. Lung cancer produced the highest burden (594.61 DALYs per 100,000), followed by liver (523.43 DALYs per 100,000 persons), stomach
(449.75 DALYs per 100,000 persons), colorectal (383.13 DALYs per 100,000 persons), and breast (190.31 DALYs per 100,000 per- sons) cancer.
Despite the fact that the prevalence of cancer was higher in females compared with males, the health loss owing to cancer in males (3,759.12 DALYs per 100,000 male persons) was much Table 2. Demographic characteristics of the prevalent cancer cases in 2012
Items for groups No. of prevalent cases %
Male:Female 335,520:398,555 46:54
Age group, yr 0 82 0.01
1-4 1,086 0.15
5-9 1,417 0.19
10-14 1,315 0.18
15-19 2,221 0.30
20-24 3,618 0.49
25-29 7,728 1.05
30-34 19,408 2.64
35-39 32,530 4.43
40-44 53,432 7.28
45-49 66,486 9.06
50-54 96,013 13.08
55-59 93,013 12.67
60-64 85,336 11.62
65-69 81,228 11.07
70-74 86,731 11.82
75-79 60,716 8.27
≥ 80 41,715 5.68
Cancer Mouth cancer (C00-08) 5,567 0.76
Cancer of other parts of the pharynx and oropharynx (C9-10,12-13) 2,476 0.34
Nasopharyngeal cancer (C11) 1,492 0.20
Esophageal cancer (C15) 5,020 0.68
Stomach cancer (C16) 112,419 15.33
Colorectal cancer (C18-21) 104,348 14.23
Liver cancer (C22) 35,427 4.83
Gallbladder and biliary tract cancer (C23-24) 9,665 1.32
Pancreatic cancer (C25) 5,496 0.75
Laryngeal cancer (C32) 4,241 0.58
Trachea, bronchus and lung cancers (C33-34) 39,074 5.33
Bone and connective tissue cancer (C40-41, 49) 4,930 0.67
Malignant melanoma of skin (C43) 1,688 0.23
Non-melanoma skin cancer (C44) 14,931 2.04
Breast cancer (C50) 69,657 9.50
Cervical cancer (C53) 16,128 2.20
Uterine cancer (C54) 8,077 1.10
Ovarian cancer (C56) 7,439 1.01
Prostate cancer (C61) 35,281 4.81
Testicular cancer (C62) 1,000 0.14
Kidney cancer (C64) 15,176 2.07
Other urinary organ cancer (C65-66) 2,441 0.33
Bladder cancer (C67) 12,886 1.76
Brain and nervous system cancer (C70-72) 4,629 0.63
Thyroid cancer (C73) 179,019 24.41
Hodgkin’s disease (C81) 1,036 0.14
Non-Hodgkin’s lymphoma (C82-85, 96) 14,641 2.00
Multiple myeloma (C88-90) 2,948 0.40
Leukemia (C91-95) 7,654 1.04
Other neoplasms and unspecified cancer 9,289 1.27
higher than that for females (2,917.74 DALYs per 100,000 female persons). In males, lung cancer produced the highest burden (752.62 DALYs per 100,000 male persons), followed by liver (730.72 DALYs per 100,000 male persons), stomach (535.14 DALYs per 100,000 male persons), colorectal (418.47 DALYs per 100,000 male persons), and pancreatic (182.80 DALYs per 100,000 male persons) cancer. In females, the DALYs for breast cancer (386.7 DALYs per 100,000 female persons) was higher than that for lung (355.47 DALYs per 100,000 female persons), stomach (327.40 DALYs per 100,000 female persons), colorectal (323.02 DALYs per 100,000 female persons), or liver (246.76 DALYs per 100,000 female persons) cancer. Fig. 1 shows the differences in DALYs of each cancer according to sex.
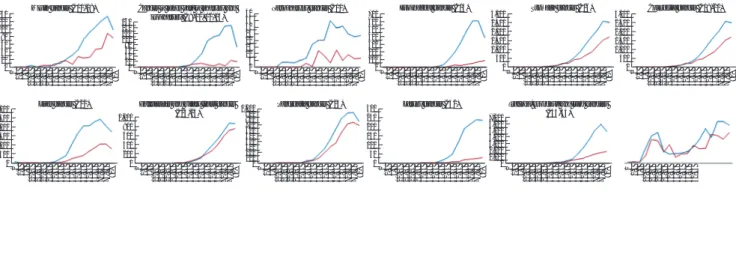
The health loss associated with most cancers increased sharp- ly from the age of 30 and peaked around 70 years of age. The bur- den of breast cancer, thyroid cancer, and female-specific can- cers, except for cervical cancer, shared a similar trend of peak- ing around 50 years of age. The burden of leukemia and brain and nervous system cancer was relatively higher for individuals of a younger age and increased more slowly compared with oth-
er cancers. Bone and connective tissue cancer showed 2 peaks, one for those aged 10-20 years and one for those aged 70 years.
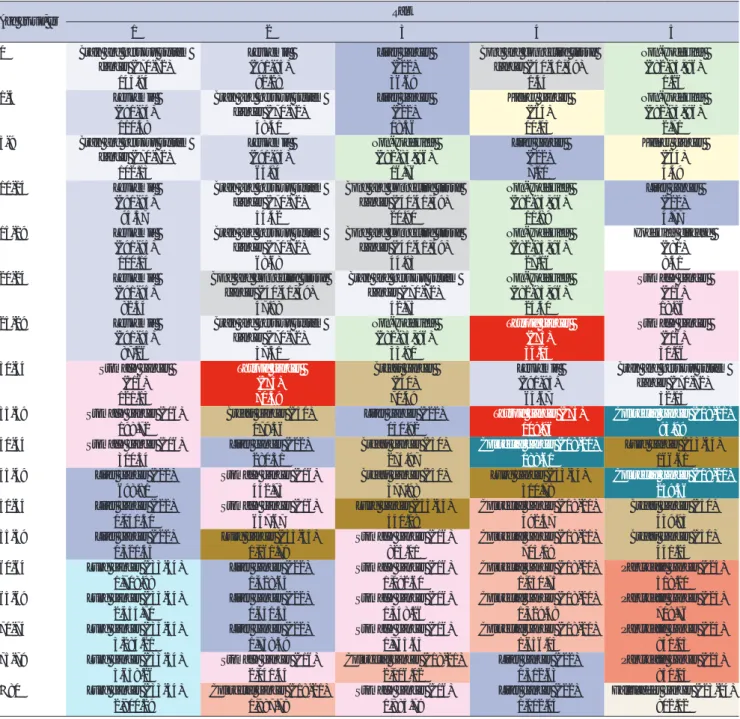
Cancers that showed a higher burden for each age group are listed in Table 4. Brain and nervous system cancer and leuke- mia were ranked first or second until the age of 20 years. For those aged 30-50 years, stomach, breast, and liver cancer pro- duced a higher burden than other cancers, whereas for patients over 60 years of age, lung, liver, stomach, colorectal, and pan- creatic cancer consistently produced a higher burden.
The total burden by age was low until the late 20s and then grew rapidly until 70 years of age followed by a slow decline. The loss of health for women was higher than that for men aged 25- 49, owing to female-specific cancers and thyroid cancer. Over age 50, a rapid increase was seen in men compared with wom- en until the age of 70, and over age 70, a significant decrease was seen for men compared with women. The change in the burden of each cancer with age and sex is shown in Fig. 2. The plots of health losses based on both age and sex of each cancer have various shapes in accordance with the characteristics of each cancer.
Table 3. Rank of DALYs per 100,000 persons for each cancer type
Rank Cause DALYs per 100,000
Mean Upper Lower
1 Trachea, bronchus, and lung cancers (C33-34) 594.61 600.97 588.88
2 Liver cancer (C22) 523.43 529.36 518.20
3 Stomach cancer (C16) 449.75 469.92 432.25
4 Colorectal cancer (C18-21) 383.13 400.46 367.98
5 Breast cancer (C50) 190.31 197.24 184.36
6 Pancreatic cancer (C25) 176.17 176.98 175.41
7 Gallbladder and biliary tract cancer (C23-24) 126.10 127.74 124.66
8 Other neoplasms and unspecified cancer 117.09 118.88 115.52
9 Leukemia (C91-95) 110.09 111.32 108.96
10 Thyroid cancer (C73) 102.03 119.05 83.42
11 Brain and nervous system cancer (C70-72) 86.98 87.70 86.36
12 Non-Hodgkin’s lymphoma (C82-85, 96) 82.76 85.20 80.58
13 Prostate cancer (C61) 61.15 67.23 55.86
14 Esophageal cancer (C15) 59.75 60.60 58.99
15 Cervical cancer (C53) 59.20 61.86 56.90
16 Ovarian cancer (C56) 54.33 55.51 53.27
17 Kidney cancer (C64) 50.52 53.13 48.26
18 Bladder cancer (C67) 44.29 46.56 42.32
19 Multiple myeloma (C88-90) 34.76 35.24 34.30
20 Bone and connective tissue cancer (C40-41, 49) 28.55 29.47 27.75
21 Mouth cancer (C00-08) 25.12 26.04 24.31
22 Laryngeal cancer (C32) 19.93 20.46 19.45
23 Cancer of other parts of the pharynx and oropharynx (C9-10,12-13) 19.51 19.97 19.12
24 Uterine cancer (C54) 19.45 20.79 18.30
25 Non-melanoma skin cancer (C44) 18.02 20.96 16.04
26 Malignant melanoma of skin (C43) 12.28 12.61 11.99
27 Other urinary organ cancer (C65-66) 11.18 11.64 10.78
28 Nasopharyngeal cancer (C11) 8.88 9.10 8.69
29 Hodgkin’s disease (C81) 4.11 4.28 3.96
30 Testicular cancer (C62) 1.81 1.98 1.67
DALY, disability-adjusted life year.
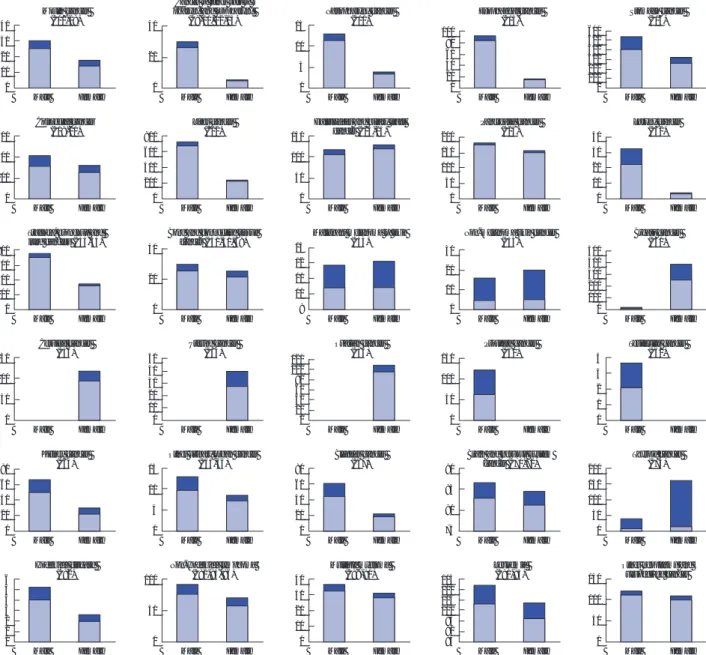
Fig. 1. Disability-adjusted life years according to sex for each cancer type. The blue bars represent years of life lost; the red bars represent years lived with disability.
Male Female 600
400 200 0
Colorectal cancer (C18-21)
Male Female 800
600 400 200 0
Liver cancer (C22)
Male Female 150
100 50 0
Gallbladder and biliary tract cancer (C23-24)
Male Female 200
150 100 50 0
Pancreatic cancer (C25)
Male Female 40
30 20 10 0
Larynx cancer (C32)
Male Female 80
60 40 20 0
Kidney cancer (C64)
Male Female 15
10 5 0
Other urinary organ cancer (C65-66)
Male Female 80
60 40 20 0
Bladder cancer (C67)
Male Female 90
85 80 75
Brain and nervous system cancer (C70-72)
Male Female 200
150 100 50 0
Thyroid cancer (C73) Male Female
40 30 20 10 0
Mouth cancer (C00-08)
Male Female 40
20
0
Cancer of other part of pharynx and oropharynx
(C9-10, 12-13)
Male Female 15
10 5 0
Nasopharynx cancer (C11)
Male Female 100
80 60 40 20 0
Esophageal cancer (C15)
Male Female 600
500400 300 200100 0
Stomach cancer (C16)
Male Female 800
600 400 200 0
Trachea, bronchus and lung cancers (C33-34)
Male Female 40
20
0
Bone and connective tissue cancer (C40-41, 49)
Male Female 13
12 11 10 9
Malignant melanoma of skin (C43)
Male Female 30
20 10 0
Non-melanoma skin cancer (C44)
Male Female 500
400 300 200 100 0
Breast cancer (C50)
Male Female 150
100 50 0
Cervical cancer (C53)
Male Female 50
40 30 20 10 0
Uterine cancer (C54)
Male Female 120
100 80 60 40 20 0
Ovarian cancer (C56)
Male Female 150
100 50 0
Prostate cancer (C61)
Male Female 4
3 2 1 0
Testicular cancer (C62)
Male Female 6
5 4 3 2 1 0
Hodgkin’s disease (C81)
Male Female 100
50
0
Non-Hodgkin’s lymphoma (C82-85, 96)
Male Female 40
30 20 10 0
Multiple myeloma (C88-90)
Male Female 115
110 105 100 95 90 85
Leukemia (C91-95)
Male Female 150
100 50 0
Other neoplasms and unspecified cancer
DISCUSSION
One of the problems with studies based on NHIS data is the lack of validity of coding, which means discrepancies between the real disease of a patient and the code claimed for the dis- ease. Furthermore, the completeness of the data is also impor- tant to measure the burden of disease, because the NHIS data only the reveal actual use of the healthcare facilities. To over- come these problems, we used data from the National Cancer Registry, which was evaluated for quality of the registered data by cancer incidence in five continents and published by the In- ternational Agency for Research on Cancer (19). One of the Re- gional Cancer Registries composing the National Cancer Regis- try reported its completeness and validity as adequate from 2001
to 2010 (20).
The burden of all cancers was the highest burden of all dis- ease types, which was reported by the 2012 Korean National Burden of Disease study (18), which agrees with the findings of the GBD study in 2010 and 2013 and previous Korean Burden of Disease studies (8,21). Health loss in men is higher than in women, whereas the prevalence of all cancers is higher in wom- en than in men. This is because the differences in health loss are larger for liver (483.96 DALYs per 100,000 persons), lung (397.15 DALYs per 100,000 persons), and gastric (207.74 DALYs per 100,000) cancer. The proportion of YLL per DALY in both sexes implies that health loss from premature death from can- cer is similar (0.79 in men vs. 0.80 in women).
Health loss due to thyroid cancer has characteristics that are
Table 4. The DALY rank for the top five cancer types and the DALYs per 100,000 persons according to age group
Age group, yr Rank
1 2 3 4 5
0 Brain and nervous system cancer (C70-72)
Leukemia (C91-95)
Liver cancer (C22)
Bone and connective tissue cancer (C40-41, 49)
Non-Hodgkin’s (C82-85, 96)
145.94 92.28 36.69 1.54 1.26
1-4 Leukemia
(C91-95) Brain and nervous system
cancer (C70-72) Liver cancer
(C22) Kidney cancer
(C64) Non-Hodgkin’s
(C82-85, 96)
110.38 48.40 18.36 10.13 2.71
5-9 Brain and nervous system
cancer (C70-72) Leukemia
(C91-95) Non-Hodgkin’s
(C82-85, 96) Liver cancer
(C22) Kidney cancer
(C64)
102.13 64.84 16.76 7.10 4.49
10-14 Leukemia
(C91-95) Brain and nervous system
cancer (C70-72) Bone and connective tissue
cancer (C40-41, 49) Non-Hodgkin’s
(C82-85, 96) Liver cancer (C22)
95.57 54.42 20.90 11.89 4.77
15-19 Leukemia
(C91-95)
Brain and nervous system cancer (C70-72)
Bone and connective tissue cancer (C40-41, 49)
Non-Hodgkin’s (C82-85, 96)
Hodgkin’s disease (C81)
100.14 68.68 44.93 27.16 8.41
20-24 Leukemia
(C91-95)
Bone and connective tissue cancer (C40-41, 49)
Brain and nervous system cancer (C70-72)
Non-Hodgkin’s (C82-85, 96)
Stomach cancer (C16)
82.34 47.98 42.75 24.40 18.86
25-29 Leukemia
(C91-95) Brain and nervous system
cancer (C70-72) Non-Hodgkin’s
(C82-85, 96) Thyroid cancer
(C73) Stomach cancer
(C16)
87.26 37.51 35.90 34.04 30.06
30-34 Stomach cancer
(C16) Thyroid cancer
(C73) Breast cancer
(C50) Leukemia
(C91-95) Brain and nervous system cancer (C70-72)
121.13 70.59 70.49 64.67 52.15
35-39 Stomach cancer (C16) Breast cancer (C50) Liver cancer (C22) Thyroid cancer (C73) Colorectal cancer (C18-21)
198.72 179.36 150.92 109.96 93.99
40-44 Stomach cancer (C16) Liver cancer (C22) Breast cancer (C50) Colorectal cancer (C18-21) Lung cancer (C33-34)
300.34 280.31 274.97 188.61 166.61
45-49 Liver cancer (C22) Stomach cancer (C16) Breast cancer (C50) Lung cancer (C33-34) Colorectal cancer (C18-21)
698.81 442.73 377.98 310.78 259.56
50-54 Liver cancer (C22) Stomach cancer (C16) Lung cancer (C33-34) Colorectal cancer (C18-21) Breast cancer (C50)
1,040.50 657.67 541.08 492.57 439.93
55-59 Liver cancer (C22) Lung cancer (C33-34) Stomach cancer (C16) Colorectal cancer (C18-21) Breast cancer (C50)
1,320.45 1,061.79 825.01 705.09 441.24
60-64 Lung cancer (C33-34) Liver cancer (C22) Stomach cancer (C16) Colorectal cancer (C18-21) Pancreatic cancer (C25)
1,708.98 1,428.64 1,092.60 1,030.75 518.20
65-69 Lung cancer (C33-34) Liver cancer (C22) Stomach cancer (C16) Colorectal cancer (C18-21) Pancreatic cancer (C25)
2,454.70 1,641.55 1,348.26 1,329.48 708.76
70-74 Lung cancer (C33-34) Liver cancer (C22) Stomach cancer (C16) Colorectal cancer (C18-21) Pancreatic cancer (C25)
3,284.21 1,758.39 1,735.63 1,656.03 841.05
75-79 Lung cancer (C33-34) Stomach cancer (C16) Colorectal cancer (C18-21) Liver cancer (C22) Pancreatic cancer (C25)
3,658.26 2,041.44 2,006.02 1,512.63 850.14
≥ 80 Lung cancer (C33-34) Colorectal cancer (C18-21) Stomach cancer (C16) Liver cancer (C22) Gallbladder cancer (C23-24)
2,900.29 1,987.78 1,885.79 1,112.04 802.12
The category of other neoplasms and unspecified cancer is excluded from this table.
DALY, disability-adjusted life year.
distinguishable from that due to other cancers. Its prevalence was 24.39% in all cancer patients and 37.32% in female patients.
Although there was a prominent prevalence of this cancer, health loss from thyroid cancer was relatively small (a 3% burden for all patients and a 5.6% burden for female patients) because its relative survival rate is not different from that of the cancer-free population and because most patients are diagnosed at an ear- ly stage. This may also be because of excessive screening and over-diagnosis (22). According to age, health loss for all cancers was lowest in patients 5-9 years of age, with an increased rate in those aged 30 years and above, which then decreased by 70 years
of age because of the decrease in the number of people over age 70 and because case prevalence with age also declined for those over age 70.
The correlation coefficients between the ranks of the burden of cancer in this study and those of the GBD 2010 and 2013 stud- ies were 0.982 and 0.984, respectively, not including ‘bone and connective tissue cancer’ (C40-41, 49) and ‘other urinary tract cancers’ (C55-56), which were newly added to this study, and
‘other neoplasms’. The health losses from liver cancer and Hodg- kin’s lymphoma were higher, whereas those from breast and thyroid cancer were lower. Disability weights of this study were
Fig. 2. Trends of disability-adjusted life years by age and sex. The blue lines represent male patients; the red lines represent female patients.
0 1-4 5-9
10-14 15-19 20-24 25-29 30-34 35-39 40-44 45-49 50-54 55-59 60-64 65-69 70-74 75-79 80+
140 120100 80 6040 200
Mouth cancer (C00-08)
0 1-4 5-9
10-14 15-19 20-24 25-29 30-34 35-39 40-44 45-49 50-54 55-59 60-64 65-69 70-74 75-79 80+
160140 120100 8060 4020 0
Cancer of other part of pharynx and oropharynx (C9-10, 12-13)
0 1-4 5-9
10-14 15-19 20-24 25-29 30-34 35-39 40-44 45-49 50-54 55-59 60-64 65-69 70-74 75-79 80+
700 600500 400300 200100 0
Esophageal cancer (C15)
01-4 5-9
10-14 15-19 20-24 25-29 30-34 35-39 40-44 45-49 50-54 55-59 60-64 65-69 70-74 75-79 80+
3,000 2,500 2,000 1,500 1,000 500 0
Colorectal cancer (C18-21)
0 1-4 5-9
10-14 15-19 20-24 25-29 30-34 35-39 40-44 45-49 50-54 55-59 60-64 65-69 70-74 75-79 80+
3,000 2,500 2,000 1,500 1,000 500 0
Stomach cancer (C16)
0 1-4 5-9
10-14 15-19 20-24 25-29 30-34 35-39 40-44 45-49 50-54 55-59 60-64 65-69 70-74 75-79 80+
4035 3025 2015 105 0
Nasopharynx cancer (C11)
01-4 5-9
10-14 15-19 20-24 25-29 30-34 35-39 40-44 45-49 50-54 55-59 60-64 65-69 70-74 75-79 80+
3,000 2,500 2,000 1,500 1,000 500 0
Liver cancer (C22)
0 1-4 5-9
10-14 15-19 20-24 25-29 30-34 35-39 40-44 45-49 50-54 55-59 60-64 65-69 70-74 75-79 80+
1,000 800 600 400 200 0
Gallbladder and biliary tract cancer (C23-24)
0 1-4 5-9
10-14 15-19 20-24 25-29 30-34 35-39 40-44 45-49 50-54 55-59 60-64 65-69 70-74 75-79 80+
1,000 900800 700600 500400 300200 1000
Pancreatic cancer (C25)
0 1-4 5-9
10-14 15-19 20-24 25-29 30-34 35-39 40-44 45-49 50-54 55-59 60-64 65-69 70-74 75-79 80+
300 250 200 150 100 50 0
Larynx cancer (C32)
0 1-4 5-9
10-14 15-19 20-24 25-29 30-34 35-39 40-44 45-49 50-54 55-59 60-64 65-69 70-74 75-79 80+
7,000 6,000 5,000 4,000 3,000 2,000 1,000 0
Trachea, bronchus and lung cancers (C33-34)
0 1-4 5-9
10-14 15-19 20-24 25-29 30-34 35-39 40-44 45-49 50-54 55-59 60-64 65-69 70-74 75-79 80+
8070 60 5040 3020
Bone and connective tissue cancer (C40-41, 49)
0 1-4 5-9
10-14 15-19 20-24 25-29 30-34 35-39 40-44 45-49 50-54 55-59 60-64 65-69 70-74 75-79 80+
60 50
lence was defined to include all 5-year survivors, although it should be classified individually by cancer type since each can- cer has a specific set of characteristics, progress, cure rate, and natural history. The second problem was the uncertainty that the estimated value necessarily developed. The National Can- cer Registry data were used for YLD as a common resource. This has the advantage that the accuracy of the incidence data is guar- anteed, but several uncertainties likely occurred in the process of estimation that was not reflected in the results. This is a chal- lenge that must be resolved in the future.
For an in-depth analysis of the results, a precise estimation of health loss and serial measurements with homogeneous meth- odology are needed. The National Cancer Registry data do not provide the health state or stage after the registration of the di- agnosis. If the cancer registry provided follow-up data, more precise estimations on the distributions of the sequelae could be possible. In addition, both the estimation of the severity dis- tributions and the modeling strategy, including calculation of uncertainty, should be improved. Furthermore, an accurate measurement of the burden of other diseases without qualified data resources such as the National Cancer Registry is difficult.
To resolve this problem, epidemiological data for diseases in our country would be needed. In conclusion, standardized meth- odology consistent with the characteristics of the healthcare environment of our country should be implemented, and the burden of disease should be measured regularly. The measure- ment of disease magnitude and prediction based on serial stud- ies would provide significant information for decision making about healthcare policies.
DISCLOSURE
The authors have no potential conflicts of interest to disclose.
AUTHOR CONTRIBUTION
Study design and modeling: Gong YH, Jo MW, Yoon SJ. Data collection and analysis: Gong YH, Kim A, Kim YA, Yoon J, Seo H. Writing of the draft: Gong YH, Kim D. Approval of final man- uscript: all authors.
ORCID
Young-hoon Gong http://orcid.org/0000-0002-2146-9399 Seok-Jun Yoon http://orcid.org/0000-0003-3297-0071 Min-Woo Jo http://orcid.org/0000-0002-4574-1318 Arim Kim http://orcid.org/0000-0003-4032-2664 Young Ae Kim http://orcid.org/0000-0002-3819-0028 Jihyun Yoon http://orcid.org/0000-0001-7758-4794 Hyeyoung Seo http://orcid.org/0000-0001-8668-8384 Dongwoo Kim http://orcid.org/0000-0001-7731-4081
REFERENCES
1. Ferlay J, Soerjomataram I, Dikshit R, Eser S, Mathers C, Rebelo M, Parkin DM, Forman D, Bray F. Cancer incidence and mortality worldwide: sourc- es, methods and major patterns in GLOBOCAN 2012. Int J Cancer 2015;
136: E359-86.
2. National Cancer Center (KR). Annual Report of Cancer Statistics in Korea in 2012. Ilsan: National Cancer Center, 2014.
3. Kim SG, Hahm MI, Choi KS, Seung NY, Shin HR, Park EC. The economic burden of cancer in Korea in 2002. Eur J Cancer Care (Engl) 2008; 17: 136- 44.
4. Kim J, Hahm MI, Park EC, Park JH, Park JH, Kim SE, Kim SG. Economic burden of cancer in South Korea for the year 2005. J Prev Med Public Health 2009; 42: 190-8.
5. Kim YA, Oh IH, Yoon SJ, Kim HJ, Seo HY, Kim EJ, Lee YH, Jung JH. The economic burden of breast cancer in Korea from 2007-2010. Cancer Res Treat 2015; 47: 583-90.
6. Murray CJ, Lopez AD. The Global Burden of Disease: a Comprehensive Assessment of Mortality and Disability from Diseases, Injuries and Risk Factors in 1990 and Projected to 2020 (Global Burden of disease and In- jury Series Vol. 1). Cambridge, MA: Harvard University Press, 1996.
7. Yoon SJ, Bae SC, Lee SI, Chang H, Jo HS, Sung JH, Park JH, Lee JY, Shin Y.
Measuring the burden of disease in Korea. J Korean Med Sci 2007; 22:
518-23.
8. Oh IH, Yoon SJ, Kim EJ. The burden of disease in Korea. J Korean Med As- soc 2011; 54: 646-52.
9. Yoon SJ, Kim YI, Kim CY, Chang H. Measuring the burden of major can- cers due to premature death in Korea. Korean J Prev Med 2000; 33: 231-8.
10. Park JH, Yoon SJ, Lee HY, Cho HS, Lee JY, Eun SJ, Park JH, Kim Y, Kim YI, Shin YS. Estimating the burden of psychiatric disorder in Korea. J Prev Med Public Health 2006; 39: 39-45.
11. Murray CJ, Vos T, Lozano R, Naghavi M, Flaxman AD, Michaud C, Ezzati M, Shibuya K, Salomon JA, Abdalla S, et al. Disability-adjusted life years (DALYs) for 291 diseases and injuries in 21 regions, 1990-2010: a system- atic analysis for the global burden of disease study 2010. Lancet 2012; 380:
2197-223.
12. Vos T, Flaxman AD, Naghavi M, Lozano R, Michaud C, Ezzati M, Shibuya K, Salomon JA, Abdalla S, Aboyans V, et al. Years lived with disability (YLDs) for 1160 sequelae of 289 diseases and injuries 1990-2010: a systematic analysis for the global burden of disease study 2010. Lancet 2012; 380:
2163-96.
13. Murray CJ, Ezzati M, Flaxman AD, Lim S, Lozano R, Michaud C, Naghavi M, Salomon JA, Shibuya K, Vos T, et al. Supplementary Appendix to: Com- prehensive Systematic Analysis of Global Epidemiology: Definitions, Meth- ods, Simplification of DALYs, and Comparative Results from the Global Burden of Disease Study 2010. New York, NY: Lancet, 2012.
14. Salomon JA, Vos T, Hogan DR, Gagnon M, Naghavi M, Mokdad A, Begum N, Shah R, Karyana M, Kosen S, et al. Common values in assessing health outcomes from disease and injury: disability weights measurement study for the global burden of disease study 2010. Lancet 2012; 380: 2129-43.
15. Lee KS, Lee SI. A study on the reliability of in-hospital patient death infor- mation in health insurance claims: acute myocardial infarction and coro- nary artery bypass graft patients. Korean J Health Policy Adm 2006; 16:
37-51.
16. Murray CJ, Ezzati M, Flaxman AD, Lim S, Lozano R, Michaud C, Naghavi
M, Salomon JA, Shibuya K, Vos T, et al. GBD 2010: design, definitions, and metrics. Lancet 2012; 380: 2063-6.
17. Lee YR, Kim YA, Park SY, Oh CM, Kim YE, Oh IH. Application of a Modi- fied Garbage Code Algorithm to Estimate Cause-Specific Mortality and Years of Life Lost in Korea. J Korean Med Sci 2016;31 Suppl 2:S121-8.
18. Yoon SJ, Jo M, Park HS, Oh IH. A Study on Measuring and Forecasting the Burden of Disease in Korea. Seoul: Cardiovascular and Metabolic Dis- eases Etiology Research Center, 2015.
19. Forman D, Bray F, Brewster DH, Gombe Mbalawa C, Kohler B, Piñeros M, Steliarova-Foucher E, Swaminathan R, Ferlay J. Cancer Incidence in Five
Continents Vol. X. Lyon: International Agency for Research on Cancer, 2014.
20. Lee BK. An analysis of ten year trends of cancer incidence and quality control of cancer registration data in Jeollabuk-do, Korea: 2001~2010. J Agric Med Community Health 2014; 39: 46-58.
21. Institute for Health Metrics and Evaluation (US). GBD compare [Inter- net]. Available at http://www.healthdata.org/data-visualization/gbd-com- pare [accessed on 15th November 2015].
22. Ahn HS, Kim HJ, Welch HG. Korea’s thyroid-cancer “epidemic”--screen- ing and overdiagnosis. N Engl J Med 2014; 371: 1765-7.