Periarticular Osteoporosis Is a Prominent Feature in Early Rheumatoid Arthritis: Estimation Using Shaft to Periarticular Bone Mineral Density Ratio
We aimed to quantify periarticular osteoporosis and investigate its significance in 45 patients with rheumatoid arthritis (RA) and 106 controls. Dual-energy X-ray absorptiometry (DXA) was used to determine the ratio of shaft to periarticular bone mineral density (BMD) as an index of periarticular demineralization. Periarticular osteoporosis was measured by conventional radiography. The BMDs of shaft and periarticular regions in eight designated areas on proximal phalanges were quantified.
Clinical variables were examined to identify risk factors for periarticular osteoporosis. The assessment of periarticular osteoporosis on X-ray images reached a moderate degree of interobserver agreement among four physicians (κ = 0.47). For BMD quantification, we designed three types of mathematical formulae: the ratio of shaft to periarticular BMD, the mean of the ratios, and the ratio of the sums. These ratios were significantly higher in the patients with early RA (disease duration ≤ 3 yr) than in controls (P < 0.01). The findings were not as distinctive in patients with established RA. Body mass index, cumulative dose of corticosteroid, and C-terminal telopeptide were correlated with BMD ratios. Conclusively, DXA-assisted localized quantification and BMD ratio calculations are feasible for assessing periarticular demineralization. Periarticular osteoporosis is a relatively distinctive feature of early RA.
Key Words: Bone Density; Arthrits, Rheumatoid; Periarticular Osteopenia Su-Jin Moon,1,* Inhye E. Ahn,2,*
Seung-Ki Kwok,1 Kyung-Su Park,1 Jun-Ki Min,1 Sung-Hwan Park,1 Ho-Youn Kim,1 and Ji Hyeon Ju1
1Division of Rheumatology, Department of Internal Medicine, College of Medicine, The Catholic University of Korea, Seoul, Korea; 2Department of Internal Medicine, The Methodist Hospital, Houston, TX, USA
*Su-Jin Moon and Inhye E. Ahn contributed equally to this work.
Received: 21 March 2012 Accepted: 17 December 2012 Address for Correspondence:
Ji Hyeon Ju, MD
Division of Rheumatology, Department of Internal Medicine, College of Medicine, The Catholic University of Korea, Seoul St. Mary’s Hospital, 222 Banpo-daero, Seocho-gu, Seoul 137-701, Korea
Tel: +82.2-2258-1468, Fax: +82.2-599-3589 E-mail: [email protected]
This work was supported by National Research Foundation of Korea Grant funded by the Korean Government (2009-0074198) and a grant of the National Project for Personalized Genomic Medicine, Ministry for Health & Welfare, Republic of Korea (A111218-PG01).
http://dx.doi.org/10.3346/jkms.2013.28.2.287 • J Korean Med Sci 2013; 28: 287-294 Musculoskeletal Disorders
INTRODUCTION
Rheumatoid arthritis (RA) is a paradigm of chronic and inflam- matory polyarthritis, particularly of the small joints of the hands and feet. RA causes joint swelling, pain, and bone and cartilage destruction leading to functional disability and reduced quality of life. In RA, osteoporosis occurs in two forms: periarticular os- teoporosis around inflamed joints and generalized osteoporo- sis. Generalized bone loss may result from immobility, the in- flammatory process per se, and treatments such as steroids. On the other hand, periarticular demineralization occurs because of local release of inflammatory molecules and is the earliest feature of RA, preceding bone erosion. It has been demonstrat- ed that periarticular bone loss occurs before generalized osteo- porosis.
Along with bony erosions and uniform joint space narrowing, periarticular osteoporosis is one of the imaging hallmarks of RA.
Bone mineralization is usually normal in all arthropathies ex- cept RA. Nevertheless, radiographic changes were excluded in the new 2010 American College of Rheumatology (ACR)/Euro- pean League Against Rheumatism classification criteria for RA.
This is because periarticular demineralization is subjectively evaluated by a decrease in radiographic density in the osseous structure surrounding the joints and it is difficult to detect the apparent structural changes in the early stage of disease by con- ventional radiography. Although the new classification criteria is anticipated to identify RA at an early stage by the aid of anti- citrullinated protein antibody (ACPA) and rheumatoid factor (RF), physicians often are placed in an obstinate situation that a patient without RF, ACPA and evident radiographic changes is suspected to have RA. Because the marked radiographic changes including erosions and joint space narrowing appear over with time, early diagnosis is not easy in case of seronegative RA un- der the new 2010 classification criteria for RA. In seronegative
RA, the quantification of periarticular osteopenia, which is a feature of early RA, could assist the identification of early RA.
Imaging findings provide an assessment of structural dam- age and help monitor the response to therapeutic intervention.
Damage seen radiographically has been shown to be an impor- tant predictor of clinical outcome and progression (1). Howev- er, the radiographic definition of periarticular osteoporosis is obscure and the condition requires an optimal method for de- tection. Conventional radiography should be obtained on a sin- gle emulsion film, and digital radiographs must be obtained with appropriate parameters. Technical factors, such as film development, exposure, and soft tissue thickness, affect radio- graphic outcomes.
In the present study, we aimed to quantify localized hand bone mineral density (BMD) and convert this into a diagnosti- cally applicable index. Our study was conducted in three steps.
First, to evaluate subjective inconsistency, one radiologist and three rheumatologists reviewed X-ray images of hands to deter- mine the presence of periarticular osteoporosis, and their in- terobserver agreement was evaluated. Second, we quantified the BMD of periarticular and shaft regions with dual-energy X- ray absorptiometry (DXA), calculated the ratio between the two, and compared ratios between RA and control subjects. Third, clinical information was collected to find conditions predispos- ing to the loss of juxta-articular bone minerals.
MATERIALS AND METHODS Subjects
A total of 163 subjects were enrolled in our DXA-assisted hand BMD measurement study. To minimize the influence of comor- bidities other than RA contributing to bone demineralization, our selection criteria excluded two populations: patients with a lumbar BMD Z-score of -2.0 or below based on DXA, and pa- tients with complications owing to iatrogenic steroid consump- tion. Among the 12 excluded patients, one had Cushing’s dis- ease, another had avascular femoral head necrosis, and the others had a low Z-score. Forty five patients with RA and 106 control subjects, for a total of 151, finally remained for further study. Early RA was defined as patients with RA for 3 yr or less according to the 1987 ACR criteria. On the other hand, estab- lished RA was defined as patients with RA for longer than 3 yr according to these criteria. Control subjects consisted of 32 healthy subjects, 44 patients with osteoarthritis, 21 patients with ankylosing spondylitis, seven patients with Sjögren’s syn- drome, one patient with Behçet’s disease, and one patient with gout. None of the control subjects showed any evidence of in- flammatory arthritis. Clinical variables including disease dura- tion, medication, and body mass index (BMI) were also noted.
The bone turnover markers osteocalcin and C-terminal telopep- tide were measured at the time of hand BMD measurement.
Evaluation of hand X-ray images
Three rheumatologists and one radiologist reviewed hand X-ray images from all the 151 subjects. The radiographic hand images were acquired using an AXIOM Aristos MX apparatus (SIEMENS, Erlangen, Germany). All the radiographs were exposed with an exposure voltage of 46.0 kV, current-time product of 4.11 mAs, exposure time of 11.3 ms, and exposure amount of 10.07 mR.
All radiographs were obtained using the uniform digital tech- nique of our institution. No postprocessing enhancement of bony detail was added. Each physician independently deter- mined and recorded the presence or absence of periarticular osteoporosis. The physicians were blinded to patient identifica- tion, history, diagnosis, and their colleagues’ interpretations.
Interobserver agreement among four physicians was evaluated by Fleiss’ κ value and agreement between two physicians was evaluated by Cohen’s κ. The κ values were interpreted as poor (κ = 0), slight (κ = 0.0-0.2), fair (κ = 0.21-0.40), moderate (κ = 0.41-0.60), substantial (κ = 0.61-0.80), or almost perfect (κ = 0.81- 1.00) (3).
Quantification of hand BMD by localized DXA
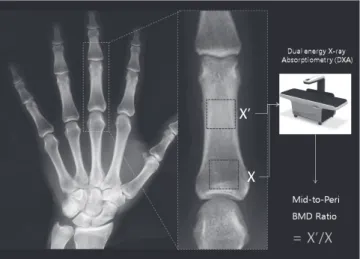
From the second to fifth digits of both hands, eight regions of interest (ROIs) on proximal phalanges were designated. The four ROIs were located on proximal periarticular regions, and the other four ROIs were on the narrowest cortical regions of shaft to serve as individual reference values (Fig. 1). A DXA Expert XL densitometer (Lunar, Madison, WI, USA) was used to scan both hands and all eight BMDs were expressed in g/cm2. Each ROI was manually identified and its size was uniformly confined to a width of 0.5 cm or a pixel size of 0.25. The total dose of radia- tion from scanning was 2.0 µGy. After DXA measurement, we labeled the left and right hands with L and R, respectively, fol- lowed by numbers from 1 to 4 for periarticular (peri) BMDs and 1´ to 4´ for mid-bone (mid) BMDs (Fig. 1). To combine BMDs
Fig. 1. Evaluation of localized articular and periarticular ROIs with DXA. We labeled left and right hands with L and R, respectively, which were followed by numbers (x) from 1 to 4 for periarticular BMDs and 1´ to 4´ for middle-of-the-bone BMDs.
of the peri and mid regions, we designed simple formulae as follows. Mathematical equations are expressed within brackets for the readers’ convenience. An unknown quantity of x or x´ is used in the equations to represent any of the peri or mid BMDs from finger numbers 1 to 4.
1) Mid-to-peri BMD ratio (= x´/x). The mid BMD was divided by the peri BMD of the same finger. Thus, the larger the mid-to-peri BMD ratio, the more prominent the periartic- ular osteoporosis is on the finger of concern. For example, the equation for the left index finger was L1´/L1.
2) Mean of four mid-to-peri BMD ratios (= [∑1 x´/x]/4). As an extension of the first formula, the mean of four mid-to-peri BMD ratios was calculated. The equation for the left hand was (L1´/L1 + L2´/L2 + L3´/L3 + L4´/L4)/4.
3) Ratio of the sum of the mid BMDs to the sum of peri BMDs (= ∑1 x´/∑1 x). All four mid BMDs of one hand were divid- ed by four peri BMDs of the same hand. The equation for the left hand was (L1´ + L2´ + L3´ + L4´)/(L1 + L2 + L3 + L4).
These mathematical variations were intended to simplify the interpretation and to clarify the extent of periarticular osteopo- rosis based on multiple dimensions ranging from the fingers, one hand, and both hands. For further analysis, the RA group was divided into two based on the disease duration (early RA versus established RA).
Statistical analyses
Statistical analyses were performed using the SPSS statistical software package (standard version 16.0; SPSS, Chicago, IL, USA).
When comparing the groups, a Student t test or one-way analysis of variance was used for continuous variables and a chi-squared test was employed for categorical variables. Correlations be- tween variables were evaluated using Pearson’s correlation test.
Cut-off values were determined by receiver operation charac- teristic (ROC) curves. All results are expressed as mean and stan- dard deviation unless otherwise specified. P < 0.05 (two-tailed) was considered significant.
Ethic statements
This study was approved by the institutional review board of Seoul St. Mary’s Hospital in accordance with the Helsinki II Dec- laration (KC09OISI0258). All patients were informed and gave their written consent.
RESULTS
Baseline characteristics
Baseline demographic and clinical characteristics in the study are shown in Table 1. All enrollees were Korean. Four patients in the RA group also had osteoarthritis (8.9%). A single case of comorbid systemic lupus erythematosus was also noted in the RA group. No other type of degenerative or erosive arthrosis on
hands was documented in the RA group. There were no statisti- cally significant differences in terms of gender, age, body mass index (BMI), or lumbar T-score. However, the T-score of the fem- oral neck was lower in patients with RA than in controls. The majority (95.6%) of patients with RA had been treated with cor- ticosteroids, whereas none of the control subjects had been.
Larger proportions of RA patients had been given calcium or vitamin D supplements (60.0% vs 40.6%).
Interobserver agreement for the radiographic detection of periarticular osteoporosis
Three rheumatologists and one radiologist individually deter- mined the presence of periarticular osteoporosis based on con- ventional hand X-ray images. The κ value was 0.472, which sig- nified a moderate degree of interobserver agreement among the four physicians (P < 0.001). More disagreement was found among the three rheumatologists, with their κ falling to 0.408 (P < 0.001). When a comparison was made with two physicians at a time-each rheumatologist’s decision was compared with the radiologist’s-Cohen’s κ values varied from 0.464 to 0.646.
We concluded that a physician’s interpretation of periarticular osteopenia was prone to inconsistency, and this finding called for a more reliable method to identify the periarticular bone loss.
Quantification of hand BMD by DXA in the RA and control groups
The raw quantified hand BMD values were uniformly lower in RA patients regardless of its location, but this lacked statistical significance. To measure the BMD gap between the periarticu- Table 1. Clinical and demographic features of patients and controls
Parameters RA
(n = 45) Control
(n = 106) P
Gender, % women 88.9 76.4 0.079
Age (yr) 47.5 (16.4) 51.0 (14.9) 0.537
BMI, mean (SD) 22.06 (3.93) 24.26 (3.36) 0.435
Lumbar spine T-score,
mean (SD) -1.22 (1.23) -0.73 (1.41) 0.315
Femoral neck T-score,
mean (SD) -2.00 (1.19) -1.52 (1.18) 0.029
Medication Corticosteroids
Duration of corticosteroids treatment, median (SD) years Bisphosphonate
Calcium and/or vitamin D supplements
43/45 (95.6) 3.0 (5.30) 13/45 (28.9) 27/45 (60.0)
- - 23/106 (21.7) 43/106 (40.6) 0.343
0.028 Comorbidities
Healthy subject Osteoarthritis Ankylosing spondylitis Sjögren’s syndrome Others
- 4 - - 1
32 44 21 7 2
Other comorbidities include one systemic lupus erythematosus (in RA), one Behçet’s disease and one gout (in control). The data are shown as mean or median (SD) or number (%). RA, rheumatoid arthritis; BMI, body mass index; SD, standard deviation.
lar (peri) and nonperiarticular area, the peri BMD of one finger was subtracted from the mid BMD of the same finger, and the remainder was compared between two groups (= x - x´). Unex- pectedly, this BMD gap was not higher in the RA group. We con- cluded that a direct comparison of BMD and the simple BMD gap measurement were insufficient for distinguishing between the RA and control groups.
To avoid simple comparison of raw values and to set a value that reflects each person’s background bone quality, we adopt- ed the idea of an individually tailored BMD index and devised the aforementioned equations based on BMD ratios. Table 2 shows that the mean values of mid-to-peri BMD ratios tend to be higher in patients with RA (see the details under 1) in the Methods), although the difference was not statistically signifi- cant. As an extension from the previous ratio, the mean of mid- to-peri BMD ratios was calculated (see 2) in the Methods). Al- though the values tended to be higher in RA patients, the differ- ences from controls also failed to reach statistical significance.
To assess osteopenic changes from the perspective of a hand, all four mid BMDs of one hand were divided by the four peri BMDs of the same hand (see 3) in the Methods). Those values showed a similar result.
Distribution of the calculated values according to the intuitive interpretation of periarticular osteoporosis Sixty-six of the 151 subjects displayed periarticular osteoporosis
in their finger bones. Twenty-three (51.1%) of overall RA patients were interpreted to show periarticular osteoporosis in their hand X-ray. Periarticular osteoporosis was also diagnosed in 43 (40.6%) control subjects. Fig. 2 shows the each calculated values accord- ing to the interpretation of periarticular osteoporosis assessed by one expert radiologist. The mean value of L1´/L1, L2´/L2, L3´/
L3 and L4´/L4 in the group of periarticular osteoporosis was 2.13, 2.11, 2.23, and 2.10, respectively. On the other hand, the mean value of L1´/L1, L2´/L2, L3´/L3, and L4´/L4 in the group of absence of periarticular osteoporosis was 1.68, 1.77, 1.96, and 1.84, respectively. The mean values between the two groups were significantly different in the all fingers (P < 0.001).
Periarticular osteoporosis as a distinct feature of early RA Overall control subjects were divided into healthy control (n = 32) and disease control (n = 74). Table 2 demonstrats that the calculated values were not different between the healthy con- trol group and the disease control group. For further analysis, the RA patients were divided into two subgroups according to the duration of their disease: 17 patients had early RA and 28 had established RA (as defined in the Methods). A post hoc anal- ysis disclosed a more refined and significant difference from controls (Table 2). Patients with early RA revealed much higher values than the control group for the mid-to-peri BMD ratios of both index fingers. The mean mid-to-peri BMD ratio and the ratio of the sum of mid BMDs to the sum of the peri BMDs were Table 2. Periarticular osteoporosis in the patients with RA versus control subjects
Measured bone sites
Bone mineral density Overall
control (n = 106)
Healthy control (n = 32)
Disease control (n = 74)
Total RA
(n = 45) P RA ≤ 3 yr
(n = 17) P RA > 3 yr
(n = 28) P
Digit of left hand Index : L1´/L1 Middle : L2´/L2 Ring : L3´/L3 Small : L4´/L4
1.84 (0.26) 1.89 (0.34) 2.04 (0.37) 1.91 (0.38)
1.89 (0.29) 1.91 (0.43) 2.00 (0.3) 1.88 (0.40)
1.82 (0.25) 1.88 (0.29) 2.05 (0.40) 1.92 (0.37)
1.98 (0.47) 1.87 (0.38) 2.17 (0.58) 2.06 (0.58)
0.054 0.199 0.093 0.053
2.10 (0.41)*
2.04 (0.35) 2.24 (0.48) 2.08 (0.39)
0.001 0.276 0.198 0.306
1.91 (0.50) 1.94 (0.40) 2.13 (0.64) 2.05 (0.67)
0.525 0.829 0.587 0.285 Digit of right hand
Index : R1´/R1 Middle : R2´/R2 Ring : R3´/R3 Small : R4´/R4
1.85 (0.32) 1.85 (0.32) 2.01 (0.32) 1.94 (0.36)
1.88 (0.35) 1.87 (0.32) 1.99 (0.34) 1.88 (0.33)
1.83 (0.30) 1.83 (0.32) 2.02 (0.31) 1.97 (0.37)
1.94 (0.50) 1.96 (0.44) 2.08 (0.40) 2.04 (0.52)
0.266 0.115 0.262 0.158
2.11 (0.45)*
2.01 (0.37) 2.17 (0.26) 1.96 (0.35)
0.003 0.196 0.194 0.972
1.83 (0.50) 1.93 (0.48) 2.03 (0.46) 2.09 (0.61)
0.970 0.484 0.974 0.195 Formulae
Left: mean of mid-to- peri BMD ratio Right: mean of mid-to- peri BMD ratio Both: mean of mid-to- peri BMD ratio Left: sum of mid BMD/
sum of peri BMD Right: sum of mid BMD/
sum of peri BMD Both: sum of mid BMD/
sum of peri BMD
1.92 (0.25) 1.91 (0.26) 1.92 (0.24) 1.90 (0.25) 1.89 (0.26) 1.89 (0.24)
1.92 (0.27) 1.91 (0.26) 1.91 (0.25) 1.90 (0.27) 1.89 (0.26) 1.89 (0.25)
1.92 (0.25) 1.91 (0.27) 1.92 (0.24) 1.90 (0.24) 1.89 (0.26) 1.89 (0.24)
2.05 (0.40) 2.01 (0.35) 2.03 (0.35) 2.01 (0.38) 1.97 (0.35) 1.98 (0.34)
0.053 0.068 0.053 0.083 0.122 0.121
2.11 (0.35)*
2.06 (0.28) 2.09 (0.28)*
2.09 (0.34)*
2.05 (0.28) 2.06 (0.28)*
0.007 0.110 0.009 0.005 0.092 0.009
2.01 (0.44) 1.97 (0.38) 1.99 (0.38) 1.95 (0.39) 1.92 (0.38) 1.93 (0.37)
0.357 0.599 0.417 0.660 0.856 0.805
Student t test to compare means of control subjects versus one of the three groups; all RA patients, RA for 3 yr or less, RA over 3 yr. An asterisk (*) indicates a statistically sig- nificant difference with P value under 0.05 when compared to the control group. Other unlabeled values were not significant. Values are given as mean (standard deviation).
BMD, bone mineral density.
also higher for the left and for both hands of early RA patients.
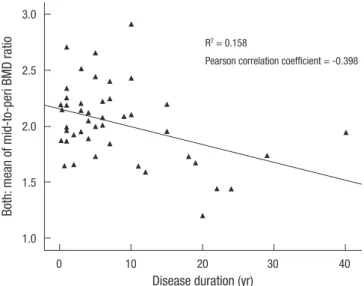
On the other hand, these values did not differ between the pa- tients with established RA and control subjects. As Fig. 3 shows,
the mean mid-to-peri BMD ratio for both hands was negatively correlated with RA disease duration (R2= 0.158, Pearson corre- lation coefficient = -0.398). In summary, the relative radiolu- cency of the periarticular bone region was most marked in pa- tients with early RA, and such distinction was reduced as the disease was prolonged.
Cut-off values for the quantified hand BMD ratios in RA patients
ROC curves were used to determine cut-off values of selected formulae, which were three means of the mid-to-peri BMD ra- tio, and three ratio of the sum of mid BMDs to the sum of the peri BMDs. The cut-offs of all six formulae were located between 2.06 and 2.08 in diagnosing early RA with sensitivities ranging from 47.1% to 52.9% and specificities from 68.7% to 73.9%. The formula with the highest specificity was the sum of both hands’
mid BMD divided by the sum of both hands’ peri BMD (sensi- tivity 52.9%, specificity 73.9%, positive predictive value 20.5%, and accuracy 71.5%).
Fig. 2. Calculated values according to the existence of periarticular osteoporosis. The values representing periarticular osteoporosis (n = 66 [presence of periarticular osteopo- rosis] and n = 85 [absence of periarticular osteoporosis]) are expressed as dot plots with mean (bar).
L1´/L1
P < 0.001
Presence of Absence of
periarticular osteoporosis periarticular osteoporosis 4
3
2
1
0
L3´/L3
P < 0.001
Presence of Absence of
periarticular osteoporosis periarticular osteoporosis 5
4
3
2
1
0
L2´/L2
P < 0.001
Presence of Absence of
periarticular osteoporosis periarticular osteoporosis 4
3
2
1
0
L4´/L4
P < 0.001
Presence of Absence of
periarticular osteoporosis periarticular osteoporosis 5
4
3
2
1
0
Fig. 3. Correlation between the duration of RA and the mean of both mid-to-peri BMD ratios. R2 = 0.158, Pearson correlation coefficient = -0.398.
Both: mean of mid-to-peri BMD ratio
Disease duration (yr)
0 10 20 30 40
3.0
2.5
2.0
1.5
1.0
R2 = 0.158
Pearson correlation coefficient = -0.398
Risk factors for periarticular osteoporosis
Clinical variables from the 45 patients with RA were collected to determine clinical conditions related to the loss of juxta-articu- lar bone minerals. As Table 3 shows, BMI and RA duration were inversely correlated with the BMD formulae. In terms of steroid use, cumulative dose and treatment duration were negatively correlated with the formulae. C-terminal telopeptide, a serum biomarker used to measure the rate of bone turnover, showed a strong positive correlation with all six ratios. In our study, gen- der and administered medications were revealed to be unasso- ciated with the six BMD formulae described above.
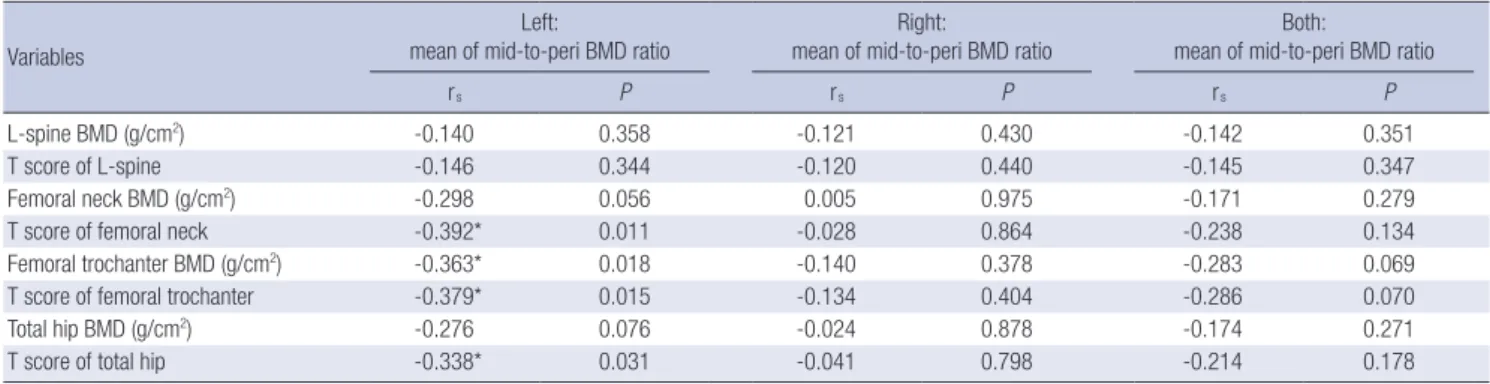
Correlation between periarticular bone mineral and generalized osteoporosis
As shown in Table 4, significant correlation was found between the left mid-to-peri BMD ratio and femoral bone density (BMD and T-score). Neither L-spine BMD nor T-score showed a sig- nificant correlation with periarticular osteoporosis. In contrast with the left hand, mid-to-peri BMD ratios of the right and both hands were not correlated with femoral and L-spine bone min- eral loss.
DISCUSSSION
We demonstrated that periarticular osteoporosis, as evaluated by DXA, is a prominent feature of early RA. Furthermore, rela- tionships between the shaft-to-peri BMD ratio and steroid use, bone turnover marker, and RA disease duration were identified.
Our study results show that a negative correlation exists between our BMD formulae and generalized bone density (femur).
The structural changes of RA, including bone erosion and decalcification, are conventionally believed to be irreversible.
The development of biological agents, however, has dramati- cally altered the potential course of this disease and extended the therapeutic possibility toward a level of structural repair.
Benefits seen radiographically after anti-tumor necrosis factor treatment have been reported after prospective and individual case studies (4-6). Because it has been recognized that early therapeutic intervention improves clinical outcomes and re- duces the accrual of joint damage and functional impairment, early diagnosis and therapeutic intervention have become im- portant goals for rheumatologists (7, 8). For this reason, prompt detection of bone mineral loss may be critical for superior func- tional outcome (9).
Table 3. Correlation between clinicolaboratory profiles and hand BMD values in RA patients
Variables
Left: mean of mid-to-peri BMD
ratio
Right: mean of mid-to-peri BMD
ratio
Both: mean of mid-to-peri BMD
ratio
Left: Sum of mid BMD/Sum of
peri BMD
Right: Sum of mid BMD/Sum of
peri BMD
Both: Sum of mid BMD/Sum of
peri BMD
rs P rs P rs P rs P rs P rs P
Age 0.100 0.514 -0.069 0.652 0.024 0.877 0.002 0.991 -0.117 0.444 -0.083 0.588
BMI -0.236 0.118 -0.366* 0.013 -0.321* 0.031 -0.199 0.191 -0.340* 0.022 -0.309* 0.039
Duration of RA (yr) -0.347* 0.019 -0.389* 0.008 -0.398* 0.007 -0.397* 0.007 -0.415* 0.005 -0.434* 0.003 Markers of bone turnover
Osteocalcin C-terminal telopeptide
0.264 0.433*
0.138 0.015
0.226 0.410*
0.205 0.022
0.264 0.451*
0.138 0.011
0.343 0.494*
0.051 0.005
0.267 0.459*
0.133 0.009
0.325 0.510*
0.065 0.003 Steroid use
Duration of steroid exposure (yr) Cumulative dose of steroid (g)
-0.208 -0.276
0.170 0.066
-0.320*
-0.463*
0.032 0.001
-0.282 -0.393*
0.060 0.008
-0.253 -0.366*
0.093 0.014
-0.328*
-0.471*
0.028 0.001
-0.316*
-0.456*
0.034 0.002
rs, Pearson correlation coefficient; BMD, bone mineral density; RA, rheumatoid arthritis; BMI, body mass index; MTX, methotrexate; DMARDs, disease-modifying antirheumatic drugs; NSAIDs, non-steroidal anti-inflammatory drugs.
Table 4. Correlation between the periarticular osteopenia of the hand and systemic bone mineral density in RA
Variables
Left:
mean of mid-to-peri BMD ratio Right:
mean of mid-to-peri BMD ratio Both:
mean of mid-to-peri BMD ratio
rs P rs P rs P
L-spine BMD (g/cm2) -0.140 0.358 -0.121 0.430 -0.142 0.351
T score of L-spine -0.146 0.344 -0.120 0.440 -0.145 0.347
Femoral neck BMD (g/cm2) -0.298 0.056 0.005 0.975 -0.171 0.279
T score of femoral neck -0.392* 0.011 -0.028 0.864 -0.238 0.134
Femoral trochanter BMD (g/cm2) -0.363* 0.018 -0.140 0.378 -0.283 0.069
T score of femoral trochanter -0.379* 0.015 -0.134 0.404 -0.286 0.070
Total hip BMD (g/cm2) -0.276 0.076 -0.024 0.878 -0.174 0.271
T score of total hip -0.338* 0.031 -0.041 0.798 -0.214 0.178
rs, Pearson correlation coefficient; BMD, bone mineral density; RA, rheumatoid arthritis.
However, bone mineral wasting is silent, and the clinical def- inition of periarticular osteoporosis is very subtle. Its detection has been empirically notorious with high observational varia- tion (10). Our analysis also revealed that the visual perception of periarticular radiolucency is frequently liable to misinterpre- tation. Because human eyes cannot conserve the “absolute pitch”
of bone density, a more objective method for the assessment of periarticular BMD loss has been a latent question for physicians.
One of the first attempts in answering this question was re- ported by Deodhar et al., who measured whole hand BMD of 56 RA patients with DXA (11). The concept of quantification of periarticular osteoporosis was developed over several trials with variations in ROIs and quantifying instruments (9, 12-14). Con- sidering that RA involves about 1% of the population and hand bone destruction occurs in fewer people, it is plausible to make a case-sensitive method, if not supported by a large-scale age- matched reference population within an ethnic group of con- cern. We conducted this study on the assumption that periartic- ular osteoporosis is relative, comparing it with that of the pha- langeal bone shaft. To our knowledge, this is the first report of a study of patients with RA that directly compares periarticular BMD with that of the shaft in the same finger bone. Our present study is also the first to report the design of three types of BMD formulae to render an individually tailored assessment of peri- articular BMD loss in patients with RA. Quantification of local- ized hand BMD revealed that periarticular osteoporosis was indeed present in proximal phalanges of RA patients. The uni- formly high ratios in RA can be interpreted as an ascertainment of periarticular bone loss and the compensatory accentuation of density of the remaining area. Our study results show that ab- solute periarticular BMD is not correlated with RA disease du- ration. Some studies show that periarticular BMD decreases as the disease progresses (15, 16). On the other hand, other stud- ies show that periarticular BMD does not differ between early and established RA (17). The majority of previous studies that assessed periarticular BMD according to disease duration mea- sured periarticular BMD only. They did not consider the BMD of the bone shaft. The present study conclusively determined that DXA-assisted relative periarticular osteoporosis is an appar- ent character of early RA.
Interestingly, systemic bone loss may dilute the early empha- sis on localized loss of bone minerals. Dilution of the disease hallmark can be theoretically explained by low BMD of gener- alized skeletal structures. As the disease progresses, patients with RA are exposed to inflammatory stimuli and tend to receive high doses of steroids for long periods. Thus, they inevitably undergo systemic bone loss. This expectation is evident in the decreasing BMD ratio as RA elapsed, as shown in Fig. 3. A lon- gitudinal study of 29 RA patients also reported that hand bone loss was most distinctive in the first 3 yr of their disease (18).
Few clinical risk factors are known to be associated with peri-
articular BMD decline in RA patients. BMI, disease duration, and the cumulative dose of steroids demonstrated a significant correlation with periarticular osteoporosis in our present study.
Even though RA duration and steroid treatment are well known to be major risk factors for systemic osteoporosis, their influence on local bone minerals requires further deliberate prospective studies. Bisphosphonate and calcium supplements were not related to favorable hand BMD ratios, thus their use in RA pa- tients should be aimed at systemic benefits rather than local bone protection (19).
In this study, BMD ratios in the left hand of patients with ear- ly RA showed significant differences from those of control sub- jects. However, those in their right hands did not. We postulate that mobility is a possible negative risk factor for periarticular osteoporosis. The majority of Koreans are right handed. Discrep- ancies in motor function because of handedness (20) and hand- exploiting occupations (21) have been previously reported to affect hand bone density. In this context, the BMD discrepancy between right and left hands in our data can be interpreted as a bone protective effect of habitual loading.
Potential limitations of our study are the putative effects of gender and the use of medications. Pharmacologic effects on hand BMD are difficult to evaluate because each individual was exposed to a distinct regimen that varied in type of drug, dos- ing, duration, and clinical response. A randomized controlled study with a detailed stratification in medications would provide stronger evidence while minimizing these limitations. Never- theless, our study attempts to raise awareness of objective methods to detect periarticular bone mineral loss in early RA.
Our findings suggest that bone mineral loss from periarticu- lar regions precedes diffuse osteoporosis and is a distinct fea- ture of early RA. Conclusively, DXA could play a potential role in the detection of periarticular osteoporosis, and thus the ear- liest radiographic changes in RA.
ACKNOWLEDGMENTS
We would like to thank Mr. Hyeon-Wook Kim (Department of Medical Statistics, The Catholic University of Korea, Seoul, Ko- rea) for consultation regarding statistical analyses. The authors declare no conflict of interest.
REFERENCES
1. Gossec L, Dougados M, Goupille P, Cantagrel A, Sibilia J, Meyer O, Sany J, Daurès JP, Combe B. Prognostic factors for remission in early rheuma- toid arthritis: a multiparameter prospective study. Ann Rheum Dis 2004;
63: 675-80.
2. Alenfeld FE, Diessel E, Brezger M, Sieper J, Felsenberg D, Braun J. De- tailed analyses of periarticular osteoporosis in rheumatoid arthritis. Os- teoporos Int 2000; 11: 400-7.
3. Crewson PE. Reader agreement studies. AJR Am J Roentgenol 2005; 184:
1391-7.
4. Ahn IE, Ju JH, Park SH, Kim HY. Radiologic observation: repair of focal bone erosions after humanized antitumor necrosis factor antibody adali- mumab therapy in a patient with rheumatoid arthritis. Clin Rheumatol 2010; 29: 211-3.
5. Hoff M, Kvien TK, Kälvesten J, Elden A, Haugeberg G. Adalimumab ther- apy reduces hand bone loss in early rheumatoid arthritis: explorative analyses from the PREMIER study. Ann Rheum Dis 2009; 68: 1171-6.
6. Smolen JS, Han C, Bala M, Maini RN, Kalden JR, van der Heijde D, Breed- veld FC, Furst DE, Lipsky PE. Evidence of radiographic benefit of treat- ment with infliximab plus methotrexate in rheumatoid arthritis patients who had no clinical improvement: a detailed subanalysis of data from the anti-tumor necrosis factor trial in rheumatoid arthritis with concom- itant therapy study. Arthritis Rheum 2005; 52: 1020-30.
7. Emery P, Breedveld FC, Hall S, Durez P, Chang DJ, Robertson D, Singh A, Pedersen RD, Koenig AS, Freundlich B. Comparison of methotrexate monotherapy with a combination of methotrexate and etanercept in active, early, moderate to severe rheumatoid arthritis (COMET): a ran- domised, double-blind, parallel treatment trial. Lancet 2008; 372: 375-82.
8. St Clair EW, van der Heijde DM, Smolen JS, Maini RN, Bathon JM, Em- ery P, Keystone E, Schiff M, Kalden JR, Wang B, et al. Combination of infliximab and methotrexate therapy for early rheumatoid arthritis: a randomized, controlled trial. Arthritis Rheum 2004; 50: 3432-43.
9. Hoff M, Haugeberg G, Kvien TK. Hand bone loss as an outcome measure in established rheumatoid arthritis: 2-year observational study compar- ing cortical and total bone loss. Arthritis Res Ther 2007; 9: R81.
10. van der Heijde DM. Plain X-rays in rheumatoid arthritis: overview of scoring methods, their reliability and applicability. Baillieres Clin Rheu- matol 1996; 10: 435-53.
11. Deodhar AA, Brabyn J, Jones PW, Davis MJ, Woolf AD. Measurement of hand bone mineral content by dual energy x-ray absorptiometry: devel- opment of the method, and its application in normal volunteers and in patients with rheumatoid arthritis. Ann Rheum Dis 1994; 53: 685-90.
12. Jensen T, Klarlund M, Hansen M, Jensen KE, Podenphant J, Hansen TM, Skjødt H, Hyldstrup L. Bone loss in unclassified polyarthritis and
early rheumatoid arthritis is better detected by digital x ray radiogram- metry than dual x ray absorptiometry: relationship with disease activity and radiographic outcome. Ann Rheum Dis 2004; 63: 15-22.
13. Böttcher J, Pfeil A. Diagnosis of periarticular osteoporosis in rheumatoid arthritis using digital X-ray radiogrammetry. Arthritis Res Ther 2008; 10:
103.
14. Peel NF, Spittlehouse AJ, Bax DE, Eastell R. Bone mineral density of the hand in rheumatoid arthritis. Arthritis Rheum 1994; 37: 983-91.
15. Haugeberg G, Lodder MC, Lems WF, Uhlig T, Ørstavik RE, Dijkmans BA, Kvien TK, Woolf AD. Hand cortical bone mass and its associations with radiographic joint damage and fractures in 50-70 year old female patients with rheumatoid arthritis: cross sectional Oslo-Truro-Amster- dam (OSTRA) collaborative study. Ann Rheum Dis 2004; 63: 1331-4.
16. Haugeberg G, Green MJ, Conaghan PG, Quinn M, Wakefield R, Proud- man SM, Stewart S, Hensor E, Emery P. Hand bone densitometry: a more sensitive standard for the assessment of early bone damage in rheuma- toid arthritis. Ann Rheum Dis 2007; 66: 1513-7.
17. Alves C, Colin EM, van Oort WJ, Sluimer JP, Hazes JM, Luime JJ. Periar- ticular osteoporosis: a useful feature in the diagnosis of early rheumatoid arthritis? Reliability and validity in a cross-sectional diagnostic study us- ing dual-energy X-ray absorptiometry. Rheumatology (Oxford) 2011; 50:
2257-63.
18. Deodhar AA, Brabyn J, Pande I, Scott DL, Woolf AD. Hand bone densi- tometry in rheumatoid arthritis, a five year longitudinal study: an out- come measure and a prognostic marker. Ann Rheum Dis 2003; 62: 767-70.
19. Güler-Yüksel M, Allaart CF, Goekoop-Ruiterman YP, de Vries-Bouwstra JK, van Groenendael JH, Mallée C, de Bois MH, Breedveld FC, Dijkmans BA, Lems WF. Changes in hand and generalised bone mineral density in patients with recent-onset rheumatoid arthritis. Ann Rheum Dis 2009;
68: 330-6.
20. Kaya A, Ozgocmen S, Ardicoglu O, Kamanli A, Gudul H. Relationship between grip strength and hand bone mineral density in healthy adults.
Arch Med Res 2005; 36: 603-6.
21. Vehmas T, Solovieva S, Riihimäki H, Luoma K, Leino-Arjas P. Hand work- load and the metacarpal cortical index. A study of middle-aged teachers and dentists. Osteoporos Int 2005; 16: 672-80.