INTRODUCTION
Down syndrome (DS) has an incidence of one per 700 live births and is caused by complete or partial triplication of hu- man chromosome 21 (1). Nondisjunction during meiosis may be responsible for the various phenotypes of DS, and -70% of nondisjunction errors have been found to occur during meio- sis I and the other 30% during meiosis II (2, 3). DS is char- acterized clinically by abnormal facial and skeletal features (4), mental retardation (5), precocious dementia (6) and congen- ital heart disease (7, 8).
Recently, genomic approach for DS has been performed using various clinical samples. However, the gene expression study using DS fetus has some limitation, especially for amni- otic fluid (AF) cells. AF is commonly used for prenatal diag- nosis in obstetrics and gynecology, which includes various tissue of origin for fetal DS. Our genomic approach for AF cells of DS may provide basic information for understanding of the development of DS fetus.
The differential expression of genes located on the extra copy of chromosome 21 has been assumed to be responsible for the phenotypic abnormalities of DS, but this gene dosage hypoth- esis has not been fully assessed on a genome-wide basis. The
expression patterns of genes related to phenotypic abnormali- ties of DS may provide insights into their potential roles in DS.
For example, DSCR-1 gene on chromosome 21 is developmen- tal regulator gene and is involved in neurogenesis. Moreover, its overexpression may contribute to brain abnormalities (9).
SIM2 gene is a transcriptional regulator that operates as a important determinant of the central nervous system and is a candidate gene for the pathogenesis of mental retardation in DS (10). The overexpression of S100beta in the AF of DS fetuses may be related to the appearance of Alzheimer-type neuropathological changes in DS (11).
We used the DNA microarray technique (12) using AF cells in DS to investigate the pathogenesis of this syndrome, and also identify biological markers of DS in based on a high- throughput method. Although it is not fully clear how AF cell can represent the phenotype of this syndrome, the differ- ential gene expression by extra copy of chromosome 21 would be expected even in AF cells, regardless of the tissue of origin (13). Our microarray analysis determined the expressions level of 102 genes potentially important in DS from cultured AF cells at 16-18 weeks of gestation.
In-Hyuk Chung, Sook-Hwan Lee*, Kyo-Won Lee�, Sang-hee Park*, Kwang-Yul Cha*, Nam-Soon Kim�, Hyang-Sook Yoo�, Yong Sung Kim�, Suman Lee
Functional Genomics Lab, Bundang Campus, College of Medicine, Pochon CHA University*, Sungnam;
Kangbuk Samsung Hospital, Sungkyunkwan University School of Medicine�, Seoul; The Center for Functional Analysis of Human Genome, KRIBB�, Daejeon, Korea
Address for correspondence Suman Lee, Ph.D.
Functional Genomics Lab, Bundang Campus, College of Medicine, Pochon CHA University, 222 Yatap-dong, Bundang-gu, Sungnam 463-836, Korea Tel : +82.31-725-8372, Fax : +82.31-725-8350 E-mail : [email protected]
82
Gene Expression Analysis of Cultured Amniotic Fluid Cell with Down Syndrome by DNA Microarray
Complete or partial triplication of human chromosome 21 results in Down syndrome (DS). To analyze differential gene expressions in amniotic fluid (AF) cells of DS, we used a DNA microarray system to analyze 102 genes, which included 24 genes on chromosome 21, 28 genes related to the function of brain and muscle, 36 genes related to apoptosis, 4 genes related to extracellular matrix, 8 genes related to other molecular function and 2 house-keeping genes. AF cells were collected from 12 preg- nancies at 16-18 weeks of gestation in DS (n=6) and normal (n=6) subjects. Our DNA microarray experiments showed that the expressions of 11 genes were altered by at least 2-folds in DS, as follows. Ten genes, COL6A1, CASP5, AKT2, JUN, PYGM, BNIP1, OSF-2, PRSS7, COL3A1, and MBLL were down-regulated and GSTT1 was only up-regulated. The differential expressions of GSTT1 and COL3A1 were further confirmed by semi-quantitative RT-PCR for each sample. The gene dosage hypoth- esis on chromosome 21 may explain the neurological and other symptoms of DS.
However, our results showed that only two genes (COL6A1 and PRSS7), among 24 genes on chromosome 21, were down-regulated in the AF cells of DS. Our data may provide the basis for a more systematic identification of biological markers of fetal DS, thus leading to an improved understanding of pathogenesis for fetal DS.
Key Words : Down Syndrome; Oligonucleotide Array Sequence Analysis; Gene Expression; Amniotic Fluid
Received : 15 June 2004 Accepted : 14 September 2004
MATERIALS AND METHODS Cell culture and cytogenetic analysis
AF samples of DS and normal subjects were collected from women undergoing routine amniocentesis for genetic testing.
From July 2001 to November 2002, 12 women with preg- nancies of DS (n=6) and normal (n=6) subjects, at the CHA General Hospital, College of Medicine, Pochon CHA Univer- sity (Seoul, Korea), gave informed consent for the use of their AF cells, which only included for this study. Pochon CHA college of Medicine’s Institutional Reviewed Board approved this study for human subjects. After centrifugation of AF (10 mL) at 1,800 rpm for 10 min, the pellet of AF 0.5 mL was added to 2 mL of CHANG media (IRVINE SCIENTIFIC, Santa Ana, CA, U.S.A.) in a culture dish. AF cells were grown in the tissue culture flask under 5% CO2at 37℃in CHANG media for DNA microarray analysis. Cytogenetic analysis for determination of DS was performed on metaphase spreads of cultured AF cells by standard method.
RNA extraction and fluorescent cDNA probes labeling
AF cells were obtained from patients at 16-18 weeks ges- tation. DS (n=6) and normal (n=6) subjects, respectively, total RNA was extracted from normal and DS AF cells (at 80-90%
confluency) using RNeasy minikit (QIAGEN, Valencia, CA, U.S.A.). Total RNA isolated from every subject was quanti- tated. The purity of total RNA was confirmed by spectropho- tometer and agarose gel electrophoresis. Each 30 g of total RNA from DS (n=6) and normal (n=6) subjects was pooled, and labeled with either Cy3UTP or Cy5UTP (NEN Life Sci- ence Products, Boston, MA, U.S.A.) during reverse transcrip- tion (RT). The RT was performed using 2 g/ L oligo dT (Invitrogen, Carlsbad, CA, U.S.A), 0.1 M DTT, 200 / L superscript enzyme, 5× first strand buffer (Gibco BRL, Cergy Pontoise, France), 25 mM dATP, dGTP, dCTP, 15 mM dTTP (Amersharm, Pharmacia, Piscataway, NJ, U.S.A.), 1 mM Cy3 or Cy5 labeled dUTP (NEN). Reaction mixture was incubat- ed at 65℃for 10 min for denaturation, 42℃for 2 hr for RT.
After first strand cDNA synthesis the RNA was degraded by
Gene symbol Accession No. Gene symbol Accession No. Gene symbol Accession No.
ACTA2 NM_001613 COL3A1 X14420 PDPK1 AC005591
ACTB BC002409 COL5A2 NM_000393 PFKL NM_001002021
ACTG2 X16940 COL6A1 X99135 PGAM1 J04173
ADAM17 U86755 COL6A3 X52022 PGAM2 M55674
ADCY2 L21993 COL8A1 X57527 PKM2 NM_002654
ADCY8 NM_001115 CRADD NM_003805 PLAT M15518
AKT1 NM_005163 CRYAA NM_000394 PPP13A X78578
AKT2 M77198 CTGF NM_001901 PRG1 J03223
APEG1 NM_005976 CXADR AI557255 PRSS11 D87258
ATP5A1 AW161540 DPP4 M74777 PRSS7 U09860
BACH1 AI830904 EI24 NM_004879 PTE1 X86032
BAD NM_004322 GABRG3 S82769 PTEN U93051
BAG1 NM_004323 GAD1 NM_000817 PWP2H AB001517
BAI2 AB005298 GAPDH NM_002046 PYGB J03544
BAI3 AB005299 GBX1 L11239 PYGM U94777
BAK1 AI741331 GRIK1 NM_000830 SFN NM_006142
BCL6 NM_001706 GSTT1 NM_000853 SFRS25 AI937268
BDNF X60201 HRMT1L1 NM_001535 SLC25A4 J04982
BID NM_001196 IFNAR1 X60459 SUMO3 NM_006936
BIK NM_001197 IGFBP4 U20982 SYNJ1 AB020717
BIRC3 NM_001165 IL10RB NM_000628 TFF1 X52003
BIRC5 U75285 JUN NM_002228 TFF2 NM_005423
BNIP1 U15172 KCNJ6 AA056665 TGFB2 Y00083
C5orf13 NM_004772 LITAF NM_004862 TMEM1 U61500
CAPZA1 U56637 MBLL AF061261 TNFSF10 NM_003810
CASP1 U13697 MX2 M33883 TP53 U94788
CASP3 U13738 MYH3 X13100 TP53BP2 NM_005426
CASP4 U25804 MYH7 M57965 TRAF2 NM_021138
CASP5 X94993 MYH9 Z82215 TRAF5 U69108
CASP7 NM_001227 NCAM21 U75330 TRPM2 AB001535
CASP8 NM_001228 NOS2A U31511 TTC3 D84294
CFL2 AL117457 OSF-2 NM_006475 U2AF1 M96982
CHRNB1 AW157173 PCDH7 AB006757 UBE2G2 NM_003343
COL18A1 AF018081 PCNA NM_002592 WRB NM_004627
Table 1.List of 102 genes on cDNA microarray with accession number
adding 15 L of 0.1 N NaOH and incubating at 65℃for 30 min. 15 L of 0.1 N HCl was added for neutralization.
cDNA microarray analysis
We used cDNA chip which contained 102 genes located on chromosome 21 (24 genes), genes expressed in brain (11 genes) or muscle (17 genes) and apoptosis related genes (36 genes), extracellular matrix (ECM) related genes (4 genes), genes related to other molecular function (8 genes) and house- keeping genes (2 genes). The list of genes with accession num- ber was shown in Table 1, and functional category of total genes analyzed by GeneSpring was shown Fig. 1A (Silicon Genetics, Redwood City, CA, U.S.A.). PCR-ampilfied EST of 102 genes were fabricated by duplicate on Corning glass slide (Disgene, Seoul, Korea).
Fluorescent cDNA probes were dried after ethanol prepa- ration, and resuspended in 20 L hybridization buffer of TE (pH 8.0), 20× SSC and 10% SDS. The labeled cDNA was heated at 100℃for 2 min then incubated at 37℃for 30 min.
Reaction mixture was dropped on the slide and covered by a cover slip. The slide was assembled with a hybridization chamber and hybridized for 16 hr at 65℃.
Data analysis
The slide was dried by centrifugation and then scanned
on ScanArray 4000XL (Packard Bioscience, Billerica, MA, U.S.A.). After registration of Cy3 and Cy5 images, the uni- fied image was quantified using ImaGeneTMver 4.0 (BioDis- covery, Inc., Los Angeles, CA, U.S.A.). Normalization was performed from the quantified data by mean intensity of 102 genes on the slide (Global normalization).
Semiquantitative RT-PCR analysis
For confirmation of gene expression level, semi-quantitative RT-PCR was performed using OneStep RT-PCR kit (QIA- GEN, Inc., Valencia, CA, U.S.A.) according to the manufac- turer’s direction. For RT-PCR, 100 ng of total RNA was re- verse transcribed at 50℃for 30 min in 50 L final volume by 2 L of OneStep RT-PCR enzyme mix. Each gene specific primers were added in first strand synthesis step. The RT-PCR products were subjected to electrophoresis on 1% agarose gel.
Differentially expressed genes were detected using the follow- ing primer pairs; COL3A1 sense, 5′-gtggacagattctagtgctgag- 3′, antisense, 5′-ataggtagtctcacagccttgc-3′, GSTT1 sense, 5′-
Number of genes
35 30 25 20 15 10 5 0
Apoptosis regulator Cancer
Cell cycle regulatorimmunity proteinSignal transducer Transport
Structural protein Nucleic acid binding
Enzyme Chaperone Molecular function
A
B
A
Number of genes
15 10 5 0
Signal value of normal
2
0
-2
-4
-6
-2 0 2 4 6
Signal value
B
-4 -2 0 2
Signal value of DS
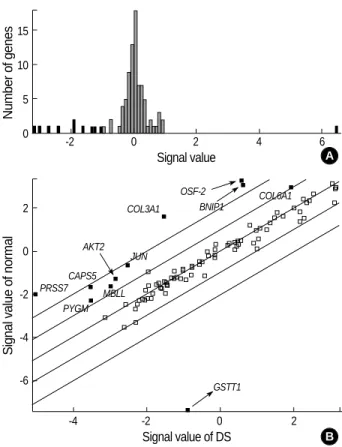
Fig. 2.Histogram and scatter plot by DNA microarray experiment.
(A) This histogram shows the distribution of gene expression ratios between normal and DS subjects. One gene (GSTT1) was up-reg- ulated and ten genes were down-regulated in DS. The horizontal axis refers to the expression ratio, and vertical axis indicates num- ber of genes. (B) Each spot represents a single gene. Genes were expressed the same level in two samples fall along 45°angle line.
Black spots were expressed over 2-folds but empty spots are ex- pressed less than 2-folds.
GSTT1 PRSS7
PYGM CAPS5
AKT2
MBLL JUN COL3A1
OSF-2 BNIP1
COL6A1
Fig. 1.The ontology of genes on the chip. (A) One hundred two genes were classified into functional subgroups using Simplified ontology in GeneSpring (Silicon Genetics, Redwood City, CA, U.S.A.). (B) The PCR amplicons of human cDNA clones were spot- ted in 4 blocks using a 4-pin print head, and all of genes spotted in duplicate. The similar result has shown by the repeated experiments.
GAPDH and -actin were spotted in last row of each blocks.
tgactactggtaccctcaggac-3′, antisense, 5′-aggtcagctaaggagatgt- gag-3′, and GAPDH sense, 5′-accacagtccatgccatcac-3′, anti- sense, 5′-tccaccaccctgttgctgta-3′.
RESULTS
Analysis of the gene expression profiles by DNA microarray
Microarray is powerful tool for analyzing expression profile and identifying bio-marker in clinical samples. In our microarray experiment, the RNA samples of the normal (n=6) and DS (n=6) subjects were pooled to reduce the effect of individual variations. Hybridization spots were quantified and normal- ized using ImaGeneTMver 4.0 software (BioDiscovery, Inc., Marina del Rey, CA, U.S.A.). To normalize the intensity levels of genes on the chip, we compared the Cy3:Cy5 intensity ratios of all spots on the array (Global normalization). GAPDH and -actin, the housekeeping genes, were used as controls and the signal intensity of these genes was represented the almost
same in Cy3 and Cy5 (Fig. 1B). The overall hybridization signals obtained by using cDNA probe of normal and DS subjects were similar (<2-folds). Eleven genes in DS showed the differences of 2-folds or more (Fig. 2).
Differentially expressed genes in DS samples
Differentially expressed genes are represented by a pair mean ratio (Log2Test Mean/Control Mean) of signal intensity.
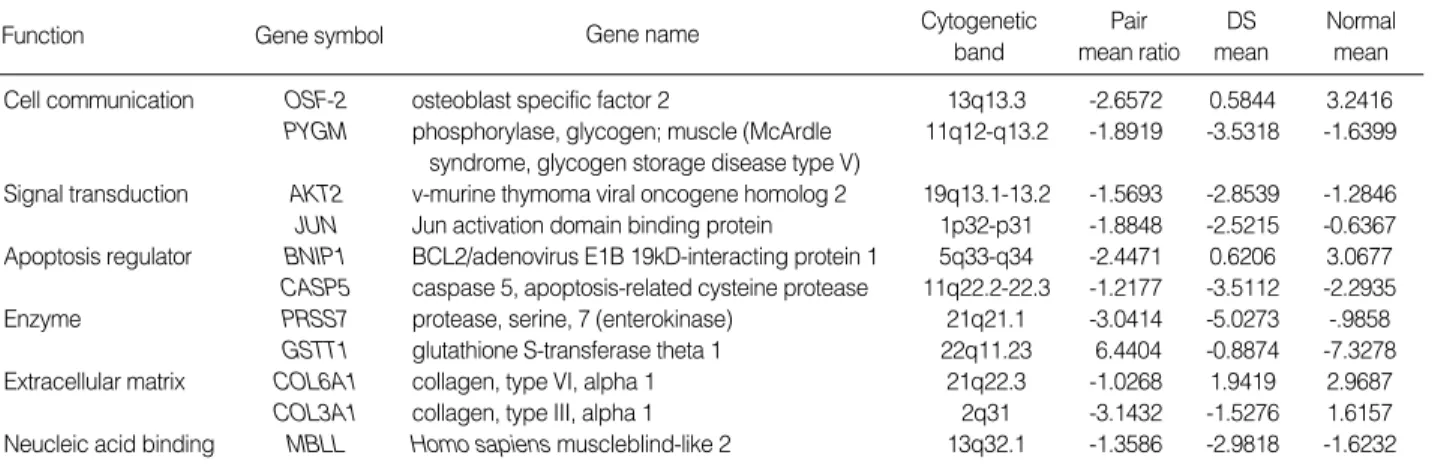
The overexpression of gene was defined as a pair mean ratio of >1.0. Eleven genes were differentially expressed in DS, as summarized in Table 2. Only one gene, GSTT1, was up-reg- ulated (1/102, 1%) and 10 genes were down-regulated in DS (10/102, 10%); OSF-2, PYGM, AKT2, JUN, BNIP1, COL- 3A1, COL6A1, CSAP5, PRSS7 and MBLL (Fig. 2). These genes fell into the following groups: 1) Cell communication;
OSF-2 and PYGM, 2) Signal transduction; AKT2, JUN and BNIP1, 3) Apoptosis; CSAP5, 4) Enzyme; PRSS7 and GSTT1.
The functional categorization differentially expressed genes were classified using GeneSpring (ver 6 Silicon Genetics, Red- wood, CA, U.S.A.) and summarized in Table 2.
Semi-quantitative RT-PCR of COL3A1 and GSTT1
We confirmed the microarray results to validate these differ- entially expressed genes in DS and normal samples by semi- quantitative RT-PCR, and the matched results were observed (data not shown). We selected two genes; one up-regulated gene (GSTT1) and one down-regulated gene (COL3A1), for analysis of every subject, and the semi-quantitative RT-PCR results are shown in Fig. 3. GSTT1 was highly expressed in 50% of DS subjects (3/6), but in only one of normal subjects (1/6, 17%). The expression of COL3A1 was down-regulated in the DS subjects (5/6, 83%), but not in the normal subjects (0/6, 0%).
Function Gene symbol Gene name Cytogenetic
band
Pair mean ratio
DS mean
Normal mean Cell communication OSF-2 osteoblast specific factor 2 13q13.3 -2.6572 0.5844 3.2416 PYGM phosphorylase, glycogen; muscle (McArdle 11q12-q13.2 -1.8919 -3.5318 -1.6399
syndrome, glycogen storage disease type V)
Signal transduction AKT2 v-murine thymoma viral oncogene homolog 2 19q13.1-13.2 -1.5693 -2.8539 -1.2846 JUN Jun activation domain binding protein 1p32-p31 -1.8848 -2.5215 -0.6367 Apoptosis regulator BNIP1 BCL2/adenovirus E1B 19kD-interacting protein 1 5q33-q34 -2.4471 0.6206 3.0677 CASP5 caspase 5, apoptosis-related cysteine protease 11q22.2-22.3 -1.2177 -3.5112 -2.2935
Enzyme PRSS7 protease, serine, 7 (enterokinase) 21q21.1 -3.0414 -5.0273 -.9858
GSTT1 glutathione S-transferase theta 1 22q11.23 6.4404 -0.8874 -7.3278 Extracellular matrix COL6A1 collagen, type VI, alpha 1 21q22.3 -1.0268 1.9419 2.9687 COL3A1 collagen, type III, alpha 1 2q31 -3.1432 -1.5276 1.6157 Neucleic acid binding MBLL Homo sapiens muscleblind-like 2 13q32.1 -1.3586 -2.9818 -1.6232 Table 2.List of 11 genes differentially expressed by 2- folds or greater
DS Mean, Mean fluorescence intensities of DS subjects; Normal Mean, Mean fluorescence intensities of normal subjects; Pair Mean Ratio, Log2DS Mean/
Normal Mean.
Fig. 3.Semi-quantitative RT-PCR analysis of normal vs. DS subjects.
RT-PCR analysis of COL3A1, GSTT1 and GAPDH was performed in AF cells of 6 normal and 6 DS. GAPDH serves as an internal con- trol. Lane 1-6: Normal subject, Lane 7-12: DS subject.
1 2 3 4 5 6 7 8 9 10 11 12
300 bp
Nomal
COL3A1
GSTT1
GAPDH
DS
200 bp
400 bp
DISCUSSION
The gene dosage hypothesis by extra chromosome 21 may explain the neurological and other symptoms of DS. We ana- lyzed the differential gene expression of AF cells of DS, alth- ough it is not fully clear how our analysis using AF cells can lead to the syndrome phenotype. Our analysis using AF cells may not explain the direct pathogenesis of common DS phe- notype, but could be important for prenatal diagnosis and the study of DS fetus development.
According to the ‘‘gene dosage effect’’ hypothesis, the dif- ferential regulation of chromosome 21 genes causes the DS phenotype. Gazzolo et al. reported that S100B protein level of AF were significantly higher (1.5 fold) in DS fetuses (14).
S100B gene is located on chromosome 21 and is calcium binding protein originally isolated from the nervous system (15). This gene is not only overexpressed in AF, but also life- long overexpressed in DS (11).
In the present study, we identified 11 differentially expressed genes in AF cells in DS. GSTT1, the up-regulated gene, plays a role for the intracellular binding, transport of many bio-mo- lecular entities, and detoxification process. GSTT1 was not detected in any fetal organs examined, but found in deciduas (16). Moreover, this gene was absent in 38% of the population (17), and we found this gene up-regulated in AF cells of DS by approximately 4-folds in semi-quantitative RT-PCR analysis.
COL6A1, COL3A1 and OSF-2, three of the ten down-reg- ulated genes, code for components of the extracellular matrix (ECM). COL6A1 protein was reported to be down-regulated in the brain of DS fetus (18) and to be expressed in the devel- oping atrioventricular (AV) canal. Genetic variations of this gene have been associated with DS AV defects in human gene- tic studies (19). According to recently published data, expres- sion changes of the ECM-related genes may also contribute to cardiac defects (19) and abnormalities of brain in DS (20, 21). COL3A1 gene, which encodes chains of type III procol- lagen, is important for the development of skin, the cardio- vascular system and maintaining the normal physiological functions of these organs (22). Superti-Furga et al. provided the first description of a mutation of the COL3A1 gene in type IV Ehlers-Danlos syndrome (EDS). Synthesis of type III collagen is defective in type IV EDS (23). OSF-2, transcrip- tion activation protein, might play a role in cell to cell com- munication in bone, ECM turnover and switches cells into the osteoblastic pathway (24). It is possible that abnormal expression of OSF-2 may affect increased flexibility in joints of DS patients.
Beta amyloid precursor protein (APP), CuZn superoxide dismutase (SOD1) and S100beta have been implicated in caus- ing apoptosis thought to be responsible for neuronal loss in DS (25). Little is known, however, about the changes of cas- pases and their regulatory proteins in DS. Gulesserian et al.
reported that procaspase-3 and -8 were significantly decreased in frontal cortex (26). Although we used AF cells in this study,
caspase-3 was down-regulated. BNIP1, Pro-apoptotic protein, was also down-regulated. This gene interacts with BCL-2 family which is anti-apoptosis proteins (27).
According to the gene dosage hypothesis, some genes on chromosome 21 would overexpress in DS. Previous study showed that the genes located on chromosome 21 have been found to be overexpressed in cells and tissues of DS (28). Our data showed that the expression level of most genes located on chromosome 21 (22/24 genes) did not change in the AF cells of DS. Only two genes (COL6A1 and PRSS7) were dif- ferentially expressed, especially for down regulation in the AF cells of DS. Our microarray analysis determined the expres- sions of 102 genes potentially important in DS and may pro- vide the basis for a more systematic identification of biomark- ers, thus leading to understanding of the developmental and pathogenic study for fetal DS.
ACKNOWLEDGEMENT
This study was supported by a grant of the Korea Health 21 R&D Project, Ministry of Health & Welfare, Republic of Korea (01-PJ10-PG6-01GN13-0002). The human cDNA clones on the chip were kindly provided from the Center for Functional analysis of Human Genome, KRIBB, Korea.
REFERENCES
1. Korenberg JR, Chen XN, Schipper R, Sun Z, Gonsky R, Gerwehr S, Carpenter N, Daumer C, Dignan P, Disteche C, Graham Jr JM, Hu- dgins L, Mcgillivray B, Miyazaki K, Ogasawara N, Park JP, Pagon R, Pueschel S, Sack G, Say B, Schuffenhauer S, Soukup S, Yamanaka T.
Down syndrome phenotypes: the consequences of chromosomal imbal- ance. Proc Natl Acad Sci USA 1994; 91: 4997-5001.
2. Lamb NE, Feingold E, Savage A, Avramopoulos D, Freeman S, Gu Y, Hallberg A, Hersey J, Karadima G, Pettay D, Saker D, Shen J, Taft L, Mikkelsen M, Petersen MB, Hassold T, Sherman SL. Character- ization of susceptible chiasma configurations that increase the risk for maternal nondisjunction of chromosome 21. Hum Mol Genet 1997;
6: 1391-9.
3. Antonarakis SE. 10 years of Genomics, chromosome 21, and Down syndrome. Genomics 1998; 51: 1-16.
4. Woodhouse JM, Hodge SJ, Earlam RA. Facial characteristics in chil- dren with Down’s syndrome and spectacle fitting. Ophthalmic Physiol Opt 1994; 14: 25-31.
5. Engidawork E, Gulesserian T, Fountoulakis M, Lubec G. Aberrant protein expression in cerebral cortex of fetus with Down syndrome.
Neuroscience 2003; 122: 145-54.
6. Takashima S, Becker LE, Armstrong DL, Chan F. Abnormal neuronal development in the visual cortex of the human fetus and infant with Down’s syndrome. A quantitative and qualitative Golgi study. Brain Res 1981; 225: 1-21.
7. Ferencz C, Neill CA, Boughman JA, Rubin JD, Brenner JI, Perry LW.
Congenital cardiovascular malformations associated with chromo- some abnormalities: an epidemiologic study. J Pediatr 1989; 114:
79-86.
8. Freeman SB, Taft LF, Dooley KJ, Allran K, Sherman SL, Hassold TJ, Khoury MJ, Saker DM. Population-based study of congenital heart defects in Down syndrome. Am J Med Genet 1998; 80: 213-7.
9. Fuentes JJ, Genesca L, Kingsbury TJ, Cunningham KW, Perez-Riba M, Estivill X, de la Luna S. DSCR1, overexpressed in Down syn- drome, is an inhibitor of calcineurin-mediated signaling pathways.
Hum Mol Genet 2000; 9: 1681-90.
10. Yamaki A, Tochigi J, Kudoh J, Minoshima S, Shimizu N, Shimizu Y. Molecular mechanisms of human single-minded 2 (SIM2) gene expression: identification of a promoter site in the SIM2 genomic sequence. Gene 2001; 270: 265-75.
11. Griffin WS, Sheng JG, McKenzie JE, Royston MC, Gentleman SM, Brumback RA, Cork LC, Del Bigio MR, Roberts GW, Mrak RE. Life- long overexpression of S100beta in Down’s syndrome: implications for Alzheimer pathogenesis. Neurobiol Aging 1998; 19: 401-5.
12. Roh MS, Hong SH, Jeong JS, Kwon HC, Kim MC, Cho SH, Yoon JH, Hwang TH. Gene expression profiling of breast cancers with em- phasis of beta-catenin regulation. J Korean Med Sci 2004; 19: 275- 82.
13. Prusa AR, Marton E, Rosner M, Freilinger A, Bernaschek G, Heng- stschlager M. Stem cell marker expression in human trisomy 21 amni- otic fluid cells and trophoblasts. J Neural Transm Suppl 2003; 67:
235-42.
14. Gazzolo D, Bruschettini M, Corvino V, Lituania M, Sarli R, Bruschet- tini P, Michetti F. Amniotic fluid levels of S100B protein in normal and trisomy-21 foetuses. Clin Chim Acta 2003; 330: 131-3.
15. Heizmann CW. Ca2+-binding S100 proteins in the central nervous system. Neurochem Res 1999; 24: 1097-100.
16. Raijmakers MT, Steegers EA, Peters WH. Glutathione S-transferas- es and thiol concentrations in embryonic and early fetal tissues. Hum Reprod 2001; 16: 2445-50.
17. Pemble S, Schroeder KR, Spencer SR, Meyer DJ, Hallier E, Bolt HM, Ketterer B, Taylor JB. Human glutathione S-transferase theta (GSTT1):
cDNA cloning and the characterization of a genetic polymorphism.
Biochem J 1994; 300 (Pt 1): 271-6.
18. Engidawork E, Baiic N, Fountoulakis M, Dierssen M, Greber-Platzer S, Lubec G. Beta-amyloid precursor protein, ETS-2 and collagen alpha 1 (VI) chain precursor, encoded on chromosome 21, are not overexpressed in fetal Down syndrome: further evidence against gene dosage effect. J Neural Transm Suppl 2001; 61: 335-46.
19. Davies GE, Howard CM, Farrer MJ, Coleman MM, Bennett LB, Cullen LM, Wyse RK, Burn J, Williamson R, Kessling AM. Genetic variation in the COL6A1 region is associated with congenital heart defects in trisomy 21 (Down’s syndrome). Ann Hum Genet 1995; 59 (Pt 3): 253-69.
20. Loftis MJ, Sexton D, Carver W. Effects of collagen density on cardiac fibroblast behavior and gene expression. J Cell Physiol 2003; 196:
504-11.
21. Anlar B, Atilla P, Cakar AN, Kose MF, Beksac MS, Dagdeviren A, Akcoren Z. Expression of adhesion and extracellular matrix molecules in the developing human brain. J Child Neurol 2002; 17: 707-13.
22. Olsen BR. The roles of collagen genes in skeletal development and morphogenesis. Experientia 1995; 51: 194-5.
23. Superti-Furga A, Gugler E, Gitzelmann R, Steinmann B. Ehlers-Dan- los syndrome type IV: a multi-exon deletion in one of the two COL3A1 alleles affecting structure, stability, and processing of type III procol- lagen. J Biol Chem 1988; 263: 6226-32.
24. Sugiura T, Takamatsu H, Kudo A, Amann E. Expression and char- acterization of murine osteoblast-specific factor 2 (OSF-2) in a bac- ulovirus expression system. Protein Expr Purif 1995; 6: 305-11.
25. Engidawork E, Lubec G. Protein expression in Down syndrome brain.
Amino Acids 2001; 21: 331-61.
26. Gulesserian T, Engidawork E, Yoo BC, Cairns N, Lubec G. Alteration of caspases and other apoptosis regulatory proteins in Down syn- drome. J Neural Transm Suppl 2001; 61: 163-79.
27. Yasuda M, Chinnadurai G. Functional identification of the apoptosis effector BH3 domain in cellular protein BNIP1. Oncogene 2000; 19:
2363-7.
28. Cheon MS, Shim KS, Kim SH, Hara A, Lubec G. Protein levels of genes encoded on chromosome 21 in fetal Down syndrome brain:
Challenging the gene dosage effect hypothesis (Part IV). Amino Acids 2003; 25: 41-7.