Comparison of Lipid-Related Ratios for Prediction of Chronic Kidney Disease Stage 3 or More in Korean Adults
Dyslipidemia is implicated in increased cardiovascular risk associated with chronic kidney disease (CKD) and in the progression of renal damage. This study compared 4 different lipid-related ratios (total cholesterol [TC]/high-density lipoprotein cholesterol [HDL-C], triglyceride [TG]/HDL-C, calculated low-density lipoprotein cholesterol [c-LDL-C]/HDL-C, and non-HDL-C/HDL-C ratio) for prediction of CKD stage 3 or more to investigate the association between them. This cross-sectional study included 8,650 adults who
participated in the 2007-2008 Korean National Health and Nutrition Examination Survey.
The overall prevalence of CKD stage 3 or more was 6.4%. For TG/HDL-C, the prevalence with CKD stage 3 or more increased with increasing quartile group in both sexes (P value for trend = 0.046 in men, 0.002 in women) while other lipid-related ratios showed increasing prevalence only in women. In comparison with the lowest quartile of the lipid- related ratios, only the fourth quartile of TG/HDL-C was associated with the prevalence of CKD stage 3 or more in both sexes after adjustment for multiple covariates (odds ratio [OR]
for TG/HDL-C-Q4, 1.82; 95% CI [confidence interval], 1.09-3.03 in men, OR 2.45; 95%
CI, 1.52-3.95 in women). In conclusion, TG/HDL-C is the only lipid-related ratio that is independently associated with CKD stage 3 or more in both sexes of Koreans.
Key Words: Kidney Failure, Chronic; Dyslipidemias; Glomerular Filtration Rate Ji-Young Kim1, Hee-Taik Kang1,
Hye-Ree Lee1, Yong-Jae Lee2, and Jae-Yong Shim1
1Department of Family Medicine, Gangnam Severance Hospital, Yonsei University College of Medicine, Seoul; 2Department of Family Medicine, Yongin Severance Hospital, Yonsei University College of Medicine, Yongin, Korea Received: 27 June 2012 Accepted: 11 October 2012 Address for Correspondence:
Jae-Yong Shim, MD
Department of Family Medicine, Yonsei University College of Medicine, 211 Eonju-ro, Gangnam-gu, Seoul 135-720, Korea Tel: +82.2-2019-3480; Fax: +82.2-3463-3287 E-mail: [email protected]
http://dx.doi.org/10.3346/jkms.2012.27.12.1524 • J Korean Med Sci 2012; 27: 1524-1529
INTRODUCTION
The number of people affected by chronic kidney disease (CKD) or who require renal replacement therapy is steadily increasing (1). Cardiovascular disease (CVD) accounts by far for the larg- est proportion of fatalities in people with CKD (2). Dyslipidemia including increased total cholesterol (TC), triglycerides (TG), and low-density lipoprotein cholesterol (LDL-C) concentrations and decreased high-density lipoprotein cholesterol (HDL-C) is one of the risk factors implicated in increased cardiovascular risk associated with CKD and also in the progression of renal damage (3, 4). Therefore, early identification and proper man- agement not only of CKD but also of dyslipidemia can prevent the progression of end stage renal disease (ESRD) and the de- velopment of associated morbidities including CVD.
Clinical trials in the general population and in established CVD patients have found that management of dyslipidemia is consistently and independently associated with the reduction of all-cause mortality and cardiovascular mortality (5, 6). Sever- al studies have compared different lipid-related ratios for pre- diction of atherosclerotic CVD (7-9). However, data on the as- sociation of each lipid-related ratio with CKD and the data on the use of lipid-related ratios for prediction of CKD is still lack- ing, particularly on methods for comparison. A recent study re-
ported that TG/HDL-C is positively associated with CKD preva- lence, but other lipid-related ratios were not evaluated or com- pared in the study (10).
The National Cholesterol Education Program has proposed the widespread use of non–high-density lipoprotein cholesterol (nHDL-C) as a secondary target of therapy, after the primary target of LDL-C has been attained (11). nHDL-C is the differ- ence between TC and HDL-C and accounts for LDL-C, very low-density cholesterol (VLDL) particles, and its remnants that reflects the increased risk of coronary heart disease.
Because current lipid-lowering strategies do not control com- plications of hyperlipidemia as well as they should (12), and be- cause the indices focus on somewhat different aspects of a com- plex lipid profile, it is important to understand the aspects of each lipid index which controls dyslipidemia-associated complications.
Therefore, we investigated the relationships between several lipid-related ratios and CKD prevalence. We also compared the lipid-related ratios for prediction of CKD in a nationally repre- sentative sample of Korean adults.
MATERIALS AND METHODS Study subjects
This study was based on data obtained from the 2007-2008 Ko-
rean National Health and Nutrition Examination Survey (KNH- ANES), a cross-sectional and nationally representative survey that was conducted by the Korean Centers for Disease Control and Prevention, from July, 2007 to December, 2008. Non-insti- tutionalized civilians in Korea, at least one year of age, were the target population of the survey. Sampling units were households that were selected through a stratified, multistage, probability- sampling design that was based on geographic area, gender, and age from a database of household registries. Three-hun- dred sampling frames, consisting of 6,900 households from the primary sampling units, were randomly sampled. Of these, 5,424 households (78.6%) were included in the study. To enable the results from this study to represent the entire population of Ko- rea, weights indicating the probability of being sampled were assigned to each participant. Participants completed three parts of a questionnaire, composed of a Health Interview Survey, Health Examination Survey, and Nutrition Survey.
The 2007-2008 KNHANES had 18,983 initial target samples.
The Health Examination Survey and the Health Interview Sur- vey were completed by 13,554 (71.4%) of total samples. We ex- cluded individuals younger than 19 yr of age, who were taking any lipid-lowering medications, with known histories of any malignancy, without laboratory data such as creatinine and lip- ids, or who had not fasted for at least 12 hr prior to blood sam- pling. A total of 8,650 individuals (3,644 men and 5,006 women) were included in the final analysis.
Data collection
At the time the 2007-2008 KNHANES was conducted, target samples were informed that they had been randomly selected as a household to voluntarily participate in a survey conducted by the Korean Centers for Disease Control and Prevention. In accordance with the National Health Enhancement Act, sup- ported by the National Statistics Law of Korea, all target samples were given the right to refuse to participate.
Trained medical staff performed physical examinations ac- cording to standardized procedures. Body weight and height were measured in light indoor clothing without shoes to the nearest 0.1 kg and 0.1 cm, respectively. Waist circumference was measured at the narrowest point between the lower border of the rib cage and the iliac crest. Body mass index (BMI) was cal- culated as the ratio of weight/height2 (kg/m2). Systolic blood pressure (SBP) and diastolic blood pressure (DBP) were mea- sured using the right arm with a standard mercury sphygmoma- nometer (Baumanometer, Copiague, NY, USA). The average of two systolic and diastolic blood pressure readings, recorded at an interval of 5 min, was used for analysis. After 12 hr of over- night fasting, blood samples were obtained from the antecubi- tal veins of the study subjects. Fasting plasma glucose, TC, TG, HDL-C, and creatinine levels were measured using an ADIVIA 1650 chemistry analyzer (Siemens, Washington, DC, USA).
Definitions of regular drinker, CKD and lipid-related ratios We defined a regular drinker as a participant who had more than one drinking episode per a month. We defined CKD stage 3 or more as an estimated glomerular filtration rate (eGFR) be- low 60 mL/min/1.73 m2 (13). The eGFR was calculated using the abbreviated equation from the Modification of Diet in Re- nal Disease (MDRD) study: 186.3 × (serum creatinine-1.154) × (age-0.203) × 0.742 (if female) (14). LDL-cholesterol was indirect- ly calculated using Friedewald’s formula: TC – HDL-C – (TG/5) (15). nHDL-C was calculated as HDL-C subtracted from TC.
Each of four lipid-related ratios as TC (mg/dL), TG (mg/dL), cal- culated LDL-C (cLDL-C) (mg/dL), and nHDL-C (mg/dL) were divided by HDL-C (mg/dL).
We classified each lipid-related ratio into quartile groups in each sex. These groups were categorized as follows: TC/HDL-C Q1, < 3.40; Q2, 3.40-4.18; Q3, 4.19-5.00; Q4, ≥ 5.10 in men; Q1,
< 3.05; Q2, 3.05-3.75; Q3, 3.76-4.64; Q4, ≥ 4.65 in women; TG/
HDL-C Q1, < 1.74; Q2, 1.74-2.82; Q3, 2.83-4.65; Q4, ≥ 4.66 in men; Q1, < 1.19; Q2, 1.19-1.94; Q3, 1.95-3.24; Q4, ≥ 3.25 in wom- en; cLDL-C/HDL-C Q1, < 1.87; Q2, 1.87-2.46; Q3, 2.47-3.21; Q4,
≥ 3.22 in men; Q1, < 1.73; Q2, 1.73-2.28; Q3, 2.29-2.96; Q4, ≥ 2.97 in women; nHDL-C/HDL-C Q1, < 2.40; Q2, 2.40-3.18; Q3, 3.19- 4.09; Q4, ≥ 4.10 in men; Q1, < 2.05; Q2, 2.05-2.75; Q3, 2.76-3.64;
Q4, ≥ 3.65 in women.
Statistical analysis
With the exceptions of TG and lipid-related ratios, the charac- teristics of the study sample were summarized using the inde- pendent two-sample t-test for continuous variables and the chi- square test for categorical variables. To compare the median values of TG and lipid-related ratios, we used the Mann-Whit- ney U test due to accommodate skewedness. We investigated the relationship between eGFR and other continuous variable, using Pearson’s correlation analysis. Odds ratios (ORs) and 95%
confidence intervals (95% CIs) for CKD stage 3 or more were calculated using logistic regression analysis after adjustment for other covariates across quartiles of lipid-related ratios. P value for trend was determined by linear regression analysis. Analysis was conducted using SAS statistical software, version 9.1 (SAS Institute Inc., Cary, NC, USA). All statistical tests were two-sided, and statistical significance was determined at P value < 0.05.
Ethics statement
Written informed consent to participate in the study was ob- tained from participants and their parents (if applicable). The participants also provided written informed consents for the use of blood samples in further analyses, to the Korea Centers for Disease Control and Prevention. This study was approved by the institutional review board of Gangnam Severance Hospi- tal, Yonsei University, Seoul, Korea (Approval number: 3-2011- 0161).
RESULTS
Table 1 shows characteristics of the 8,650 adult subjects (3,644 men and 5,006 women). The mean age of men and women were 48.5 and 48.6 yr, respectively. The mean or median values of BMI, waist circumference, SBP, DBP, fasting plasma glucose, TC, HDL-C, TG, cLDL-C, nHDL-C, TC/HDL-C, TG/HDL-C, cLDL-C/HDL-C, nHDL-C/HDL-C, and creatinine were higher in men than in women, while serum HDL-C levels were higher in women than in men. The mean value of eGFR did not differ between men and women. The percentages of subjects who were current smokers, current alcohol drinkers, or engaged in regular exercise were higher in men, while the percentage of subjects with CKD stage 3 or more was higher in women (4.7%
in men versus 7.7% in women).
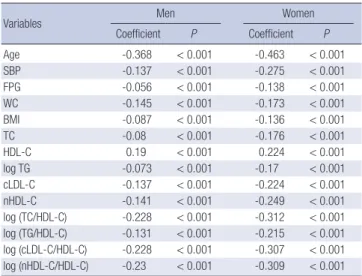
Table 2 shows Pearson’s correlations among eGFR, lipid-re- lated ratios, and other risk factors in each sex. Age, SBP, fasting
plasma glucose, waist circumference, BMI, TC, logarithm-trans- formed (log) TG, cLDL-C, nHDL-C, log TC/HDL-C, log TG/HDL- C, log cLDL-C/HDL-C and log nHDL-C/HDL-C were negative- ly correlated with eGFR, while HDL-C was positively associated with eGFR in both sexes. All values were statistically significant (P value < 0.05).
Fig. 1 shows the prevalence of CKD stage 3 or more accord- ing to lipid-related ratios quartile. The overall prevalence of CKD stage 3 or more was 6.4%. For TG/HDL-C, the percentage of sub- jects with CKD stage 3 or more increased with higher quartile group in both men and women (P value for trend = 0.046 in men, 0.002 in women). For TC/HDL-C, cLDL-C/HDL-C, nHDL- C/HDL-C, the percentage of subjects with CKD stage 3 or more increased with higher quartile group only in women.
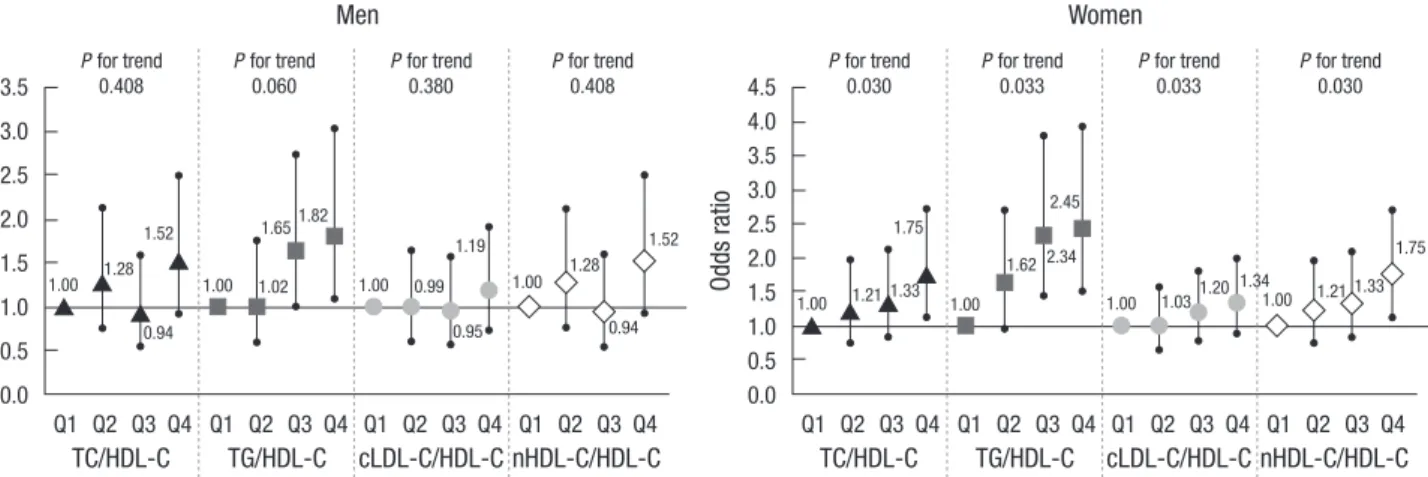
Fig. 2 shows the ORs for CKD stage 3 or more according to lipid-related ratios quartile after adjustment for age, SBP, fasting plasma glucose, waist circumference, BMI, smoking status, al- cohol-drinking status, and exercise status for each sex. In com- paring participants who were categorized in the first quartiles of each lipid-related ratio, only the fourth quartile of TG/HDL- C was associated with CKD stage 3 or more for men. The ORs (95% CIs) for CKD stage 3 or more of participants who were cat- egorized in the TG/HDL-C-Q4 was 1.82 (1.09-3.03) in men. For women, the fourth quartile of TC/HDL-C, the third and fourth quartile of TG/HDL-C, and the fourth quartile of nHDL-C/
HDL-C were associated with CKD stage 3 or more. ORs (95%
CIs) were 1.75 (1.13-2.73) in TC/HDL-C-Q4, 2.34 (1.44-3.79) in TG/HDL-C-Q3, 2.45 (1.52-3.95) in TG/HDL-C-Q4 and 1.75 (1.13-2.73) in nHDL-C/HDL-C-Q4. The ORs for CKD stage 3 or more increased in higher quartile group for all lipid-related ra- tios in women. All P values for trends of each lipid-related ratio Table 1. Basic characteristics of the study subjects (n = 8,650)
Parameters Men
(n = 3,644)
Women
(n = 5,006) P value
Age (yr) 48.5 ± 16.1 48.6 ± 16.8 0.799*
BMI 23.9 ± 3.1 23.3 ± 3.1 < 0.001*
WC (cm) 84.6 ± 8.8 79.6 ± 10.0 < 0.001*
SBP (mmHg) 119.0 ± 15.7 114.0 ± 18.1 < 0.001*
DBP (mmHg) 77.9 ± 10.4 72.8 ± 10.4 < 0.001*
FPG (mg/dL) 99.0 ± 24.0 95.7 ± 23.2 < 0.001*
TC (mg/dL) 186.8 ± 35.0 189.2 ± 36.7 0.002*
HDL-C (mg/dL) 45.6 ± 11.6 50.7 ± 13.0 < 0.001*
TG (mg/dL) 122.0
(84.0, 185.0)
96.0 (66.75, 142.0)
< 0.001† cLDL-C (mg/dL) 110.6 ± 40.0 115.0 ± 32.7 < 0.001*
nHDL-C (mg/dL) 141.2 ± 35.5 138.5 ± 37.5 0.001*
TC/HDL-C 4.19 (3.40, 5.10) 3.76 (3.05, 4.65) < 0.001† TG/HDL-C 2.83 (1.74, 4.66) 1.95 (1.19, 3.25) < 0.001† cLDL-C/HDL-C 2.47 (1.87, 3.22) 2.29 (1.73, 2.97) < 0.001† nHDL-C/HDL-C 3.19 (2.40, 4.10) 2.76 (2.05, 3.65) < 0.001† Creatinine (mg/dL) 1.06 ± 0.27 0.83 ± 0.21 < 0.001*
eGFR (mL/min/1.73 m2) 82.5 ± 15.1 82.4 ± 17.9 0.665*
Smoking status (%) Never smoker Former smoker Current smoker
18.1 37.7 44.3
88.2 6.1 5.8
< 0.001‡
Drinking status (%) Non-drinker
Regular drinker 26.9
73.1 61.0
39.0
< 0.001‡
Regular exercise (%) None
1-2 times/week 3-4 time/week
54.3 18.4 27.2
63.1 13.1 23.8
< 0.001‡
CKD stage 3 or
more prevalence (%) 4.7 7.7 < 0.001‡
*P value as determined by independent two-sample t-test; †P value as determined by Mann-Whitney U test; ‡P value as determined by chi-squared test. BMI, body mass index; WC, waist circumference; SBP, systolic blood pressure; DBP, diastolic blood pressure; FPG, fasting plasma glucose; TC, total cholesterol; HDL-C, high density lipo- protein-cholesterol; TG, triglyceride; cLDL-C, calculated low density lipoprotein-cho- lesterol; nHDL-C, non-high density lipoprotein-cholesterol; CKD, chronic kidney dis- ease.
Table 2. Pearson’s correlation among eGFR and other continuous variables
Variables Men Women
Coefficient P Coefficient P
Age -0.368 < 0.001 -0.463 < 0.001
SBP -0.137 < 0.001 -0.275 < 0.001
FPG -0.056 < 0.001 -0.138 < 0.001
WC -0.145 < 0.001 -0.173 < 0.001
BMI -0.087 < 0.001 -0.136 < 0.001
TC -0.08 < 0.001 -0.176 < 0.001
HDL-C 0.19 < 0.001 0.224 < 0.001
log TG -0.073 < 0.001 -0.17 < 0.001
cLDL-C -0.137 < 0.001 -0.224 < 0.001
nHDL-C -0.141 < 0.001 -0.249 < 0.001
log (TC/HDL-C) -0.228 < 0.001 -0.312 < 0.001 log (TG/HDL-C) -0.131 < 0.001 -0.215 < 0.001 log (cLDL-C/HDL-C) -0.228 < 0.001 -0.307 < 0.001 log (nHDL-C/HDL-C) -0.23 < 0.001 -0.309 < 0.001 P value as determined by Pearson’s correlation analysis. log, logarithm-transformed;
BMI, body mass index; WC, waist circumference; SBP, systolic blood pressure; FPG, fasting plasma glucose; TC, total cholesterol; HDL-C, high density lipoprotein-choles- terol; TG, triglyceride; cLDL-C, calculated low density lipoprotein-cholesterol; nHDL-C, non-high density lipoprotein-cholesterol;
Fig. 1. Prevalence of chronic kidney disease stage 3 or more according to lipid-related ratios quartile for each sex. For TG/HDL-C, the percentage of subjects with CKD stage 3 or more increased with increasing quartile group in both men and women. For TC/HDL-C, cLDL-C/HDL-C, nHDL-C/HDL-C, the percentage of subjects with CKD stage 3 or more increased with increasing quartile group only in women.
Prevalence of CKD stage 3 or more (%)Prevalence of CKD stage 3 or more (%)
Men
Men
Men
Men 0.174
0.076
0.046
0.175 P for trend
P for trend
P for trend
P for trend TC/HDL-C ratio
cLDL-C/HDL-C ratio
TG/HDL-C ratio
nHDL-C/HDL-C ratio Women
Women
Women
Women 0.038
0.038
0.002
0.021
3.2%
3.5%
3.1%
3.2%
2.6%
3.3%
1.8%
2.6%
4.8%
4.0%
3.7%
4.8%
5.4%
5.7%
5.3%
5.4%
4.0%
4.5%
5.8%
4.0%
8.3%
7.7%
9.9%
8.3%
6.7%
6.7%
6.0%
6.7%
14.5%
14.0%
13.6%
14.5%
Q1 Q2 Q3 Q4 Q1 Q2 Q3 Q4
Q1 Q2 Q3 Q4 Q1 Q2 Q3 Q4
Q1 Q2 Q3 Q4 Q1 Q2 Q3 Q4
Q1 Q2 Q3 Q4 Q1 Q2 Q3 Q4
15.0
10.0
5.0
0.0
15.0
10.0
5.0
0.0
15.0
10.0
5.0
0.0
15.0
10.0
5.0
0.0
Fig. 2. Odds ratios for CKD stage 3 or more according to lipid-related ratios quartiles after adjustment for age, SBP, fasting plasma glucose, waist circumference, BMI, smoking status, alcohol-drinking status, and exercise status for each sex. In comparison with participants who were categorized in the first quartiles of each lipid-related ratio, only the fourth quartile of TG/HDL-C was associated with CKD stage 3 or more for men. For women, the fourth quartile of TC/HDL-C, the third and fourth quartile of TG/HDL-C, and the fourth quartile of nHDL-C/HDL-C were associated with CKD stage 3 or more. The ORs for CKD stage 3 or more increased with increasing quartile group for all lipid-related ratios in women.
Odds ratio Odds ratio
Men Women
3.5 3.0 2.5 2.0 1.5 1.0 0.5 0.0
4.5 4.0 3.5 3.0 2.5 2.0 1.5 1.0 0.5 0.0 P for trend
0.408 P for trend
0.030 P for trend
0.380 P for trend
0.033 P for trend
0.060 P for trend
0.033 P for trend
0.408 P for trend
0.030
TC/HDL-C TG/HDL-C cLDL-C/HDL-CnHDL-C/HDL-C TC/HDL-C TG/HDL-C cLDL-C/HDL-CnHDL-C/HDL-C Q1 Q2 Q3 Q4
1.00 1.00 1.00 1.00
1.00 1.00 1.00 1.00
1.28 1.02 0.99
0.94
1.33 1.20 1.33
2.34
0.94
1.65
1.28
1.21 1.03 1.21
1.62
1.52 1.82
1.19 1.52 1.75
1.75 2.45
Q1 Q2 Q3 Q4
Q1 Q2 Q3 Q4 Q1 Q2 Q3 Q4 Q1 Q2 Q3 Q4 Q1 Q2 Q3 Q4 Q1 Q2 Q3 Q4 Q1 Q2 Q3 Q4
0.95
1.34
were < 0.05.
DISCUSSION
The major finding of this study was that evaluated lipid-related ratios were correlated with the prevalence of CKD stage 3 or more. This correlation was more significant in women than in men. TG/HDL-C was the only lipid-related ratio that was asso- ciated with the prevalence of CKD stage 3 or more in both men and women.
After adjusting for age, SBP, fasting plasma glucose, waist cir- cumfernece, BMI, smoking status, drinking status and exercise status, TG/HDL-C was shown to have the strongest association among the lipid-related ratios. For men, TG/HDL-C was the only lipid index that was associated with CKD stage 3 or more though the increasing trend between OR and quartile of TG/HDL-C had borderline significance (with a P value of 0.060). For women, while all of the lipid-related ratios have a significant increasing trend between quartile and OR, TG/HDL-C increased the most with Q3 and Q4 as compared with other lipid-related ratios. This supports not only existing study results that TG/HDL-C associ- ates with CKD independently (10), but also the hypothesis that TG/HDL-C is a better index than other lipid-related ratios.
TG/HDL-C has been identified as an indicator of insulin re- sistance and atherosclerosis in addition to their comorbidities (16). Increased TG/HDL-C may be associated with glomerulo- sclerosis, which is related to the development of CKD. Although the mechanism of CKD development is not clearly understood, CKD shares many risk factors with CVD. In addition to the tra- ditional risk factors of CKD including hypertension, diabetes mellitus and aging, chronic inflammation, oxidative stress and obesity are also indicators of renal dysfunction development (17, 18). On a cellular level, it has been shown that when mesan- gial cells are stimulated by being exposed to lipids, they secrete proinflammatory cytokines such as interleukin-6, tumor necro- sis factor-α, and transforming growth factor-β (19). Glomerular mesangial cells and vascular smooth muscle cells have molec- ular similarities, pointing to a common underlying pathophysi- ology in the development of atherosclerosis and glomeruloscle- rosis (20, 21).
Insulin resistance mediates diabetes, obesity, hypertension, lipid abnormalities and atherosclerosis, which are all risk fac- tors of CKD and CVD (22, 23). Insulin resistance is also a signifi- cant risk factor for the progression of renal dysfunction in non- diabetic subjects (24). TG/HDL-C is an indicator of insulin re- sistance and cardiovascular mortality (16). Increased levels of small and dense LDL-C particles, which are highly atherogenic, are associated with elevated TG/HDL-C (25, 26). These findings suggest that increased TG/HDL-C may result in glomeruloscle- rosis and CKD. The stronger relationship between CKD stage 3 or more and TG/HDL-C, compared with other lipid-related ra-
tios in this study, may be due to correlations with insulin resis- tance.
Regarding the relevance of associations of lipid-related ratios and CKD prevalence, this study showed stronger significance in women. This may be due to the MDRD equation which was used to calculate the eGFR. Since the MDRD equation multi- plies 0.7 in women, the prevalence of CKD stage 3 or more in men may be underestimated. As seen in this study, the preva- lence of CKD stage 3 or more was 4.7% in women, which was significantly lower than 7.7% in men. We expect to see stronger significance if the GFR estimating equation was developed for the Korean population.
To our knowledge, this is the first study to compare lipid- related ratios for prediction of CKD stage 3 or more. Although Schaeffner et al. (27). showed that elevated TC, nHDL-C, TC/
HDL-C, and reduced HDL-C were associated with renal dys- function in men and Kang et al. (10) showed that increased TG/
HDL-C has a correlation with CKD prevalence, they did not compare the lipid-related ratios in each sex for CKD prediction.
Furthermore, our study of 2007-2008 KNHANES participants, a national representative sample of Korean adults, and the num- ber of participants are larger than previous studies.
Some limitations should be considered when interpreting the findings of this study. First, the cross-sectional study design makes determining a causal relationship between lipid-related ratios and increased risk of CKD stage 3 or more difficult. Al- though increased TG/HDL-C induced by renal dysfunction can aggravate the progression of CKD through lipid nephrotoxicity (28), CKD itself can affect the metabolism of lipoprotein and change TG/HDL-C. Second, we defined CKD stage 3 or more as an eGFR less than 60 mL/min/1.73 m2 using the MDRD for- mula and there could be a difference with the accurate CKD stage 3 or more patient. The eGFR may not accurately estimate the actual GFR. Since the creatinine level was measured only once in KNHANES, the eGFR could reflect not a chronic status but a temporary decrease of renal function. Furthermore, since the MDRD formula was developed using study samples of pri- marily European descents, the formula may not apply as pre- cisely to Koreans. Third, we did not include individuals with pro- teinuria, which may constitute a phenotype of CKD. However, because urine samples collected in KNHANES were not the first voided morning urine, it is difficult to obtain a quantitative mea- surement and to control for selection bias. Finally, Friedewald’s formula was used to calculate LDL-C, hence serum LDL-C level was not measured in KNHANES. This inaccuracy of LDL-C/
HDL-C could have affected the results, particularly for patients with high TG levels.
In conclusion, it is suggested that TG/HDL-C is the only lip- id-related ratio significantly associated with CKD for both men and women in a sample of Korean adults. Other lipid-related ratios demonstrate less significance. Prospective studies inves-
tigating the causal relationship between lipid-related ratios and risk of CKD are needed to evaluate the value of lipid-related ra- tio control for CKD prevention.
ACKNOWLEDGMENTS
The 2007-2008 KNHANES was conducted by the Korea Minis- try of Health and Welfare. We thank all those who conducted 2007-2008 KNHANES as well as the civilians who participated in this survey.
REFERENCES
1. Kim S, Lim CS, Han DC, Kim GS, Chin HJ, Kim SJ, Cho WY, Kim YH, Kim YS. The prevalence of chronic kidney disease and the associated fac- tors to CKD in Urban Korea: a population-based cress-sectional epide- miologic study. J Korean Med Sci 2009; 24: S11-21.
2. Foley RN, Collins AJ. End-stage renal disease in the United States: an up- date from the United States renal data system. J Am Soc Nephrol 2007;
18: 2644-8.
3. Ganesh SK, Stack AG, Levin NW, Hulbert-Shearon T, Port FK. Associa- tion of elevated serum PO(4), Ca×PO(4) product, and parathyroid hor- mone with cardiac mortality risk in chronic hemodialysis patients. J Am Soc Nephrol 2001; 12: 2131-8.
4. Jungers P, Massy ZA, Nguyen Khoa T, Fumeron C, Labrunie M, Lacour B, Descamps-Latscha B, Man NK. Incidence and risk factors of athero- sclerotic cardiovascular accidents in predialysis chronic renal failure pa- tients: a prospective study. Nephrol Dial Transplant 1997; 12: 2597-602.
5. Rossouw JE, Lewis B, Rifkind BM. The value of lowering cholesterol after myocardial infarction. N Engl J Med 1990; 323: 1112-9.
6. Law MR, Wald NJ, Thompson SG. By how much and how quickly does reduction in serum cholesterol concentration lower risk of ischaemic heart disease? BMJ 1994; 308: 367-72.
7. Hsia SH, Pan D, Berookim P, Lee ML. A population-based, cross-section- al comparison of lipid-related indexes for symptoms of atherosclerotic disease. Am J Cardiol 2006; 98: 1047-52.
8. Pischon T, Girman CJ, Sacks FM, Rifai N, Stampfer MJ, Rimm EB. Non–
high-density lipoprotein cholesterol and apolipoprotein B in the predic- tion of coronary heart disease in men. Circulation 2005; 112: 3375-83.
9. Ridker PM, Rifai N, Cook NR, Bradwin G, Buring JE. Non–HDL choles- terol, apolipoproteins A-1 and B100, standard lipid measures, lipid ra- tios, and CRP as risk factors for cardiovascular disease in women. JAMA 2005; 294: 326-33.
10. Kang HT, Shim JY, Lee YJ, Lee JE, Linton JA, Kim JK, Lee HR. Association between the ratio of triglycerides to high-density lipoprotein cholesterol and chronic kidney disease in Korean adults: the 2005 Korean National Health and Nutrition Examination Survey. Kidney Blood Press Res 2011;
34: 173-9.
11. Expert Panel on Detection, Evaluation, and Treatment of High Blood Cholesterol in Adults. Executive summary of the third report of the Na- tional Cholesterol Education Program (NCEP) Expert Panel on Detec- tion, Evaluation, and Treatment of High Blood Cholesterol in Adults (Adult Treatment Panel III). JAMA 2001; 285: 2486-97.
12. Pearson TA, Laurora I, Chu H, Kafonek S. The lipid treatment assessment project (L-TAP): a multicenter survey to evaluate the percentages of dys- lipidemic patients receiving lipid-lowering therapy and achieving low- density lipoprotein cholesterol goals. Arch Intern Med 2000; 160: 459-67.
13. National Kidney Foundation. K/DOQI clinical practice guidelines for chronic kidney disease: evaluation, classification, and stratification. Am J Kidney Dis 2002; 39: S1-266.
14. Levey AS, Bosch JP, Lewis JB, Greene T, Rogers N, Roth D. A more accu- rate method to estimate glomerular filtration rate from serum creatinine:
a new prediction equation. Modification of Diet in Renal Disease Study Group. Ann Intern Med 1999; 130: 461-70.
15. Friedewald WT, Levy RI, Fredrickson DS. Estimation of the concentra- tion of low-density lipoprotein cholesterol in plasma, without use of the preparative ultracentrifuge. Clin Chem 1972; 18: 499-502.
16. McLaughlin T, Abbasi F, Cheal K, Chu J, Lamendola C, Reaven G. Use of metabolic markers to identify overweight individuals who are insulin resistant. Ann Intern Med 2003; 139: 802-9.
17. Fox ER, Benjamin EJ, Sarpong DF, Nagarajarao H, Taylor JK, Steffes MW, Salahudeen AK, Flessner MF, Akylbekova EL, Fox CS, et al. The relation of C-reactive protein to chronic kidney disease in African Americans: the Jackson Heart Study. BMC Nephrol 2010; 11: 1.
18. Yoon YS, Park HS, Yun KE, Kim SB. Obesity and metabolic syndrome- related chronic kidney disease in nondiabetic, nonhypertensive adults.
Metabolism 2009; 58: 1737-42.
19. Keane WF, O’Donnell MP, Kasiske BL, Kim Y. Oxidative modification of low-density lipoproteins by mesangial cells. J Am Soc Nephrol 1993; 4:
187-94.
20. Klahr S, Schreiner G, Ichikawa I. The progression of renal disease. N Engl J Med 1988; 318: 1657-66.
21. Diamond JR, Karnovsky MJ. Focal and segmental glomerulosclerosis:
analogies to atherosclerosis. Kidney Int 1988; 33: 917-24.
22. DeFronzo RA, Ferrannini E. Insulin resistance. A multifaceted syndrome responsible for NIDDM, obesity, hypertension, dyslipidemia, and ath- erosclerotic cardiovascular disease. Diabetes Care 1991; 14: 173-94.
23. Cusumano AM, Bodkin NL, Hansen BC, Iotti R, Owens J, Klotman PE, Kopp JB. Glomerular hypertrophy is associated with hyperinsulinemia and precedes overt diabetes in aging rhesus monkeys. Am J Kidney Dis 2002; 40: 1075-85.
24. Kobayashi H, Tokudome G, Hara Y, Sugano N, Endo S, Suetsugu Y, Kuriyama S, Hosoya T. Insulin resistance is a risk factor for the progres- sion of chronic kidney disease. Clin Nephrol 2009; 71: 643-51.
25. Maruyama C, Imamura K, Teramoto T. Assessment of LDL particle size by triglyceride/HDL-cholesterol ratio in non-diabetic, healthy subjects without prominent hyperlipidemia. J Atheroscler Thromb 2003; 10:
186-91.
26. Hanak V, Munoz J, Teague J, Stanley A Jr, Bittner V. Accuracy of the triglyc- eride to high-density lipoprotein cholesterol ratio for prediction of the low-density lipoprotein phenotype B. Am J Cardiol 2004; 94: 219-22.
27. Schaeffner ES, Kurth T, Curhan GC, Glynn RJ, Rexrode KM, Baigent C, Buring JE, Gaziano JM. Cholesterol and the risk of renal dysfunction in apparently healthy men. J Am Soc Nephrol 2003; 14: 2084-91.
28. Moorhead JF, Chan MK, El-Nahas M, Varghese Z. Lipid nephrotoxicity in chronic progressive glomerular and tubulo-interstitial disease. Lancet 1982; 2: 1309-11.