INTRODUCTION
Breast cancer is a biologically heterogeneous disease with diverse natural history and different clinical behaviors. As a result, there has been an increasing shift toward a personal- ized approach for breast cancer management. To provide the right treatment based on the patient’s underlying tumor biol- ogy, tumor biomarkers such as estrogen receptor (ER), pro- gesterone receptor (PR), and human epidermal growth factor receptor 2 (HER2) are routinely used to determine the opti- mal and most effective therapy. Expression of hormone recep- tors is observed in approximately 70% of invasive breast can-
cers and acts as a strong predictive biomarker. Patients ex- pressing ER and/or PR may probably benefit from endocrine therapy [1], which is highly effective and less toxic than che- motherapy. Patients with tumors containing as few as 1% in- vasive cells are known to gain clinical benefits from endocrine therapy [2]. The guidelines of the American Society of Clin- ical Oncology/College of American Pathologists (ASCO/
CAP) recommend a cutoff of >1% ER/PR-positive tumor cells to distinguish “positive” from “negative” cases [3]. Therefore, careful examination and accurate assessment of immunohis- tochemistry (IHC) positivity is absolutely vital to avoid miss- ing potentially significant focal staining.
The HER2 (also referred to as ERBB2) gene, located at chro- mosome 17q12-21, encodes a transmembrane receptor tyro- sine kinase of the human epidermal growth factor receptor family [4] and is overexpressed in approximately 15% to 20%
of breast cancers [5]. HER2 (also called epidermal growth fac- tor receptor ErbB-2) signaling pathway promotes cell prolifer- ation and survival, and HER2 overexpression is associated
NanoString nCounter® Approach in Breast Cancer: A Comparative Analysis with Quantitative Real-Time Polymerase Chain Reaction, In Situ
Hybridization, and Immunohistochemistry
Jiyeon Hyeon, Soo Youn Cho, Min Eui Hong1, So Young Kang, Ingu Do2, Young Hyuck Im3, Eun Yoon Cho
Department of Pathology and Translational Genomics, Samsung Medical Center, Sungkyunkwan University School of Medicine, Seoul; 1Department of Pathology, Gangnam Sacred Heart Hospital, Hallym University College of Medicine, Seoul; 2Department of Pathology, Kangbuk Samsung Hospital, Sungkyunkwan University School of Medicine, Seoul; 3Division of Hematology-Oncology, Department of Internal Medicine, Samsung Medical Center, Sungkyunkwan University School of Medicine, Seoul, Korea
ORIGINAL ARTICLE
Purpose: Accurate testing for estrogen receptor (ER), progester- one receptor (PR), and human epidermal growth factor receptor 2 (HER2) is essential for breast cancer treatment. At present, im- munohistochemistry (IHC)/florescence in situ hybridization (FISH) are widely accepted as the standard testing methods. To investi- gate the value of NanoString nCounter®, we performed its com- parative analysis with IHC/FISH and real-time quantitative re- verse transcription polymerase chain reaction (qRT-PCR) for the assessment of ER, PR, and HER2. Methods: Data on IHC/FISH results for ER, PR, and HER2 in 240 patients from a single tertiary hospital in Korea were collected and compared with NanoString nCounter® and qRT-PCR results at a single institution. Results:
Expression levels for each gene using NanoString nCounter®
showed good correlation with the corresponding data for protein expression by IHC (p<0.001) and gene amplification status for HER2 (p<0.001). Comparisons between gene expression and IHC data showed good overall agreement with a high area under the curve (AUC) for ESR1/ER (AUC=0.939), PgR/PR (AUC=
0.796), and HER2/HER2 (AUC=0.989) (p<0.001). Conclusion:
The quantification of ER, PgR, and HER2 mRNA expression with NanoString nCounter® may be a viable alternative to conven- tional IHC/FISH methods.
Key Words: Breast neoplasms, ErbB-2, Gene expression, Immunohistochemistry, In situ hybridization
Correspondence to: Eun Yoon Cho
Department of Pathology and Translational Genomics, Samsung Medical Center, Sungkyunkwan University School of Medicine, 81 Irwon-ro, Gangnam-gu, Seoul 06351, Korea
Tel: +82-2-3410-2796, Fax: +82-2-3410-0025 E-mail: [email protected]
Received: June 29, 2017 Accepted: August 9, 2017
Cancer
with an aggressive tumor phenotype and reduced survival [6].
Patients with HER2 amplification usually overexpress HER2 protein and display worse prognosis than patients with nor- mal HER2 levels [4,7]. Trastuzumab, a monoclonal antibody against the extracellular domain of HER2 protein, is the first HER2-targeted agent that showed efficacy as a single agent or in combination with chemotherapy in patients with HER2- positive invasive breast cancer [8-10]. Other targeted agents such as lapatinib, a reversible dual HER1/2 tyrosine kinase in- hibitor, and pertuzumab were also developed and have im- proved the prognosis of patients with HER2-positive breast cancer [11,12]. In recent years, treatment with trastuzumab has become the standard therapy for patients with HER2- positive breast cancer [13] and HER2 testing is recommended at the time of diagnosis for all breast cancers [14]. Although trastuzumab is effective, it can be toxic in some patients;
therefore, accurate assessment of HER2 overexpression is mandatory to identify patients who may benefit from this tar- geted therapy.
In 2013, ASCO/CAP recommended two diagnostic meth- ods for the determination of HER2 status: IHC and in situ hybridization (ISH). IHC uses a protein antibody to detect HER2 protein, whereas ISH employs a DNA probe with a flu- orescent, chromogenic, or silver detection system to deter- mine the number of HER2 gene copies [15,16]. Although the ASCO/CAP guidelines provide relatively clear instructions for the assessment of HER2 status, inter-laboratory or inter-ob- server variability may occur owing to the technical issues or difficulty in the interpretation of test results. Interpretations of the results of IHC or ISH for HER2 status by pathologists may show inter- or intra-observer differences, as both methods in- volve semi-quantitative or qualitative analyses. Therefore, quantitative methods are needed for the determination of HER2 expression level to achieve good agreement with the HER2 status among pathologists.
In this direction, the possibility of using quantitative real- time reverse transcription polymerase chain reaction (qRT- PCR) as an ancillary test to complement the more subjective methods of IHC and fluorescence in situ hybridization (FISH) was raised. Several studies have reported the performance of qRT-PCR to determine HER2 status [17-19]. These studies concluded that molecular approaches such as qRT-PCR are powerful and reliable quantitative methods for HER2 status assessment and may complement IHC or FISH for optimal patient treatment. In particular, in the era of personalized mo- lecular target therapy, a high-throughput and cost-effective screening tool such as qRT-PCR becomes even more impor- tant for deciding cancer treatment strategies. An optimal assay for molecular studies should be sensitive and specific as well
as easy to perform, readily interpretable, and reliable. qRT- PCR is relatively easy to perform and cost-effective, but the requirement for reverse transcription and PCR amplification may lead to potential error or bias in target gene assessment.
NanoString nCounter® gene expression system is a recently developed RNA-based technology that allows digital quantifi- cation of multiplexed target molecules through the use of color- coded barcodes. It can provide discrete counts of target mRNA transcripts using a small amount of total RNA without the need for amplification [20].
This study was performed to assess the usefulness of NanoString nCounter® gene expression system for the quanti- fication of mRNA expression in archived formalin-fixed, par- affin-embedded (FFPE) invasive ductal carcinoma samples as well as to correlate the mRNA expression level of ER, PR, and HER2 by NanoString nCounter® gene expression system with the results of IHC/FISH and qRT-PCR.
METHODS
Patients and samples
A total of 240 cases of surgically resected invasive breast cancer from 1995 to 2012 were retrospectively retrieved from the computerized records system at Samsung Medical Center.
Among them, 45 cases were HER2-positive breast cancer pa- tients treated with adjuvant trastuzumab, 143 cases included triple-negative breast cancer, and 52 cases were ER/PR-posi- tive breast cancer. All patients provided written informed consent.
Two pathologists (E.Y.C. and J.H.) reviewed the pathologic findings to determine the following variables: histological subtype, tumor size, nuclear grade, histological grade according to the modified Bloom-Richardson grading system, presence of lymphovascular invasion, and immunohistochemical pro- files of ER, PR, Ki-67, and HER2 without the knowledge of NanoString, qRT-PCR, and HER2 FISH results.
The Institutional Review Board of Samsung Medical Cen- ter, Seoul, Korea approved our study protocol and waived the need for informed consent, as the study was conducted using archival tissues with retrospective clinical data (IRB number:
2017-07-088). All investigations were conducted according to the principles of the Declaration of Helsinki.
Immunohis tochemistry and fluorescence in situ hybridization We determined the IHC positivity for ER and PR protein according to ASCO/CAP guidelines of a threshold of 1% and by Allred score [21] using antibodies specific for ER (clone 6F11; Novocastra, Newcastle upon Tyne, UK) and PR (clone 16; Novocastra) [3]. HER2 status was evaluated using a specif-
ic antibody (HercepTest; Dako, Glostrup, Denmark) and/or by FISH. HER2 expression was also defined according to ASCO/CAP guidelines [15]. IHC grades of 0 and 1 for HER2 were defined as a negative result, while grade 3 was recorded as a positive result. Amplification of HER2 was confirmed us- ing FISH, if a sample was rated 2+ by IHC.
FISH was performed using a dual-color DNA-specific probe kit from PathVisionTM (Vysis LSI® HER2 SpectrumOrangeTM and CEP17 SpectrumGreenTM; Abbott Moleclular, Des Plains, USA) in cases with equivocal HER2 IHC results (2+). A total of 50 nuclei per sample were evaluated under a fluorescence microscope (Zeiss Axioskop, Oberkochen, Germany) using filter sets recommended by Vysis (4´,6-diamidino-2-phenylindole [DAPI]/Spectrum Orange dual bandpass, DAPI/Spectrum Green dual bandpass). All overlapping nuclei were excluded.
The gene copy number ratio was determined according to ASCO/CAP guidelines [15]. After assessment of expression profiling by IHC/FISH, cases were classified into molecular subtypes [22]. In particular, ER or PR+/HER2− tumors with low proliferation index were considered luminal A, high-grade ER or PR+/HER2− tumors and ER or PR+/HER2+ tumors were considered luminal B, whereas ER and PR−/HER2+ tumors were considered HER2-enriched subtype. Triple-negative tu- mors were considered basal-like [23].
RNA extraction
All available hematoxylin and eosin-stained slides from FFPE primary breast tumor tissue were reviewed. Areas con- taining representative invasive tumor were carefully marked on the stained slide and microdissected from 2 to 4 paired 4-μm-thick unstained FFPE sections with a pointed surgical blade. Non-tumor areas were removed by manual microdis- section. Total RNA was extracted using the high pure RNA paraffin kit (Roche Diagnostic, Mannheim, Germany) ac- cording to the manufacturer’s instruction. The yield and puri- ty of RNA was evaluated using the NanoDrop ND-1000 spec- trophotometer (NanoDrop Technologies, Rockland, USA).
All samples had a total RNA concentration greater than 50 ng/μL and were, therefore, included in the analysis.
Real-time quantitative reverse transcription polymerase chain reaction
RNA from archival specimens was measured by real-time qRT-PCR using the TaqMan gene expression assays (Applied Biosystems Inc., Foster City, USA) according to the manufac- turer’s instructions. Glyceraldehyde 3-phosphate dehydrogenase (GAPDH) gene was used as an endogenous control (Applied Biosystems; assay ID, HS99999905_m1). RT-PCR was con- ducted using the high capacity cDNA reverse transcription kit
(Applied Biosystems) according to the manufacturer’s instruc- tions. PCR amplification of exons 20 and 21 of HER2 was per- formed using the oligonucleotide primers 5´-GGAGCTGAG GAAGGTGAAGGT-3´ (forward) and 5´-GATCCAGAT GCCCTTGTAGACTGT-3´ (reverse). After incubation for 10 minutes at 95°C, amplification was performed in a thermocycler (Applied Biosystems) with 40 cycles of denaturation at 95°C for 30 seconds, annealing at 60°C for 30 seconds, extension at 72°C for 60 seconds, and a final extension at 72°C for 10 min- utes. Each complementary DNA sample was analyzed in trip- licates with ABI PRISM 7500HT fast real-time PCR (Applied Biosystems). CT, the fractional cycle number at which the amount of amplified target reached a fixed threshold, was determined and the mRNA expression level of HER2 was measured using the 2−∆∆Ct(∆∆Ct=∆Ctarget gene−∆CGAPDH) method.
NanoString nCounter® system assays
The nCounter®assay was performed using the NanoString nCounter® Analysis System (NanoString Technologies, Seattle, USA). Hybridization reactions were performed according to the manufacturer’s instructions. An nCounter® CodeSet (NanoString Technologies) containing a biotinylated capture probe for target genes and six housekeeping genes (CLTC, GAPDH, GUSP, HPRT1, PGK1, and TUBB) and reporter probes attached to color-barcode tags according to the nCounter® CodeSet design was hybridized to 200 ng of total RNA for 18 hours at 65°C. Samples were processed using an automated nCounter® Prep Station. Hybridized samples were purified and immobilized in a sample cartridge for data collection, fol- lowed by the quantification of target mRNA in each sample using the nCounter® Digital Analyzer. For each reaction, 600 fields of view were counted. Quantified expression data were analyzed using nSolver analysis software (NanoString). The resulting counts were normalized to the average counts for all control spikes in each sample. After performing image quality control using a predefined cutoff value, we excluded the out- lier samples using a normalization factor based on the sum of positive control counts greater than 3-fold. The counts of the probes were then normalized using the geometric mean of the six housekeeping genes (CLTC, GAPDH, GUSP, HPRT1, PGK1, and TUBB). Data from all 240 patients with breast can- cer were included in the statistical analysis.
Statistical analysis
We used the Spearman rank correlation coefficient test for the comparison of (1) HER2 gene expression level between NanoString and qRT-PCR and (2) HER2 gene expression level by NanoString and HER2 average gene copy number by FISH.
Jonckheere-Terpstra test and Cohen kappa statistic were used
to compare the NanoString or qRT-PCR results for HER2 ex- pression with HER2 IHC results. The correlation between ESR1 and PgR gene expression by NanoString and IHC pro- files for ER and PR protein expression was evaluated by the Mann-Whitney test and Cohen kappa statistic. A value of p<
0.05 was considered statistically significant. Statistical analyses were performed using SPSS software version 18.0 (SPSS Inc., Chicago, USA). To set the cutoff value (low vs. intermediate/
high) of the NanoString counts for specific genes (ESR1, PgR, and HER2), receiver operator characteristic (ROC) curves were generated by dichotomizing IHC data. ROC curves were ana- lyzed using SPSS and MedCalc software (MedCalc Software, Mariakerke, Belgium).
RESULTS
Clinicopathological characteristics of 240 breast cancer cases The general clinicopathological characteristics of 240 breast cancer patients are presented in Table 1. The median age at di- agnosis was 46 years (range, 24–74 years). Invasive ductal car- cinoma was found in 91.3% of cases and lymph node involve- ment was present in 42.9% of cases. High histological and nu- clear grades were found in 155 patients (64.6%). Of 240 cases, 37 (15.4%) and 17 (7.1%) showed HER2 positive (3+) and equivocal (2+) results on IHC, respectively. ER-positive and PR-positive tumors were noted in 57 (23.8%) and 53 (22.1%) cases, respectively. According to the results of IHC/FISH pro- file for 240 cases, 48 cases were ER or PR(+)/HER2(−), 21 cas- es were ER or PR(+)/HER2(+), 24 cases were ER or PR(−)/
HER2(+), and 143 cases were ER or PR(−)/HER2(−). Two of 240 cases were ER or PR(−) but showed HER2 equivocal re- sults in both IHC and FISH. Two of 240 cases were ER or PR(+) but failed to show adequate results for HER2 FISH.
Comparison between NanoString and IHC/FISH for ER, PR, and HER2 expression
To evaluate the concordance of NanoString nCounter® and conventional methods for determining the molecular sub- group of breast cancer, we compared the NanoString gene ex- pression level for ESR1, PgR, and HER2 with IHC results for ER, PR, and HER2 proteins and FISH results for HER2 gene.
The expression level of each gene using NanoString nCounter® showed a good correlation with levels of the corresponding protein biomarkers by IHC (p<0.001) (Figure 1).
The samples with ER-negative results on IHC showed nCounter® levels from 5.03 to 491.01 (median, 28.11), while those with ER-positive results on IHC displayed nCounter® levels from 10.58 to 4,594.15 (median, 426.8).
The samples with PR-negative results on IHC showed
nCounter® levels from 2.35 to 219.32 (median, 18.14), while those with PR-positive results on IHC displayed nCounter® levels from 5.66 to 4,190.71 (median, 74.02). A statistically significant difference was observed between mean nCounter® levels of negative and positive ER/PR IHC groups (p<0.001) (Figure 1A and 1D, 1B and 1E, respectively).
The samples with HER2 IHC score 0 showed nCounter® levels from 147.18 to 2,302.25 (median, 508.97) and the sam- ples with HER2 IHC score 1 showed nCounter® levels from 306.42 to 4,293.16 (median, 1,077.85). The equivocal cases with HER2 IHC (2+) had nCounter® levels ranging from 1,207.76 to 10,127.69 (median, 1,948.67), while the positive Table 1. Clinicopathologic characteristics of 240 specimens
Characteristic No. of patients (%)
Age at the surgery (yr)* 46 (24–74) Tumor size (cm)
≤2 92 (38.3)
>2, ≤5 143 (59.6)
>5 5 (2.1)
Tumor type
Ductal 220 (91.3)
Lobular 2 (0.8)
Others 18 (7.5)
Lymph node status
Negative 137 (57.1)
Isolated tumor cells 1 (0.4)
1–3 node positive 67 (27.9)
4–9 node positive 21 (8.8)
≥10 node positive 14 (5.8)
Histological grade
1 4 (1.7)
2 68 (28.3)
3 155 (64.6)
Not applicable 13 (5.4)
ER status (IHC)
Positive 57 (23.8)
Negative 183 (76.3)
PR status (IHC)
Positive 53 (22.1)
Negative 187 (77.9)
HER2 status (IHC)
0 152 (63.3)
1+ 34 (14.2)
Equivocal (2+) 17 (7.1)
Positive (3+) 37 (15.4)
HER2 status (FISH, n=25)
Inadequate 2 (8.0)
Negative 9 (36.0)
Equivocal 3 (12.0)
Positive 11 (44.0)
ER=estrogen receptor; IHC=immunohistochemistry; PR=progesterone re- ceptor; HER2=human epidermal growth factor receptor 2; FISH=fluorescence in situ hybridization.
*Median (range).
cases with HER2 IHC (3+) showed nCounter® levels from 2,229.67 to 72,436.31 (median, 11,666.14). A statistically sig- nificant difference was observed between mean nCounter® levels of negative, equivocal, and positive HER2 IHC groups (p<0.001) (Figure 1C, F).
The gene expression level for HER2 using NanoString nCounter® showed a good correlation with the gene amplifi- cation status for HER2 (p<0.001) (Figure 2A-C).
Comparison between HER2 gene expression by qRT-PCR and HER2 expression by IHC/FISH
We evaluated the correlation between HER2 gene expres- sion level by qRT-PCR, HER2 IHC results, and FISH data.
The gene expression level (relative quantitation [RQ]) for HER2 using qRT-PCR showed a good correlation with HER2 protein expression results with IHC (p<0.001, box plot not shown) but not with HER2 gene amplification status with FISH (p=0.124) (Figure 2D-F).
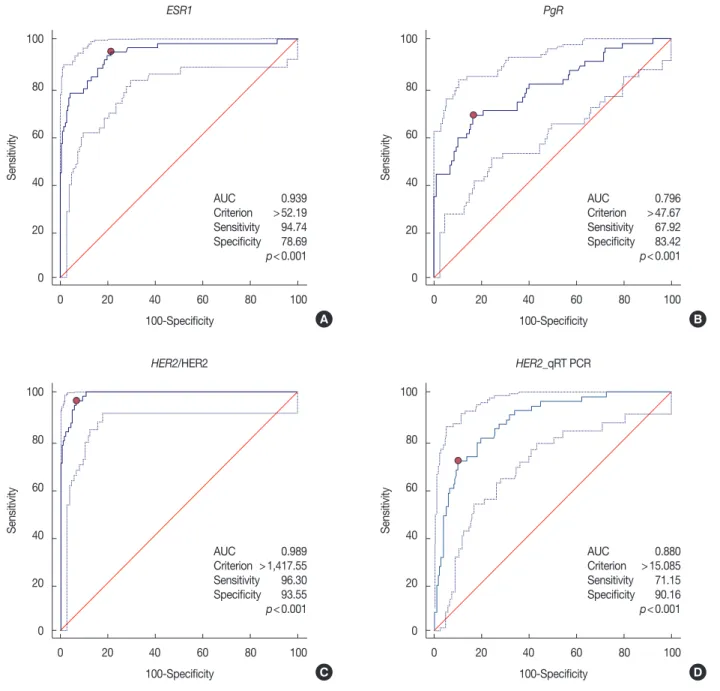
Estimation of cutoff values for gene expression using ROC curves
Comparisons between gene expression and IHC data showed good overall agreement with a high area under the curve (AUC) for ESR1/ER (AUC=0.939), PgR/PR (AUC=
0.796), and HER2/HER2 (AUC=0.989) (p<0.001). The cut- off values of each gene, estimated with consideration of sensi- tivity and specificity for the detection of specific genes, are shown in each graph (Figure 3).
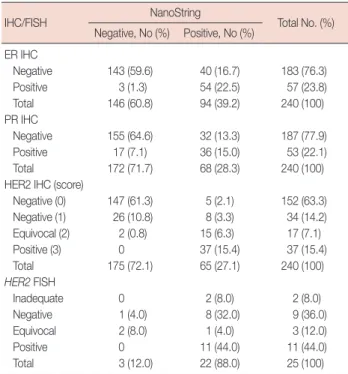
Concordance of NanoString level and IHC/FISH expression We compared the results between NanoString level and IHC/FISH for ER, PR, and HER2 expression (Table 2). Using NanoString cutoff for ER and PgR expression, we found that the concordance rate of ER and PR expression status by IHC and NanoString method was 82.1% and 79.6%, respectively (Cohen kappa=0.596 and 0.461, respectively).
Using NanoString cutoff for HER2 expression, we found that the concordance rate of HER2 expression status by IHC and NanoString method was 94.2% when we excluded the cases with equivocal HER2 expression results for IHC (Cohen kappa=0.833).
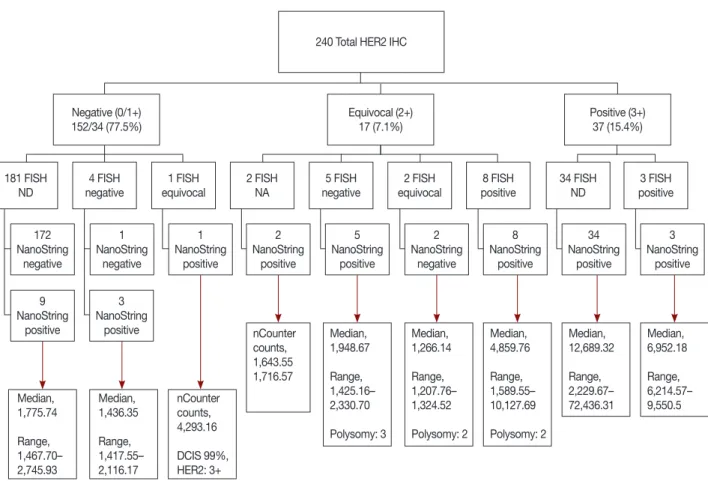
Comparison between the results of IHC, FISH, and NanoString counts for HER2
The general distribution of HER2 for 240 specimens is pre- sented in Figure 4. FISH analysis was performed for 25 cases, including all 17 equivocal cases by IHC and eight controls that had relatively ambiguous NanoString counts in comparison Figure 1. Gene expression levels for ESR1, PgR, and HER2 by NanoString in comparison with corresponding protein biomarkers (immunohistochem- istry [IHC]). Gene expression levels for ESR1 (A, D), PgR (B, E), and HER2 (C, F) using NanoString nCounter® had good correlation with the corre- sponding protein biomarkers (IHC) (p<0.001).
ER=estrogen receptor; PR=progesterone receptor; HER2=human epidermal growth factor receptor 2.
5,000 4,000 3,000 2,000 1,000 0
1,200 1,000 800 600 400 200 0
1,200 1,000 800 600 400 200 0 5,000 4,000 3,000 2,000 1,000 0
80,000
60,000
40,000
20,000
0
10,000
15,000
10,000
5,000
0 Negative Positive
0 2 3 4 5 6 7 8 0 2 3 4 5 6 7 8
Negative Positive Negative (0) Negative (1) Equivocal Positive
Negative (0) Negative (1) Equivocal (2) Positive (3) Immunoreactivity for ER
IHC score for ER IHC score for PR
Immunoreactivity for PR Immunoreactivity for HER2
IHC score for HER2
NanoString level for ESR1Mean level of NanoString counts for ESR1 Mean level of NanoString counts for PgR Mean level of NanoString counts for HER2
NanoString level for PgR NanoString level for HER2
A
D E
B C
F
*
* *
***
* *
***
* *
p<0.001 p<0.001 p<0.001
Figure 2. Gene expression levels for HER2 by NanoString (A-C) and quantitative real-time reverse transcriptase polymerase chain reaction (qRT-PCR) (D-F) in comparison with the gene amplification status by fluorescence in situ hybridization (FISH). Gene expression levels for HER2 using NanoString nCounter® had good correlation with the gene amplification status by FISH (p<0.001).
HER2=human epidermal growth factor receptor 2; RQ=relative quantitation.
12,000 10,000 8,000 6,000 4,000 2,000 0
140 120 100 80 60 40 20 0
12,000 10,000 8,000 6,000 4,000 2,000 0
12,000 10,000 8,000 6,000 4,000 2,000 0 Negative Equivocal Positive
Negative Equivocal Positive
0 1 2 3 4 5 6
0 1 2 3 4 5 6
0 2 4 6 8 10 12
0 2 4 6 8 10 12 FISH results for HER2
FISH results for HER2
Ratio of HER2/CEP17
Ratio of HER2/CEP17
Average HER2 gene copy number
Average HER2 gene copy number
NanoString level for HER2RQ (qRT-PCR) for HER2 NanoString level for HER2RQ (qRT-PCR) for HER2 RQ (qRT-PCR) for HER2NanoString level for HER2
A
D
B
E
C
F 140
120 100 80 60 40 20 0
140 120 100 80 60 40 20 0
with other cases. Adequate results were obtained for 23 cases.
Two of the equivocal cases failed to produce appropriate FISH results due to poor sample condition.
The concordance rate of HER2 expression status by IHC and NanoString method was 94.2% and the discordance rate was 5.8% when we excluded the cases with equivocal HER2 expression results for IHC.
One case showed HER2 negativity (1+) in invasive cancer but HER2 positivity in ductal carcinoma in situ (DCIS) by IHC. In the invasive area, FISH result was equivocal and the NanoString count was 4,293.16.
Among the 17 cases that were equivocal for HER2 by IHC, five showed negative FISH results and their median NanoString count was 1,948.67 (range, 1,425.16–2,330.70). All these cases were considered positive by NanoString level. Two of the 17 cases showed equivocal results by FISH and their median NanoString count was 1,266.14 (range, 1,207.76–1,324.52).
All these cases were considered negative by NanoString level.
Eight of the 17 equivocal HER2 cases by IHC showed positive FISH results and had a median NanoString count of 4,859.76 (range, 1,589.55–10,127.69). All these cases were considered positive by NanoString level. Two cases of equivocal HER2 by IHC failed to yield adequate FISH results. Therefore, seven of
Table 2. Concordance of NanoString level and IHC/FISH expression
IHC/FISH NanoString
Total No. (%) Negative, No (%) Positive, No (%)
ER IHC
Negative 143 (59.6) 40 (16.7) 183 (76.3) Positive 3 (1.3) 54 (22.5) 57 (23.8) Total 146 (60.8) 94 (39.2) 240 (100) PR IHC
Negative 155 (64.6) 32 (13.3) 187 (77.9) Positive 17 (7.1) 36 (15.0) 53 (22.1) Total 172 (71.7) 68 (28.3) 240 (100) HER2 IHC (score)
Negative (0) 147 (61.3) 5 (2.1) 152 (63.3) Negative (1) 26 (10.8) 8 (3.3) 34 (14.2) Equivocal (2) 2 (0.8) 15 (6.3) 17 (7.1) Positive (3) 0 37 (15.4) 37 (15.4) Total 175 (72.1) 65 (27.1) 240 (100) HER2 FISH
Inadequate 0 2 (8.0) 2 (8.0)
Negative 1 (4.0) 8 (32.0) 9 (36.0)
Equivocal 2 (8.0) 1 (4.0) 3 (12.0)
Positive 0 11 (44.0) 11 (44.0)
Total 3 (12.0) 22 (88.0) 25 (100)
IHC =immunohistochemistry; FISH =fluorescence in situ hybridization;
ER=estrogen receptor; PR=progesterone receptor; HER2=human epider- mal growth factor receptor 2.
15 cases (46.7%) that were HER2 equivocal by IHC showed discrepancy between NanoString and FISH results.
Of the 15 HER2 equivocal cases by IHC that had FISH re- sults, seven cases (46.7%) revealed an elevated CEP17 count, indicative of polysomy. Five of these seven cases that showed FISH negative/equivocal results had an elevated CEP17 count.
The median HER2 and CEP17 copy numbers of FISH-nega-
Figure 3. The estimation of overall agreements for gene expression levels compared with immunohistochemistry (IHC) results by receiver operator characteristic curve. Comparisons between the gene expression by NanoString and IHC data gave good overall agreement with a high area under the curve (AUC) for ESR1/ER (AUC=0.939) (A), PgR/PR (AUC=0.796) (B), and HER2/HER2 (AUC=0.989) (C) (p<0.001, respectively). The compari- son between the gene expression by quantitative real-time reverse transcriptase polymerase chain reaction (qRT-PCR) and IHC data gave also good overall agreement with a high AUC for HER2/HER2 (AUC=0.880) (D) (p<0.001).
ER=estrogen receptor; PR=progesterone receptor; HER2=human epidermal growth factor receptor 2.
100
80
60
40
20
0
100
80
60
40
20
0
100
80
60
40
20
0
100
80
60
40
20
0 0 20 40 60 80 100
0 20 40 60 80 100
0 20 40 60 80 100
0 20 40 60 80 100 100-Specificity
100-Specificity
AUC 0.939 Criterion >52.19 Sensitivity 94.74 Specificity 78.69 p<0.001
AUC 0.989 Criterion >1,417.55 Sensitivity 96.30 Specificity 93.55 p<0.001
AUC 0.796 Criterion >47.67 Sensitivity 67.92 Specificity 83.42 p<0.001
AUC 0.880 Criterion >15.085 Sensitivity 71.15 Specificity 90.16 p<0.001 100-Specificity
100-Specificity ESR1
HER2/HER2
PgR
HER2_qRT PCR
SensitivitySensitivity SensitivitySensitivity
A
C
B
D
tive cases (n=5) were 3.26 (range, 2.84–3.38) and 3.1 (range, 2.46–3.78), respectively, while the median HER2 copy number of FISH-equivocal cases (n=2) was 4.43 (range, 4.22–4.64).
All cases of CEP17 copy number of FISH-equivocal cases were 4.08. Among the eight HER2 equivocal cases on IHC with FISH-positive results, two showed elevated CEP17 count with median HER2 and CEP17 copy numbers of 9.09 (range,
Figure 4. The general distribution of HER2 results of 240 specimens by FISH, IHC, and NanoString.
HER2=human epidermal growth factor receptor 2; IHC=immunohistochemistry; FISH=fluorescence in situ hybridization; ND=not done; NA=data not applicable due to test failure; DCIS=ductal carcinoma in situ.
240 Total HER2 IHC
Negative (0/1+) 152/34 (77.5%)
181 FISH ND
172 NanoString
negative
Median, 1,775.74 Range, 1,467.70–
2,745.93
Median, 1,436.35 Range, 1,417.55–
2,116.17
nCounter counts, 4,293.16 DCIS 99%, HER2: 3+
1 NanoString
negative
2 NanoString
negative 1
NanoString positive
8 NanoString
positive
34 NanoString
positive
3 NanoString
positive 2
NanoString positive
5 NanoString
positive 4 FISH
negative
1 FISH equivocal
2 FISH NA
5 FISH negative
2 FISH equivocal
8 FISH positive
34 FISH ND
3 FISH positive Equivocal (2+)
17 (7.1%) Positive (3+)
37 (15.4%)
9 NanoString
positive
3 NanoString
positive nCounter
counts, 1,643.55 1,716.57
Median, 1,948.67 Range, 1,425.16–
2,330.70 Polysomy: 3
Median, 1,266.14 Range, 1,207.76–
1,324.52 Polysomy: 2
Median, 4,859.76 Range, 1,589.55–
10,127.69 Polysomy: 2
Median, 12,689.32 Range, 2,229.67–
72,436.31
Median, 6,952.18 Range, 6,214.57–
9,550.5
Figure 5. Correlation with NanoString counts for HER2 gene and relative quantitation (RQ) levels generated by quantitative real-time reverse transcrip- tase polymerase chain reaction (qRT-PCR). (A) NanoString counts for HER2 gene showed high correlation with RQ levels generated by qRT-PCR (p<0.001). (B) Area under the curve of NanoString method is bigger than that of qRT-PCR method. The pairwise comparison of two receiver operator characteristic curves showed the statistically significant difference (p<0.001).
HER2=human epidermal growth factor receptor 2.
800
600
400
200
0
100
80
60
40
20
0
0 20,000 40,000 60,000 80,000 0 20 40 60 80 100
NanoString level for HER2
HER2_NanoString HER2_qRT PCR
100-Specificity
RQ value (qRT-PCR) for HER2 Sensitivity
A B
5.30–11.60) and 4.89 (range, 1.20–6.26), respectively.
Comparison of NanoString and qRT-PCR for HER2 gene expression
We performed comparison between the sensitivity and specificity of NanoString nCounter® and qRT-PCR for gene expression level. NanoString counts for the HER2 gene showed high correlation with RQ levels generated by qRT- PCR (p<0.001) (Figure 5A). Although both methods showed good overall agreement between gene expression and IHC data with a high AUC for HER2/HER2 (AUC of 0.989 for NanoString and 0.880 for qRT-PCR; p<0.001 for each meth- od), the AUC of the NanoString method was greater than that of qRT-PCR. Pairwise comparison of the two ROC curves showed a statistically significant difference (p<0.001) (Figure 5B). As AUC is a measure of the overall value of a diagnostic test, these data indicate that NanoString has better overall per- formance as a diagnostic test than qRT-PCR.
DISCUSSION
In this study, we described an ancillary method for the de- tection of the molecular status of invasive breast cancer using NanoString-based gene expression technology. This method relies on the direct digital detection of gene expression. The main goal of this study was to compare the results of NanoString- based gene expression with those of the conventional IHC/
FISH methods for the assessment of protein/mRNA expres- sion. We specifically focused on the three most common mo- lecular markers in breast cancer: ER, PR, and HER2. These three biomarkers are regarded as targets for specific treatment in breast cancer and have important value in molecular classi- fication with respect to the survival rate of patients with breast cancer [23].
At present, the combination of IHC/FISH is routinely used for the detection of ER, PR, and HER2 status. We evaluated the accuracy of NanoString-based assay by comparing it with the conventional biomarker detection method. The sensitivity and specificity of NanoString-based assay as compared with that of IHC was 94.7% vs. 78.7% for ER, 67.9% vs. 83.4% for PR, and 96.3% vs. 93.6% for HER2. Although we have com- pared these methods using only three biomarkers, the sensi- tivity and specificity of NanoString-based assay appears to be significantly reliable [24,25]. However, some discrepancies were reported in the ER/PR protein expression status by IHC and the gene expression status by NanoString, which may be associated with the presence of the normal breast tissue adja- cent to the tumor. Therefore, careful microdissection of inva- sive cancer is essential for the evaluation of ER/PgR gene status
using NanoString method. The discordance rate of HER2 lev- el was low, as HER2 protein overexpression was found only in tumor tissues. Some discrepancy in HER2 protein expression and gene expression was also observed in a relatively small number of cases. A majority of discordant cases were HER2 equivocal by IHC/FISH. One of them contained approxi- mately 1% HER2 negative (1+) invasive cancer and approxi- mately 99% HER2 (3+) DCIS. FISH result was equivocal in the invasive area. Some of the HER2-positive DCIS compo- nents may have been included in the microdissected samples of invasive carcinoma in the course of the experiment. With the exception of HER2 equivocal cases by IHC/FISH, 12 out of 240 cases were inconsistent and IHC/FISH (−)/NanoString (+). This observation may be related to the technical factors associated with the experiment and interpretation of raw data [25].
Of the 15 HER2 equivocal cases by IHC that had FISH re- sults, elevated CEP17 count (polysomy) was observed in five of seven cases that showed FISH-negative/equivocal results and two of eight cases with FISH-positive results. Although the clinical implications of elevated CEP17 count (polysomy) are ambiguous, some studies have linked elevated CEP17 count with adverse clinical features and HER2 overexpression [26,27]. In addition, studies have shown that elevated CEP17 copy number may account for trastuzumab response in tu- mors with a normal HER2:CEP17 ratio [28,29]. This is the reason some pathologists suggest the use of mean HER2 copy number rather than HER2:CEP17 ratio to determine HER2 status in presence of CEP17 co-amplification [16]. According to this recommendation, the absolute quantification of HER2 gene expression is very helpful for the determination of HER2 status. A recent study [30] reported an association between high levels of HER2 and achievement of a pathologic complete response with neoadjuvant treatment. This suggests that accu- rate measurement of HER2 may predict the likelihood of re- sponse in the presurgical setting. In this direction, NanoString assay represents a strong alternative tool to evaluate the HER2 status, as it is quantitative, reproducible, and easy to perform.
Many studies have focused on the quantification of HER2 ex- pression by qRT-PCR and there is a good correlation between qRT-PCR and conventional IHC/FISH methods [18]. How- ever, AUC of NanoString method was observed to be greater than that of qRT-PCR in our study. As AUC is a measure of the overall value of a diagnostic test, our data suggest that NanoString method displays better overall performance as a diagnostic test than qRT-PCR. In addition, qRT-PCR is more sensitive to RNA quality and requires a gene amplification process, which may be a cause of error in the determination of gene status.
Until recent years, oncologists would require an appropriate tumor specimen to detect various potential molecular mark- ers for personalized cancer treatment. Thus, there is a need for an efficient biomarker profiling assay that can be performed with a limited tumor sample. Hence, high-throughput gene screening methods such as NanoString-based assay are useful for comprehensive cancer genome study of individual patient.
In particular, NanoString method can profile 250 genes asso- ciated with breast cancer using only 200 ng of total RNA.
Moreover, NanoString assay has outstandingly high sensitiv- ity, reproducibility, and a wide dynamic range [20].
Although, NanoString-based assay offers several advant- ages, there are some limitations associated with this method.
In comparison to IHC/FISH or qRT-PCR, this technology is relatively expensive mainly due to the acquisition and mainte- nance of devices. However, this method can be considered as cost-effective owing to its ability to analyze a variety of genes at once with a limited sample. Aside from its high cost, it is difficult for this method to present the delicate tumor charac- teristics with genetic complexity of tumor, including intra- tumoral heterogeneity, copy number variations (polysomy), structural alteration in the target gene, and structure and function of proteins predicted to be altered by genetic altera- tion [25]. However, this method may be useful by specifically focusing on the expression levels of most commonly screened, targetable markers such as ER, PR, and HER2 in breast can- cer.Our results revealed high concordance between NanoString- based gene assay and IHC/FISH test for ER, PR, and HER2 in breast cancer. Therefore, NanoString-based assay may be a feasible screening tool for initial identification of breast cancer patients that can undergo treatment with specific targeted agents.
In conclusion, our results suggest a high concordance be- tween IHC assessment of ER, PR, and HER2 and NanoString- based multigene assay. The NanoString-based multigene assay showed high specificity and sensitivity in the evaluation of the molecular status of breast cancer. Based on our study, the comprehensive NanoString-based panel of 250 genes may be a useful and efficient high-throughput screening tool for the identification of genetic alterations of potential therapeutic targets, including ER, PR, and HER2, in the era of personal- ized medicine.
CONFLICT OF INTEREST
The authors declare that they have no competing interests.
REFERENCES
1. Dowsett M, Houghton J, Iden C, Salter J, Farndon J, A'Hern R, et al.
Benefit from adjuvant tamoxifen therapy in primary breast cancer pa- tients according oestrogen receptor, progesterone receptor, EGF recep- tor and HER2 status. Ann Oncol 2006;17:818-26.
2. Harvey JM, Clark GM, Osborne CK, Allred DC. Estrogen receptor sta- tus by immunohistochemistry is superior to the ligand-binding assay for predicting response to adjuvant endocrine therapy in breast cancer.
J Clin Oncol 1999;17:1474-81.
3. Hammond ME, Hayes DF, Dowsett M, Allred DC, Hagerty KL, Badve S, et al. American Society of Clinical Oncology/College of American Pa- thologists guideline recommendations for immunohistochemical test- ing of estrogen and progesterone receptors in breast cancer. J Clin Oncol 2010;28:2784-95.
4. Slamon DJ, Clark GM, Wong SG, Levin WJ, Ullrich A, McGuire WL.
Human breast cancer: correlation of relapse and survival with amplifi- cation of the HER-2/neu oncogene. Science 1987;235:177-82.
5. Owens MA, Horten BC, Da Silva MM. HER2 amplification ratios by fluorescence in situ hybridization and correlation with immunohisto- chemistry in a cohort of 6556 breast cancer tissues. Clin Breast Cancer 2004;5:63-9.
6. Montemurro F, Scaltriti M. Biomarkers of drugs targeting HER-family signaling in cancer. J Pathol 2014;232:219-29.
7. Tandon AK, Clark GM, Chamness GC, Ullrich A, McGuire WL. HER-2/
neu oncogene protein and prognosis in breast cancer. J Clin Oncol 1989;7:1120-8.
8. Vogel CL, Cobleigh MA, Tripathy D, Gutheil JC, Harris LN, Fehrenbacher L, et al. Efficacy and safety of trastuzumab as a single agent in first-line treatment of HER2-overexpressing metastatic breast cancer. J Clin Oncol 2002;20:719-26.
9. Marty M, Cognetti F, Maraninchi D, Snyder R, Mauriac L, Tubiana- Hulin M, et al. Randomized phase II trial of the efficacy and safety of trastuzumab combined with docetaxel in patients with human epider- mal growth factor receptor 2-positive metastatic breast cancer adminis- tered as first-line treatment: the M77001 study group. J Clin Oncol 2005;23:4265-74.
10. Joensuu H, Kellokumpu-Lehtinen PL, Bono P, Alanko T, Kataja V, Asola R, et al. Adjuvant docetaxel or vinorelbine with or without trastuzumab for breast cancer. N Engl J Med 2006;354:809-20.
11. Montemurro F, Valabrega G, Aglietta M. Lapatinib: a dual inhibitor of EGFR and HER2 tyrosine kinase activity. Expert Opin Biol Ther 2007;
7:257-68.
12. Baselga J, Cortés J, Kim SB, Im SA, Hegg R, Im YH, et al. Pertuzumab plus trastuzumab plus docetaxel for metastatic breast cancer. N Engl J Med 2012;366:109-19.
13. Banerjee S, Smith IE. Management of small HER2-positive breast can- cers. Lancet Oncol 2010;11:1193-9.
14. NCCN clinical practice guidelines in oncology: breast cancer 2013.
National Comprehensive Cancer Network. https://www.nccn.org/.
Accessed August 18th, 2017.
15. Wolff AC, Hammond ME, Hicks DG, Dowsett M, McShane LM, Allison KH, et al. Recommendations for human epidermal growth factor re- ceptor 2 testing in breast cancer: American Society of Clinical Oncolo- gy/College of American Pathologists clinical practice guideline update.
J Clin Oncol 2013;31:3997-4013.
16. Hanna WM, Rüschoff J, Bilous M, Coudry RA, Dowsett M, Osamura RY, et al. HER2 in situ hybridization in breast cancer: clinical implica- tions of polysomy 17 and genetic heterogeneity. Mod Pathol 2014;27:4- 18.
17. Laudadio J, Quigley DI, Tubbs R, Wolff DJ. HER2 testing: a review of detection methodologies and their clinical performance. Expert Rev Mol Diagn 2007;7:53-64.
18. Lehmann-Che J, Amira-Bouhidel F, Turpin E, Antoine M, Soliman H, Legres L, et al. Immunohistochemical and molecular analyses of HER2 status in breast cancers are highly concordant and complementary ap- proaches. Br J Cancer 2011;104:1739-46.
19. Barberis M, Pellegrini C, Cannone M, Arizzi C, Coggi G, Bosari S.
Quantitative PCR and HER2 testing in breast cancer: a technical and cost-effectiveness analysis. Am J Clin Pathol 2008;129:563-70.
20. Geiss GK, Bumgarner RE, Birditt B, Dahl T, Dowidar N, Dunaway DL, et al. Direct multiplexed measurement of gene expression with color- coded probe pairs. Nat Biotechnol 2008;26:317-25.
21. Allred DC, Harvey JM, Berardo M, Clark GM. Prognostic and predictive factors in breast cancer by immunohistochemical analysis. Mod Pathol 1998;11:155-68.
22. Perou CM, Sørlie T, Eisen MB, van de Rijn M, Jeffrey SS, Rees CA, et al.
Molecular portraits of human breast tumours. Nature 2000;406:747-52.
23. Schnitt SJ. Classification and prognosis of invasive breast cancer: from morphology to molecular taxonomy. Mod Pathol 2010;23 Suppl 2:S60- 4.
24. Nielsen T, Wallden B, Schaper C, Ferree S, Liu S, Gao D, et al. Analytical
validation of the PAM50-based Prosigna Breast Cancer Prognostic Gene Signature Assay and nCounter Analysis System using formalin- fixed paraffin-embedded breast tumor specimens. BMC Cancer 2014;
14:177.
25. Lira ME, Choi YL, Lim SM, Deng S, Huang D, Ozeck M, et al. A single- tube multiplexed assay for detecting ALK, ROS1, and RET fusions in lung cancer. J Mol Diagn 2014;16:229-43.
26. Watters AD, Going JJ, Cooke TG, Bartlett JM. Chromosome 17 aneu- somy is associated with poor prognostic factors in invasive breast carci- noma. Breast Cancer Res Treat 2003;77:109-14.
27. Hyun CL, Lee HE, Kim KS, Kim SW, Kim JH, Choe G, et al. The effect of chromosome 17 polysomy on HER-2/neu status in breast cancer. J Clin Pathol 2008;61:317-21.
28. Hofmann M, Stoss O, Gaiser T, Kneitz H, Heinmöller P, Gutjahr T, et al.
Central HER2 IHC and FISH analysis in a trastuzumab (Herceptin) phase II monotherapy study: assessment of test sensitivity and impact of chromosome 17 polysomy. J Clin Pathol 2008;61:89-94.
29. Seidman AD, Berry D, Cirrincione C, Harris L, Muss H, Marcom PK, et al. Randomized phase III trial of weekly compared with every- 3-weeks paclitaxel for metastatic breast cancer, with trastuzumab for all HER-2 overexpressors and random assignment to trastuzumab or not in HER-2 nonoverexpressors: final results of Cancer and Leukemia Group B protocol 9840. J Clin Oncol 2008;26:1642-9.
30. Cheng H, Bai Y, Sikov W, Sinclair N, Bossuyt V, Abu-Khalaf MM, et al.
Quantitative measurements of HER2 and phospho-HER2 expression:
correlation with pathologic response to neoadjuvant chemotherapy and trastuzumab. BMC Cancer 2014;14:326.