Biomedical Science Letters 2017, 23(4): 348~354 https://doi.org/10.15616/BSL.2017.23.4.348 eISSN : 2288-7415
Triglyceride and Glucose (TyG) Index is a Clinical Surrogate Marker for the Diagnosis of Metabolic Syndrome
Kyung-A Shin†
Department of Clinical Laboratory Science, Shinsung University, Chungnam 31801, Korea
TyG (triglyceride and glucose) index using triglyceride and fasting blood glucose is recommended as a useful marker for insulin resistance. The present study evaluated the usefulness of TyG index in diagnosing metabolic syndrome and suggested an optimal cut-off value. The subjects of this study were adult 4,415 adults aged 20 to 80 years who underwent health screening at J General Hospital from January 2016 to January 2017. Metabolic syndrome was based on AHA/
NHLBI (American Heart Association/National Heart, Lung, and Blood Institute) criteria. TyG index correlated with metabolic syndrome risk factors including HOMA-IR. Compared with the participants in the lowest quartile of TyG index, odds ratios and 95% confidence intervals for metabolic syndrome were 8.5 (3.005~23.903), 20.0 (17.190~23.407) for those in the third, and the fourth quartile of TyG index. The optimal cut-off value of the metabolic syndrome was 8.81 for TyG index (sensitivity 86.7%, specificity 80.1%) and area under the ROC curve (AUC) was 0.894. In conclusion, TyG index is effective to identify individuals at risk for metabolic syndrome.
Key Words: TyG index, Insulin resistance, Metabolic syndrome, HOMA-IR
서 론
인슐린 저항성은 인슐린에 대한 세포 민감성 감소를 특 징으로 하는 대사증후군의 주요 원인 중 하나이다(Moon et al., 2017). 인슐린 저항성을 평가하는 직접적인 방법으 로 표준법인 고인슐린혈증 정상 혈당 클램프(hyperinsu- linemic euglycemic clamp)와 인슐린 억제 검사(insulin sup- pression test), 인슐린 내성 검사(insulin tolerance test) 등이 있으나, 이러한 검사는 침습적이고 검사방법의 복잡성 과 비용적인 문제로 인해 임상에 적용하기 어려운 점이 있다(DeFronzo et al., 1979; Bergman et al., 1981; Bergman et al., 1987). 따라서 측정이 간단한 간접지표인 HOMA-IR (homeostasis model assessment of insulin resistance)로 인슐린 저항성을 추정하고 있으나(Bonora et al., 2000), 최근에는
중성지방과 공복혈당을 이용한 TyG (triglyceride and glucose) index가 인슐린 저항성에 대한 유용한 지표로 추천된다 (Simental-Mendía et al., 2008; Guerrero-Romero et al., 2010).
중성지방의 증가는 근육-혈당대사를 방해하며, 이는 혈청 및 조직에서의 중성지방 상승이 인슐린 감수성을 감소시 킬 수 있음을 반영하는 결과이다(Pan et al., 1997; Kelley and Goodpaster, 2001). 멕시코인을 대상으로 TyG index에 의한 인슐린 저항성이 처음 측정되었으며(Simental-Mendía et al., 2008), 국내에서는 Lee 등(2014)이 TyG index와 당뇨 병의 연관성을 입증하였다.
이와 같이 TyG index는 당뇨병 및 심혈관질환의 위험을 예측할 수 있는 지표로 보고되고 있으나(Lee et al., 2014;
Sánchez-Íñigo et al., 2016), 대사증후군에 대한 TyG index의 진단력에 대해서는 보고된 바가 없다. 따라서 이 연구에 서는 인슐린 저항성을 반영하는 간편법인 HOMA-IR과 비
*Received: September 6, 2017 / Revised: October 19, 2017 / Accepted: October 20, 2017
†Corresponding author: Kyung-A Shin. Department of Clinical Laboratory Science, Shinsung University, 1 Daehak-Ro, Dangjin-Si 31801, Korea.
Tel: +82-41-350-1408, Fax: +82-41-350-1355, e-mail: [email protected]
○CThe Korean Society for Biomedical Laboratory Sciences. All rights reserved.
○CCThis is an Open Access article distributed under the terms of the Creative Commons Attribution Non-Commercial License (http://creativecommons.org/licenses/by-nc/3.0/) which permits unrestricted non-commercial use, distribution, and reproduction in any medium, provided the original work is properly cited.
Original Article
교하여 TyG index가 대사증후군을 진단하는데 유용한지를 알아보고 타당한 절단값을 제시하자 하였다.
재료 및 방법
연구 대상자
이 연구의 대상자는 2016년 01월부터 2017년 01월까지 경기지역 J 종합병원에서 건강검진을 시행한 20세 이상 80세 이하의 성인 남녀를 대상으로 하였다. 전체 대상자 총 10,335명 중 신체 계측 및 각각의 해당 혈액 검사에 결측치를 포함하는 경우, 암, 간질환, 신장질환, 뇌졸중, 일시적인 허혈성 발작의 병력이 있는 5,920명을 제외한 4,415명을 최종 연구 대상자로 선정하였으며, 이 중 남성 은 2,361명, 여성은 2,054명 이었다. 이 연구는 경기지역 종합병원에서 기관생명윤리위원회의 승인을 받아 시행되 었다(IRB No: D-1207-003-0049).
대사증후군 진단 기준
선행연구는 NCEP-ATP III (National Cholesterol Education Program Adult Treatment Panel III)의 기준으로 대사증후군 을 진단하였으나(Li 등, 2017), 본 연구에서는 최근 미국 당뇨병학회의 공복혈당장애 기준인 100 mg/dL 이상을 반 영한 AHA/NHLBI (American Heart Association/National Heart, Lung, and Blood Institute)을 대사증후군 진단 기준으로 삼 았다. AHA/NHLBI에서 제시한 5가지 위험요인 중 3개 이상 해당하는 경우 대사증후군 진단군(MetS; metabolic syndrome, n=496)으로 판정하였다. 또한 0~2개의 위험요 인을 포함하는 경우 정상군(Non-MetS, n=3,919)으로 분류 하였다(Grundy et al., 2005). AHA/NHLBI에서 제시한 5가 지 대사증후군 진단 기준은 ① 수축기 혈압 ≥130 mmHg 또는 이완기 혈압 ≥85 mmHg ② 공복혈당 ≥100 mg/dL
③ 혈중 중성지방 ≥150 mg/dL ④ 혈중 HDL-콜레스테롤 남성 <40 mg/dL, 여성 <50 mg/dL ⑤ 허리둘레 남성 ≥102 cm, 여성 ≥88 cm으로 정의하고 있으나, 이 연구에서는 동양인의 복부비만 기준에 적합한 아시아-태평양 지역 기준(Asia-Pacific Criteria, APC)에 따라 남성 ≥90 cm, 여성
≥80 cm을 복부비만으로 적용하였다(WHO, 2000).
혈액 검사
최소 8시간 이상 공복 상태에서 전주정맥(antecubital vein)에서 혈액을 채취하여 혈액 검사를 시행하였다. 총콜 레스테롤, HDL-콜레스테롤, LDL-콜레스테롤, 중성지방, 공
복혈당, 고감도 C-반응단백질(high sensitivity C-reactive pro- tein, hs-CRP), 요산을 TBA-200FR NEO (Toshiba, Tokyo, Japan) 생화학 자동분석기로 측정하였다. 당화혈색소(hemo- globin A1c, HbA1c)는 전혈 검체로 Variant II (Bio Rad, CA, USA) 장비에서 고성능액체크로마토그래피법(high perform- ance liquid chromatography, HPLC)의 원리로 측정하였다. 인 슐린은 Modular Analytics E170 (Roche, Mannheim, Germany) 장비로 전기화학발광면역분석법(electrochemiluminescence immunoassay, ECLIA)의 원리로 검사하였다. 인슐린 저항 성을 평가하는 HOMA-IR (homeostasis model assessment- insulin resistance)은 [공복시 인슐린 (μIU/mL) × 공복시 혈당 (mg/dL)] / 405로 계산하였으며(Matthews et al., 1985), TyG index는 Ln [TG (mg/dL) × FPG (mg/dL)/2]의 수식으 로 계산하였다(Simental-Mendía et al., 2008; Guerrero-Romero et al., 2010).
신체 계측
자동 신체 계측기 DS-103M (Jenix, Seoul, Korea)로 신 장과 체중을 측정하였으며, 체질량지수(body mass index, BMI)는 몸무게(kg)를 키(m)의 제곱으로 나눈 수치로 제시 하였다. 허리둘레는 WHO의 표준화된 프로토콜에 따라 직립 자세로 양 발을 25~30 cm 정도 벌리고 숨을 내쉰 후 갈비뼈 가장 아래 위치와 골반의 가장 높은 위치의 중 간 지점에서 줄자로 측정하였으며, 엉덩이 둘레는 엉덩이 의 가장 돌출된 부분을 지나 평행하게 측정하였다. 혈압 측정은 10분 이상 안정을 취한 후 앉은 자세에서 수은 혈 압계로 측정하였으며, 2분 이상 휴식 후 2번 반복 측정하 여 평균값을 구하였다.
자료 처리 방법
이 연구는 SPSS Windows 18.0 (IBM, Armonk, USA) 통계 프로그램을 이용하여 자료 처리를 하였으며, 모든 기술 통계치는 평균과 표준편차로 제시하였다. 대사증후군 진 단 유무에 따른 인체 측정학적 및 생화학적 변인의 차이 를 비교하기 위해 독립표본 t 검정(independent t-test)을 실 시하였으며, 대사증후군 유무에 따른 성별과 대사증후군 각각의 위험요인의 차이, HOMA-IR과 TyG index 사분위수 에 따른 대사증후군 유병률의 차이를 확인하기 위해 카 이 제곱 검증(χ-square test)을 시행하였다. 또한 HOMA-IR 과 TyG index간의 상관성을 알아보기 위해 피어슨 상관계 수(Pearson Correlation Coefficient)로 상관성을 확인하였 다. HOMA-IR과 TyG index의 사분위수에 따른 대사증후
군 유병률의 교차비를 알아보기 위해 성별, 연령, 허리둘 레, BMI를 보정한 후 로지스틱 회귀분석(logistic regression) 을 시행하였으며, 오즈비(odds ratio, OR)와 95% 신뢰구간 (confidence interval, CI)을 제시하였다. 인슐린 저항성을 측 정하는 TyG index가 HOMA-IR과 비교하여 대사증후군 진 단을 위한 정확한 지표인지를 확인하기 위해 ROC 곡선 (Receiver Operating Characteristic Curve)의 면적을 비교하였 으며, 최적 절단값(optimum cut-off values)을 판단하기 위해 민감도(sensitivity)와 특이도(specificity)를 Youden index(민
감도+특이도-1)를 이용하여 구하였다. 이 연구의 통계학적 유의수준은 P<0.05로 설정하였다.
결 과
대사증후군 유무에 따른 대상자의 특징
대사증후군 진단 유무에 따른 대상자의 특징은 Table 1 과 같다. 연령과 성별 중 남성의 비율은 정상군보다 대사 증후군 진단군이 높았다(각각 P<0.001). 신체 측정학적 특
Table 1. Characteristics of the participants according to presence of metabolic syndrome
Variable Non-MetS
(N=3,919) MetS
(N=496) P-value
Age (yr) 48.30±11.09 55.02±10.73 <0.001
Men (%)* 2,040 (52.1) 321 (64.7) <0.001
Height (cm) 164.78±8.74 165.28±10.05 0.291
Weight (kg) 63.96±11.40 75.05±12.48 <0.001
BMI (kg/m2) 23.44±3.00 26.98±2.83 <0.001
Waist circumference (cm) 78.56±8.84 89.40±7.29 <0.001
Hip circumference (cm) 93.23±20.13 99.48±40.44 <0.001
Systolic blood pressure (mmHg) 109.10±13.60 124.49±16.39 <0.001
Diastolic blood pressure (mmHg) 69.64±9.75 78.65±10.46 <0.001
Total cholesterol (mg/dL) 195.03±35.02 301.49±37.20 <0.001
HDL-cholesterol (mg/dL) 58.01±13.92 44.57±9.83 <0.001
LDL-cholesterol (mg/dL) 120.08±31.90 126.74±34.68 <0.001
Triglyceride (mg/dL) 108.95±72.36 217.46±111.35 <0.001
Fasting glucose (mg/dL) 89.67±17.05 109.64±29.27 <0.001
hs-CRP (mg/dL) 0.17±0.55 0.22±0.49 0.030
Uric acid (mg/dL) 5.06±1.42 5.59±1.50 <0.001
HbA1c (%) 5.58±0.67 6.26±1.12 <0.001
Insulin (μU/mL) 4.53±2.72 7.68±4.00 <0.001
HOMA-IR 1.02±0.69 2.09±1.31 <0.001
TyG index 8.32±0.59 9.25±0.47 <0.001
Metabolic syndrome components
High blood pressure* 439 (11.2) 259 (52.2) <0.001
Impaired fasting glucose* 463 (11.8) 304 (61.3) <0.001
High triglyceride* 712 (18.2) 400 (80.6) <0.001
Low HDL-cholesterol* 452 (11.5) 282 (56.9) <0.001
Abdominal obesity* 676 (17.2) 391 (78.7) <0.001
Calculated by independent t-test.
Values are presented as mean ± SD.
*; Calculated by χ2-test. Data are presented as number (%).
Abbreviations: MetS, metabolic syndrome; BMI, body mass index; HDL, high density lipoprotein; LDL, low density lipoprotein; hs-CRP, high sensitivity C-reactive protein; HbA1c, hemoglobin A1c; HOMA-IR, homeostasis model assessment of insulin resistance; TyG index, triglyceride-glucose index.
징으로 신장은 집단간 차이가 없었으나, 체중, BMI, 허리 둘레, 엉덩이 둘레는 정상군보다 대사증후군 진단군에서 높았다(각각 P<0.001). 또한 수축기와 이완기 혈압은 정 상군보다 대사증후군 진단군이 유의하게 높았다(각각 P<
0.001). 생화학적 변인 중 총콜레스테롤, LDL-콜레스테롤, 중성지방, 공복혈당, 요산, HbA1c, 인슐린, HOMA-IR, TyG index는 정상군보다 대사증후군 진단군에서 유의하게 높 았다(각각 P<0.001). 또한 hs-CRP는 대사증후군 진단군이 정상군보다 높았으며(P=0.030), HDL-콜레스테롤은 대사증 후군 진단군보다 정상군에서 높았다(P<0.001). 대사증후 군 위험요인인 혈압 상승, 공복혈당장애, 중성지방 상승, HDL-콜레스테롤 감소, 복부비만은 정상군보다 대사증후 군 진단군에서 높은 빈도를 보였다(각각 P<0.001).
HOMA-IR과 TyG index 사분위수에 따른 대사증후군 유병률
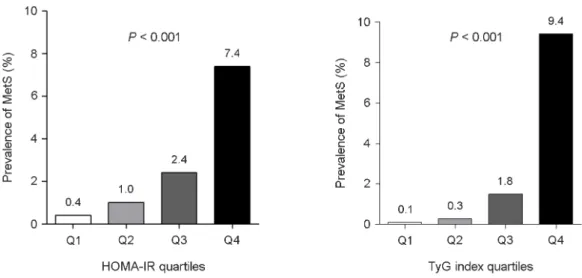
HOMA-IR과 TyG index를 사분위수로 나누어 집단간 대 사증후군 유병률의 차이를 비교한 결과 HOMA-IR과 TyG index는 분위수가 높아질수록 대사증후군 유병률이 증가 하였으며, 4사분위수에서 HOMA-IR은 7.4%, TyG index는 9.4%의 대사증후군 유병률을 보였다(각각 P<0.001) (Fig. 1).
HOMA-IR과 TyG index의 상관관계
대사증후군 위험요인인 허리둘레, 수축기와 이완기 혈
압, 총콜레스테롤, LDL-콜레스테롤, 중성지방, 공복혈당은 TyG index와 정적 상관성을 보였으며, HDL-콜레스테롤 과는 부적 상관관계를 보였다(각각 P<0.001). HOMA-IR과 TyG index는 r=0.498, r2=0.248로 HOMA-IR의 변화량에 따 라 TyG index의 변화량에 대해 24.8% 설명될 수 있는 것 으로 나타났다(P<0.001) (Table 2).
HOMA-IR과 TyG index의 사분위수에 따른 대사증후군 유병률의 위험비
로지스틱 회귀분석에 의해 HOMA-IR과 TyG index 사 분위수에 따른 대사증후군과의 관련성을 분석한 결과, HOMA-IR은 1사분위수보다 3사분위수에서 대사증후군 발 생이 3.0배 높았으며(OR: 3.097, 95% CI: 1.841~5.208), 4사 분위수는 1사분위수보다 대사증후군 발생 위험도가 8.1 배 높게 나타났다(OR: 8.145, 95% CI: 4.931~13.451). TyG index는 1사분위수에 비해 3사분위수에서 대사증후군 발 생이 8.5배 높았으며(OR: 8.476, 95% CI: 3.005~23.903), 4사 분위수는 20.0배 높았다(OR: 20.025, 95% CI: 17.190~
23.407). 그러나 HOMA-IR과 TyG index 모두 1사분위수와 2사분위수간의 대사증후군 발병 위험에는 차이가 없었다 (Table 3).
Fig. 1. Prevalence of metabolic syndrome according to HOMA-IR and TyG index quartile. Abbreviations: MetS, metabolic syndrome;
HOMA-IR, homeostasis model assessment of insulin resistance; TyG index, triglyceride-glucose index; Q1, first quartile (HOMA-IR <0.59, TyG index <7.95); Q2, second quartile (0.59≤ HOMA-IR <0.93, 7.95≤ TyG index <8.41); Q3, third quartile (0.93≤ HOMA-IR <1.43, 8.41≤ TyG index <8.86); Q4, fourth quartile (1.43≤ HOMA-IR, 8.86≤ TyG index).
대사증후군을 예측하기 위한 HOMA-IR과 TyG index의 절단값
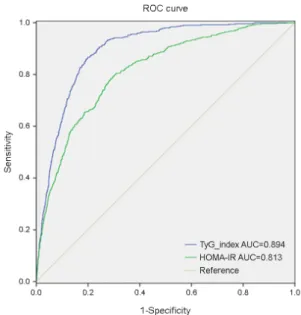
ROC 분석을 통해 대사증후군을 진단하기 위한 HOMA- IR과 TyG index의 적정 절단값을 측정한 결과는 Table 4 와 같으며, Fig. 2에 ROC 곡선으로 위양성율과 그에 대한 실제 양성율을 그래프로 나타냈다. 곡선의 아래 면적인
AUC (area under the ROC curve)는 분류 정확도를 나타내는 데, HOMA-IR의 AUC 값은 0.813, 절단값은 1.16, 민감도 는 80.4%, 특이도는 69.1%로 나타났다. TyG index의 AUC 값은 0.894이며, 절단값은 8.81, 민감도는 86.7%, 특이도는 80.1%였다.
고 찰
이 연구는 HOMA-IR과 비교하여 TyG index가 대사증 후군을 진단하는데 유용한지를 알아보고 타당한 절단값 을 제시하고자 하였다. 그 결과 TyG index는 HOMA-IR을 포함한 대사증후군 위험요인과 상관성을 보였으며, TyG index의 분위수가 증가할수록 대사증후군 유병률은 증가 하였다. 또한 TyG index는 HOMA-IR보다 대사증후군 위 험을 예측하는데 더 유용하게 나타났다.
대사증후군은 심혈관 및 뇌혈관질환의 위험을 증가시키 며, 대사증후군을 진단할 수 있는 간단하고 효과적인 지 표를 설정하는 것은 대사증후군을 평가하는데 매우 중요 하다(Lakka et al., 2002; Rodriguez-Colon et al., 2009; Li et al., 2017). 인슐린 저항성은 대사증후군 발병에 중요한 역할 을 하는 것으로 제시되며, 고인슐린혈증 정상 혈당 클램 프(hyperinsulinemic euglycemic clamp)는 인슐린 민감성을 Table 2. Correlation between HOMA-IR and TyG index
Variables TyG index
r P-value
HOMA-IR 0.498 <0.001
Waist circumference (cm) 0.481 <0.001 Systolic blood pressure (mmHg) 0.267 <0.001 Diastolic blood pressure (mmHg) 0.275 <0.001 Total cholesterol (mg/dL) 0.284 <0.001 HDL-cholesterol (mg/dL) -0.486 <0.001 LDL-cholesterol (mg/dL) 0.248 <0.001
Triglyceride (mg/dL) 0.868 <0.001
Fasting glucose (mg/dL) 0.472 <0.001 Calculated by correlation analysis.
Abbreviations: TyG index, triglyceride-glucose index; HOMA-IR, homeostasis model assessment of insulin resistance; HDL, high density lipoprotein; LDL, low density lipoprotein.
Table 3. Odds ratios for metabolic syndrome in different quartiles of TyG index and HOMA-IR
Variables OR (95% CI)
for MetS P-value
TyG index Q1
(reference) 1
Q2 1.763 (0.557~5.577) 0.334 Q3 8.476 (3.005~23.903) <0.001 Q4 20.025 (17.190~23.407) <0.001
HOMA-IR Q1
(reference) 1
Q2 1.647 (0.935~2.901) 0.084 Q3 3.097 (1.841~5.208) <0.001 Q4 8.145 (4.931~13.451) <0.001 Calculated by logistic regression analysis.
Logistic regression was adjusted for gender, age, waist circum- ference, BMI.
Abbreviations: Q1, first quartile; Q2, second quartile; Q3, third quartile; Q4, fourth quartile; TyG index, triglyceride-glucose index;
HOMA-IR, homeostasis model assessment of insulin resistance.
Fig. 2. ROC Curves for metabolic syndrome using the criteria of AHA/NHLBI. Abbreviations: ROC, receiver operating characteristic;
HOMA-IR, homeostasis model assessment of insulin resistance;
TyG index, triglyceride-glucose index.
가장 정확하게 측정하는 방법이지만 많은 시간과 비용이 소모된다(DeFronzo et al., 1979; Moon et al., 2017). Bonora 등(2000)은 대규모 역학연구에서 표준법인 고인슐린혈증 정상 혈당 클램프와 HOMA-IR사이에 강한 역상관 관계를 보여 HOMA-IR이 안정적으로 인슐린 저항성을 측정하는 데 사용될 수 있다는 결론을 내렸다. 그러나 인슐린 측정 은 표준 분석법이 없기 때문에 인슐린 저항성을 추정하기 위해 인슐린을 포함하지 않는 간접 측정법을 개발하려는 노력이 지속되었다(Moon et al., 2017).
TyG index는 인슐린 측정이 불가능한 경우 인슐린 대신 중성지방을 이용하여 인슐린 저항성을 확인할 수 있는 대 체 검사로서, 건강인을 대상으로 인슐린 저항성을 평가하 는데 HOMA-IR과 비교한 결과 TyG index가 높은 민감도 와 특이도를 보였다(Simental-Mendía et al., 2008). Lee 등 (2014)은 한국인을 대상으로 TyG index와 당뇨병의 연관 성을 입증하였으며, Navarro-Gonzalez 등(2016)은 유럽 백 인 코호트에 근거하여 TyG index가 제 2형 당뇨병의 위험 을 조기에 발견하는데 유용함을 확인하였다. 또한 Li 등 (2017)은 TyG index가 심혈관질환의 위험을 예측할 수 있 는 지표이며, 중국인을 대상으로 대사증후군과 유의한 관 련이 있음을 보여주었다.
본 연구에서 TyG index의 분위수가 증가할수록 대사증 후군 유병률은 증가하였으며, TyG index가 8.86 이상인 4 사분위수에서 대사증후군 유병률과 대사증후군 발병 위 험이 급격히 증가하는 경향을 보였다. 또한 TyG index는 HOMA-IR을 포함한 대사증후군 위험요인과 상관성을 보 였다. Li 등(2017)의 연구에서 대사증후군 위험요인이 증 가함에 따라 TyG index는 남녀 모두에서 증가하였으며, NCEP-ATP III의 기준으로 대사증후군 진단을 위한 최적 절단값은 8.71, ROC 곡선의 AUC 값은 0.802로 TyG index 는 대사증후군 진단을 위한 신뢰성 있는 지표로 보고하 였다.
본 연구결과 AHA/NHLBI 기준으로 대사증후군 진단을 위한 TyG index의 최적 절단값은 8.81, AUC 값은 0.894이
었으며, 민감도와 특이도는 각각 86.7%와 80.1%로 나타 나 HOMA-IR 수치보다 TyG index가 대사증후군 위험을 예측하는데 더 유용한 것으로 나타났다. 이는 TyG index 가 AHA/NHLBI에서 제시한 5가지 대사증후군 위험요인 중 공복혈당과 중성지방의 2가지 위험요인을 결합하여 계 산식을 산출한 반면, HOMA-IR은 공복혈당만을 계산식 에 포함하였기 때문으로 생각된다. 그러므로 TyG index가 HOMA-IR보다 대사증후군 위험을 선별하는 능력이 우수 하지만, 인슐린 측정이 불가능한 경우 인슐린 저항성을 확 인하기 위한 보조적인 검사로 활용하는 것이 타당하겠다 (Guerrero-Romero et al., 2010). 이 연구에서 대사증후군 진 단군과 정상군간에 성별과 연령의 차이가 존재하며, 로지 스틱 분석에서는 성별과 연령을 통제하였으나 다른 통계 분석에서는 성별과 연령을 완전히 통제하지 못한 제한점 이 있다. 이에 다양한 연령대와 성별을 구분하여 대사증 후군을 평가하기 위한 TyG index의 유용성에 대한 연구가 필요하겠다.
결론적으로, TyG index는 대사증후군 위험요인과 관련이 있으며, 대사증후군의 핵심 지표인 인슐린 저항성을 진단 하는데 HOMA-IR보다 높은 민감도와 특이도를 나타내어 HOMA-IR의 대체 지표로서 대사증후군 위험을 확인하는 유용한 방법으로 활용될 수 있으리라 사료된다.
ACKNOWLEDGEMENTS None.
CONFLICT OF INTEREST
The authors have no conflicts of interest to disclose.
REFERENCES
Bergman RN, Phillips LS, Cobelli C. Physiologic evaluation of factors controlling glucose tolerance in man: measurement of insulin sensitivity and beta-cell glucose sensitivity from the Table 4. ROC-curve analysis according to TyG index and HOMA-IR
Variables Cutoff value Sensitivity Specificity AUC (95% CI) P-value
TyG index 8.81 86.7% 80.1% 0.894 (0.881~0.906) <0.001
HOMA-IR 1.16 80.4% 69.1% 0.813 (0.793~0.833) <0.001
Abbreviations: ROC, receiver operating characteristic; AUC, area under the curve; TyG index, triglyceride-glucose index, HOMA-IR, homeostasis model assessment of insulin resistance.
response to intravenous glucose. Journal of Clinical Investi- gation. 1981. 68: 1456-1467.
Bergman RN, Prager R, Volund A, Olefsky JM. Equivalence of the insulin sensitivity index in man derived by the minimal model method and the euglycemic glucose clamp. Journal of Clinical Investigation. 1987. 79: 790-800.
Bonora E, Targher G, Alberiche M, Bonadonna RC, Saggiani F, Zenere MB, Monauni T, Muggeo M. Homeostasis model assessment closely mirrors the glucose clamp technique in the assessment of insulin sensitivity: studies in subjects with various degrees of glucose tolerance and insulin sensitivity.
Diabetes Care. 2000. 23: 57-63.
DeFronzo RA, Tobin JD, Andres R. Glucose clamp technique: a method for quantifying insulin secretion and resistance.
American Journal of Physiology. 1979. 237: E214-223.
Grundy SM, Cleeman JI, Daniels SR, Donato KA, Eckel RH, Franklin BA, Gordon DJ, Krauss RM, Savage PJ, Smith SC Jr, Spertus JA, Costa F; American Heart Association; National Heart, Lung, and Blood Institute. Diagnosis and management of the metabolic syndrome: an American Heart Association/
National Heart, Lung, and Blood Institute Scientific Statement.
Circulation. 2005. 112: 2735-2752.
Guerrero-Romero F, Simental-Mendía LE, González-Ortiz M, Martínez-Abundis E, Ramos-Zavala MG, Hernández-González SO, Jacques-Camarena O, Rodríguez-Morán M. The product of triglycerides and glucose, a simple measure of insulin sensitivity. Comparison with the euglycemic-hyperinsulinemic clamp. Journal of Clinical Endocrinology and Metabolism.
2010. 95: 3347-3351.
Kelley DE, Goodpaster BH. Skeletal muscle triglyceride. An aspect of regional adiposity and insulin resistance. Diabetes Care.
2001. 24: 933-941.
Lakka HM, Laaksonen DE, Lakka TA, Niskanen LK, Kumpusalo E, Tuomilehto J, Salonen JT. The metabolic syndrome and total and cardiovascular disease mortality in middle-aged men.
Journal of the American Medical Association. 2002. 288:
2709-2716.
Lee SH, Kwon HS, Park YM, Ha HS, Jeong SH, Yang HK, Lee JH, Yim HW, Kang MI, Lee WC, Son HY, Yoon KH. Predicting the development of diabetes using the product of triglycerides and glucose: The Chungju Metabolic Disease Cohort (CMC) study. Public Library of Science One. 2014. 28: e90430.
Li R, Li Q, Cui M, Yin Z, Li L, Zhong T, Huo Y, Xie P. Clinical surrogate markers for predicting metabolic syndrome in middle-
aged and elderly Chinese. Journal of Diabetes Investigation.
2017. (in press).
Matthews DR, Hosker JP, Rudenski AS, Naylor BA, Treacher DF, Turner RC. Homeostasis model assessment: insulin resistance and beta-cell function from fasting plasma glucose and insulin concentrations in man. Diabetologia. 1985. 28: 412-419.
Moon S, Park JS, Ahn Y. The cut-off values of triglycerides and glucose index for metabolic syndrome in American and Korean Adolescents. Journal of Korean Medical Science. 2017. 32:
427-433.
Navarro-González D, Sánchez-Íñigo L, Pastrana-Delgado J, Fernández-Montero A, Martinez JA. Triglyceride-glucose in- dex (TyG index) in comparison with fasting plasma glucose improved diabetes prediction in patients with normal fasting glucose: The Vascular-Metabolic CUN cohort. Preventive Medicine. 2016. 86: 99-105.
Pan DA, Lillioja S, Kriketos AD, Milner MR, Baur LA, Bogardus C, Jenkins AB, Storlien LH. Skeletal muscle triglyceride levels are inversely related to insulin action. Diabetes. 1997.
46: 983-988.
Rodriguez-Colon SM, Mo J, Duan Y, Liu J, Caulfield JE, Jin X, Liao D. Metabolic syndrome clusters and the risk of incident stroke: the atherosclerosis risk in communities (ARIC) study.
Stroke. 2009. 40: 200-205.
Sánchez-Íñigo L, Navarro-González D, Fernández-Montero A, Pastrana-Delgado J, Martínez JA. The TyG index may predict the development of cardiovascular events. European Journal of Clinical Investigation. 2016. 46: 189-197.
Simental-Mendía LE, Rodríguez-Morán M, Guerrero-Romero F.
The product of fasting glucose and triglycerides as surrogate for identifying insulin resistance in apparently healthy subjects.
Metabolic Syndrome and Related Disorders. 2008. 6: 299-304.
World Health Organization Western Pacific Region, International Association for the study of obesity, and International Obesity Task Force. The asian-pacific perspective: redefining obesity and its treatment. Sydney, Australia:Health Communications Australia. 2000.
https://doi.org/10.15616/BSL.2017.23.4.348
Cite this article as: KA Shin. Triglyceride and Glucose (TyG) Index is a Clinical Surrogate Marker for the Diagnosis of Metabolic Syndrome. Biomedical Science Letters. 2017. 23: 348-354.