대한임상병리사회지 : 제 22권 제 1호 1990
일부 한국인 후락토사민 참조치 설정 에 관한 연구
고려대학교 보건전문대학 임상병리과 이 창 규*
고려병원 임상명리과 김 충 빈 신흥전문대학 임상명리과
B1- 으」 벼
ï ' - 。
Key Words : fructosamine value. reference intervals. healthy korean
인체의 혈액생화학 성분은 생리적인 상태나, 유전 적 소인, 질병이나 기타 여러 가지 환경적 소언에 따 라 달라진다. 따라서 임상에서는 참조치를 설정할 때에는 성별, 연령별 또는 인종별 등에 의해 분류하 기를 원하고 었다.
Glycated hemoglobin은 당뇨병 의 진 단, 치 료관 리에 이미 측정되어 사용된지가 오래이다. 또한 근 년 에 glycated serum protein 측정 법 이 개 발 보급되 어 또다른 장점을 갖는 방법으로서 각광을 받고 있 다.
저자들은 창조치로서의 신빙성을 갖을 만한 일부 건강한 한국인들의 후락토사민 농도를 새로운 방법 으로 정도관리 상태가 양호한 가운데 측정하였다.
그리고 그 결과를 여러 가지 통계학적인 방법으로 분석하여 유용한 참조치로서의 최적화를 시도하여 보았다.
1. Introduction
J ohnson et a19) developed a new method for determining glycosylated serum protein, the fruct- osamine. Serum fructosamine concentration, as an indication of glycosylation of serum proteins,
reflects the time integrated glucose concentration over the previous follow-up of diabetes mellitus. 2_
,3)
The establishment of reference values or ranges for tests performed in the clinical laboratory is of obvious importance in diagnosis and treatment.
Previously published reference intervals do not represent adequately the specific population from which the patient comes for characteristic such as age, sex and ethnic.
Furthermore, clinical laboratory data do not always follow a gaussian frequency distribution.
In spite of this, parametric statistical methods based on underlying assumption of normal data distribution are often used indiscriminately in clinical laboratories4).
For the study, we have analyzed values of fruct- osamine obtained from healthy Koreans by means of AIC (Akail‘e’s Information Criterion) method1-
In addition, influence of age and sex on the fructosamine concentration was also revealed.
* 본 논문은 1990\견 8월 6일 Swiss, Geneva에 서 개 최 된 19차 IAMLT 국제 학회 에 서 발표된 것 임
II. Materials and Methods 1. Subjects
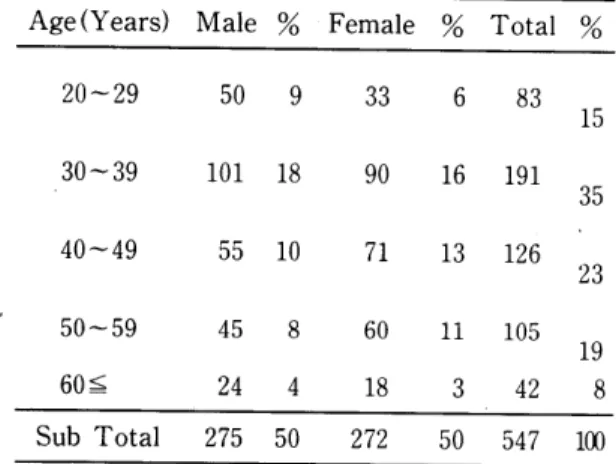
To establish the reference range of serum fruct- osamine, a total of 547 normal subjects, who came to the Center for Health Screening at Koryo General Hospital from Nov. 1, 1988 to Feb. 28, 1989, were examined. The numbers subjected in this study are shown for each sex and age groups in Table 1.
After a 12-hrs fasting, blood specimens were collected from the antecubital vein into V acutaine- r tubes for serum separation. The serum was separated within 2hrs and stored at 4°C or stored forzen at 20°C until the assay.
Table 1. Characteristics of study population Age(Years) Male % Female % Total %
20-29 50 9 33 6 83
15 30-39 101 18 90 16 191
35
40-49 55 10 71 13 126
23
50-59 45 8 60 11 105
19
60~ 24 4 18 3 42 8 Sub Total 275 50 272 50 547 100
2. Fructosamine Assay
The measurement of serum fructosamine was autoanalysed by using a Abott VP bichromatic autoanalyzer (Abott Laboratories, N. Chicago, IL, USA) and a commercial kit (F. Hoffman-La Roche, Basle, Switzerland) .
3. Statistical Analysis
We carried out several types of transformations for data in which the reference interval endpoints
are established by the mean± 1. 96 SD of the trans- formed data, then retransformed back. Trans- formational efficacy was determined by AIC method among which the lowest value was selec- ted.
A two-way analysis of variance was done to determine the influence of age and sex on the results.
III. Results
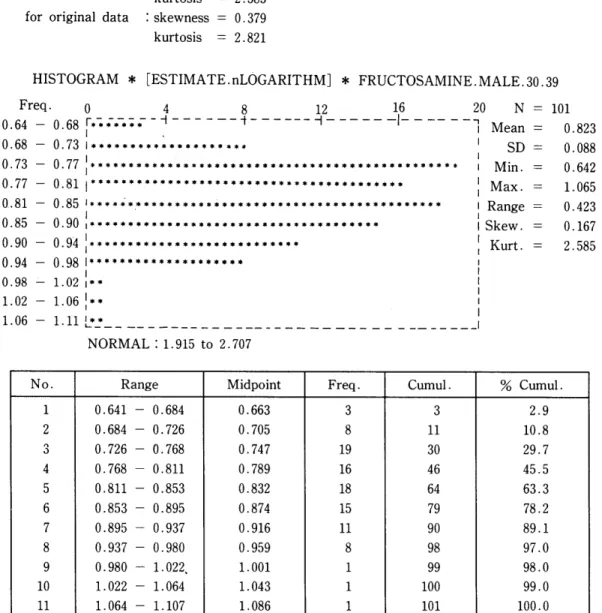
The types of distribution exhibited by fructosa- mine constituents are shown in Table 2 and Fig.
1.
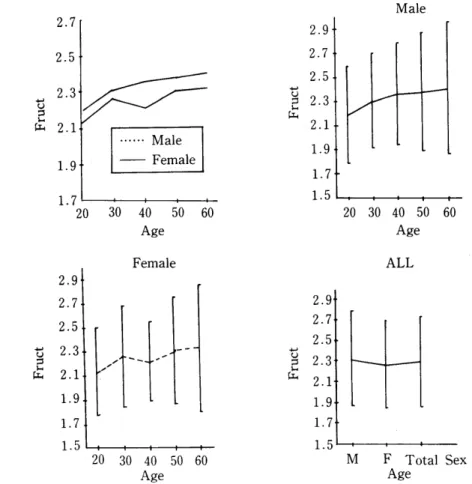
The age specific mean values fer fructosamine for male (Fig. 2 and Table 3) increase gradually from 2.19m mol/L for ages 20-29years to 2.41 m mol/L at age 60 ~years.
For fasting female (Fig. 2 and Table 3), the age -specific fructosamine mean values increase from 2. 12 m mol/L for the 20-29 age group to 2. 26 m mol/L at 30-39 years. For age group of 40-49 years. the mean is lower (2. 22 m mol/U, then becomes higher again for the older age groups up to a level of 2. 31-2. 32m mol/L for ages 50~
years.
Table 4 shows results of the two-way analysis of variance, used to determine the influence of age and sex on the fructosamine values.
There are significant differences in respect to age and sex related changes(P<0.05).
Table 2. Types of distribution exhibited by serum fructosamine in each age groups and sex
Age(Years) N Male N Female N Total 20-29 50 Log 33 Power
30-39 101 Log 90 Log 40-49 55 Log 71 Log 50-59 45 Log 60 X
60~ 24 Log 18 Log
Sub Total 275 Log 272 Log 547 Log
ORIGINAL DATA DESCRIPTION: FRUCTOSAMINE. MALE.30-39 N=lOl
MEAN= 2.286 S.D.= 0.203
ESTIMATED DATA DESCRIPTION :
(1) transform : x
k 0 m 0 AIC = -767.73
k 0 m AIC -766.15
k 0 m 2 AIC -762.47
k m 0 AIC -760.21
k m 1 AIC -758.89
k 1 m 2 AIC -755.43
k 2 m= 0 AIC -752.93
k 2 m = 1 AIC = -751.90 k 2 m = 2 AIC = -748.67 sub-optimal : k 0
m = 0 AIC = -767. 73 (2) transform : In (x)
k 0 m 0 AIC -770.21
k 0 m AIC --766.86
k 0 m 2 AIC -761.97
k 1 m 0 AIC -763.33
k 1 m 1 AIC -760.23
k 1 m 2 AIC = -755.55 k 2 m 0 AIC = -756.75 k 2 m 1 AIC = -753.93 k 2 m 2 AIC = -749.48 sub-optimal : k 0
m 0
AIC = -770.21 (3) transform : xlambda
k 0 m 0 AIC = -768.78 lambda = -0.781 k 0 m = 1 AIC = -764.86 lambda = 0.063 k 0 m = 2 AIC = -760.49 lambda = 0.844 k 1 m = 0 AIC = -762.59 lambda = -1.188 k 1 m 1 AIC = -758.33 lambda = -0.344 k 1 m = 2 AIC = -753.66 lambda = 0.406 k 2 m = 0 AIC = -757.20 lambda = -1.688
k 2 m= 1 AIC -752.51 lambda -0.906
k 2 m = 2 AIC -747.50 lambda = -0.125 sub-optimal : k = 0
m = 0 AIC = -767.73 lambda = -0.781
Continued
·MODEL:
(A) transform : f (x) In (x)
k* 0
m* 0
AIC -770.21
(B) outliers :
(C) estimated normal range : 1. 915 to 2. 707 non parametric estimate : 1. 855 to 2. 7 45 (D) skewness and kurtosis :
for normal values : skewness kurtosis for original data : skewness
kurtosis
0.167 2.585 0.379 2.821
HISTOGRAM * [ESTIMATE. nLOGARITHM] * FRUCTOSAMINE. MALE. 30.39
Freq. o 4 8 12 16 20
0. 64 0. 68 i ;; .-.-.; .- -~ - - - -- -i - - - -- - -1 - - - - - -I- - -- - -,
0. 68 0. 73 I • * * • • • * • * • • • • • • • • * * • 0.73
0.77 0.81 0.85 0.90 0.94 0.98 1.02 1.06
No.
1 2 3 4 5 6 7 8 9 10 11
0. 77 : * * * * * * * * * * * * * * * * * • * * * * * * * • * * * * * * * * * * * * * * * * * * * * • 0. 81 1 * * * * * * * * * * • * * * * * * * * • * * * * * * * * * * * * * * * * * * * *
0 . 85 I I * * * * ~ * * * * * * * * * * * * * * * * * * * * * * * * * * * . * * * * * * * * * * * * * 0 . 90 1 * * * * * * * * * * * * * * * * * * * * * * * * * * * * * * * * * * * * *
0 . 94 I I * * * * * * * * * * * * * * * * * * * * * * * * * * * 0 . 98 I * * * * * * * * * * * * * * * * * * * *
I 1. 02 I**
1. 06 :
*.
1.11 L.·~-- --- --- -- --- - - - ---
NORMAL : 1. 915 to 2. 707
Range Midpoint Freq. Cumul.
0.641 - 0.684 0.663 3 3
0.684 - 0.726 0.705 8 11
0. 726 - 0.768 0.747 19 30
0.768 - 0.811 0.789 16 46
0.811 - 0.853 0.832 18 64
0.853 - 0.895 0.874 15 79
0.895 - 0.937 0.916 11 90
0.937 - 0.980 0.959 8 98
0.980 - 1.022, 1.001 1 99
1.022 - 1.064 1.043 1 100
1.064 - 1.107 1.086 1 101
Fig. 1 . Example of AIC results and its histogram
N 101
Mean 0.823
SD 0.088
Min. 0.642
Max. 1.065
Range 0.423 Skew. 0.167 Kurt. 2.585
% Cumul.
2.9 10.8 29.7 45.5 63.3 78.2 89.1 97.0 98.0 99.0 100.0
2.7 2.5
2. 3
---===
t) / / - - - /
;:::s
~
~ 2.1
1.9
···Male -Female
1. 7 '---+--+---+---~
20 30 40 50 60
2.9 2.7
Age Female
....
2.9 2.7 2.5
2.1 1.9 1.7
Male
1. 5 L - . . . . o - - - - + - - - t - -
2.9 2.7 2.5
20 30 40 50 60 Age ALL
t) 2.3
2.5
t t
£
::~/ -- --
g 2.31.7
1. 5 1 - - + - - 1 - - - t - - - i - - + -
20 30 40 50 60 Age
~
~ 2.1 1.9 1.7
1. 5 ~---_..._ _ _ M F Total Sex
Age
Fig. 2. Fructosamine distribution curve and reference ranges by age groups and sex
Table 3. Reference ranges of serum fructosamine by age groups and sex
Age N Male N Female
20-29 50 1. 782-2.599 33 1. 764-2.509
(2.1905±0.204) (2 .1277 ± 0 .1906)
30-39 101 1. 915-2.707 90 1.838-2.688
(2. 311 ± 0 .198) (2.263 ±0.2125)
40-49 55 1. 937-2.785 71 1.883-2.558
(2.361 +0.212) (2. 2205± 0 .1685)
50-59 45 1.887-2.874 60 1.859-2.761
(2. 3805± 0. 246) (2.310 ±0.225 )
60~ 24 1. 856-2.965 18 1.800-2.857
(2. 4105± 0. 277) (2. 3285± 0. 2642) Sub Total 275 1.868-2.776 272 1.855-2.693
(2. 322 ± 0. 277) (2. 27 4 ± 0. 2095)
Total 547 1.860-2.737
(2. 298± 0. 219)
Table 4. Analysis of variance data obtained as a function of age groups and sex
Source of Variation Sum of Squares DF Mean Square F Signif of F*
Main Effects 1.114 5 0.223 4.575 0.000
Sex 0.341 1 0.341 7.008 0.008
Age 0.855 4 0.214 4.391 0.002
2-way Interacton 0.481 4 0.120 '2.468 0.044
Sex Age 0.481 4 0.120 2.468 0.044
Explained 1.595 9 0.177 3.639 0.000
Residual 26.153 537 0.049
Total 27.748 546 0.051
* P<0.05
IV. Discussion fasting state are not needed 12- 13).
Previous studies have adressed the methods and significance for measurement of serum fructos- amine1-3). Assay of serum fructosamine has cert- ain advantages over the established measures for diabetic screening and for assessment of diabetic control 5-7). In stead of the measurement of glucose alone, fructosamine provides not only an indicat- ion of integrated glycemia but also samples from
Technical brochures that give reference ranges for a method may also encourage the laboratory to develop its own intervals. Unfortunatly, it isn't always clear how to obtain the necessary variety of subjects of both sexes and of various ages, relevant ethnic backgrounds, and so forth who are free of conditions that might influence the measu- rement under study4).
Moreover, most such recent and past studies
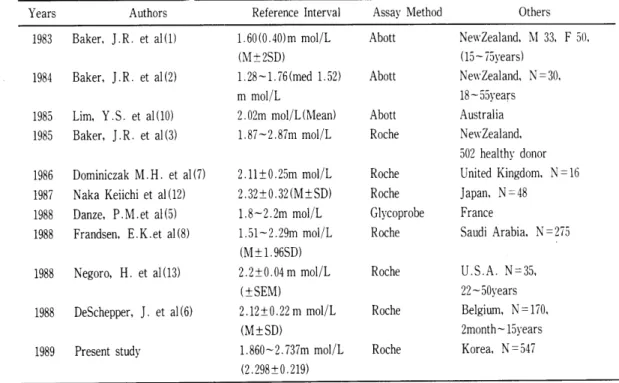
Table 5. The fructosamine concentration in reference groups by different investigators
Years Authors Reference Interval Assay Method Others
1983 Baker, J .R. et al(l) 1. 60 (0 .40) m mol/L Abott NewZealand, M 33. F 50,
(M±2SD) (15-75years)
1984 Baker, J. R. et a! (2) 1.28-1.76(med 1.52) Abott New Zealand, N=30,
m mol/L 18-55years
1985 Lim, Y.S. et al(10) 2. 02m mol/L (Mean) Abott Australia 1985 Baker, J .R. et al(3) 1.87-2 .87m mol/L Roche New Zealand,
502 healthy donor 1986 Dominiczak M. H. et a! (7) 2 .11 ± 0 . 25m mol/L Roche United Kingdom. N=16 1987 Naka Keiichi et al(12) 2.32±0.32(M±SD) Roche japan, N =48
1988 Danze, P.M. et al (5) 1.8-2. 2m mol/L Glycoprobe France
1988 Frandsen. E.K.et al(8) 1. 51-2. 29m mol/L Roche Saudi Arabia, N=275 (M±l.96SD)
1988 Negoro, H. et al (13) 2.2±0.04 m mol/L Roche U.S.A. N=35,
(±SEM) 22-50years
1988 DeSchepper, ] . et a! ( 6) 2.12±0.22 m mol/L Roche Belgium, N = 170,
(M±SD) 2month- 15years
1989 Present study 1. 860-2. 737m mol/L Roche Korea, N = 547 (2.298±0.219)
have employed gaussian statistics to analyze data derived from a normal population, but clinical laboratory data do not always follow a normal frequency distribution.
Many transformations to achieve a gaussian distribution have been proposed in the literatu-
re4,ll.l4).
In conclusion, the fructosamine raw data have been treated by x, Log and Power transformation-
The most predominant distribution shown for fructosamine data in all the age groups of both sexes except 20-29 years and 50-59 years in fem- ale was Log transformation. The reference inter-
val of the total both sexes combined was 1. 86-2.
73 m mol/L. Male showed significantly higher intervals than that of female in all the age groups of both sexes.
The trend of value increased in all the age groups as they grew older.
Values obtained through the study consistent with those in the literatures for comparable meth- odologies(Table 5).
This study demonstrated the importance of confirming the reference intervals suggested by the others and of establishing one's own reference intervals, if these are appropriate.
Reference Intervals for Fructosamine among some Healthy Korean
Chang Kyou Lee*, Choong Bin Kim** and Eun Byung Park***
Dept. of Medical Technology, College of Allied Health Sciences, Korea University, Seoul, Korea
**Dept. of Clinical Pathology, Koryo General Hospital, Seoul, Korea
***Dept. of Medical Technology, Shin Heung Health junior College, Kyungkido, Korea
ABSTRACT
The chemical components of the human body are subjected to vary by physiological processes, genetic differences, diseases and various environ- mental factors. Therefore, separate reference values of the chemincal components for sex, age groups and other criteria are needed.
Glycated hemoglobin is generally measured for
the assessment of glycemic control in diabetes mellitus. Recently, however, the method for the measurement of glycated serum protein has drawn increasing attention.
This study was udertaken to establish reference ranges for concentration of fructosamine among some healthy Korean and to compare this result with other reports.
REFERENCES
1. Baker JR, O'Cconnor JP. Metcalf P A, Laws- on MR, Johnson RN. Clinical usefulness of estimation of serum fructosamine concentr- ation as a screening test for diabetes mellitus.
Br Med J 1983:287:863-7.
2. Baker JR, Johnson RN, Scott DJ. Serum fructosamine concentrations in patients with type II (non-insulin-dependent) diabetes mell-
itus during changes in management. Br Med J 1984 ; 288: 1484-6.
3. Baker JR, Metcalf PA, Johnson RN, Newm- an D, Rietz P. Use of protein-based standar- ds in automated colorimetric determinations of fructosamine in serum. Clin Chern 1985 ; 31 : 1550-1554.
4. Boyd JC, Lacher DA. A multi-stage gaussian
transformation algorithm for clinical laborat- ory data, Clin Chern 1982; 28: 1735-1941.
5. Danze PM, Rousseaux J, Dautrevaux M.
Glycoprobe fructosamine kit used with the Rotochem CF A 2, 000 Centrifugal Analyzer.
Clin Chern 1988 : 34 : 1915.
6. De Schepper J, Derde MP, Gaubert P, Gorus F. Reference values for fructosamine concen- trations in childrens sera : Influence of protei- n concentration, age and sex. Clin Chern 1988 : 34 : 2444-2447.
7. Dominiczak MH, Smith LA, MeN aught J, Paterson KR. Interrelationships between the level of glycosylated hemoglobin in normal and diabetic subjects. Clin Chern 1986 : 32 : 1087.
8. Frandsen EK, Sabagh T, Bacchus RA. Seru- m fructosamine in diabetic pregnancy. Clin Chern 1988 ; 34 : 316-319.
9. Johnson RN, Metcalf P A, Baker JR, Fructo- samine : A new approach to the estimation of
serum glycoprotein. An index of diabetic control. Clin Chim Acta 1983 : 127 : 87-95.
10. Lim YS, Staley MJ. Measurement of plasma fructosamine evaluated for monitoring diabet- es. Clin Chern 1985; 31: 731-733.
11. Linnet K. Two-stage transformation system for normalizaton of reference distributions evaluated. Clin Chern 1987 : 33 : 381-386.
12 . N aka KI. Fructosamine determinations and its clinical usefulness. Med Tech 1987 : 31 : 679-682.
13. Negoro H, Morley JE, Rosenthal MJ. Utility of serum fructosamine as a measure of glyce- mia in young and old diabetic and non-diabe- tic subjects. Am J Med 1988 : 85 : 360-364.
14. Shultz EK, Willard KE, Rich SS, Connelly DP, Critchfield GC. Improved reference-inte- rval estimation. Clin Chern 1985 : 31 : 1974-1978.
15. Tango Tashiro. Statistics for clinical laborat- ory. Tokyo : Asakura, 1986 : 103-110.