D I A B E T E S & M E T A B O L I S M J O U R N A L
This is an Open Access article distributed under the terms of the Creative Commons Attribution Non-Commercial License (http://creativecommons.org/licenses/by-nc/4.0/) which permits unrestricted non-commercial use, distribution, and reproduction in any medium, provided the original work is properly cited.
Impact of Socioeconomic Status on Health Behaviors, Metabolic Control, and Chronic Complications in Type 2 Diabetes Mellitus
So Hun Kim1,*, Seung Youn Lee1,*, Chei Won Kim1, Young Ju Suh2, Seongbin Hong1, Seong Hee Ahn1, Da Hae Seo1, Moon-Suk Nam1, Suk Chon3, Jeong-Taek Woo3, Sei Hyun Baik4, Yongsoo Park5, Kwan Woo Lee6, Young Seol Kim3, on behalf of the KNDP Study Group
1Departments of 1Internal Medicine, 2Biomedical Sciences, Inha University School of Medicine, Incheon,
3Department of Endocrinology and Metabolism, Kyung Hee University School of Medicine, Seoul,
4Department of Internal Medicine, Korea University College of Medicine, Seoul, Korea,
5Department of Molecular and Integrative Physiology, University of Illinois at Urbana-Champaign, Champaign, IL, USA,
6Department of Endocrinology and Metabolism, Ajou University School of Medicine, Suwon, Korea
Background: The aim of the study was to assess the impact of socioeconomic status (SES) on health behaviors, metabolic control, and chronic complications in people with type 2 diabetes mellitus (T2DM) from South Korea, a country with universal health in- surance coverage and that has experienced rapid economic and social transition.
Methods: A total of 3,294 Korean men and women with T2DM aged 30 to 65 years, participating in the Korean National Diabetes Program (KNDP) cohort who reported their SES and had baseline clinical evaluation were included in the current cross-sectional analysis. SES included the level of education and monthly household income.
Results: Lower education level and lower income level were closely related, and both were associated with older age in men and women. Women and men with lower income and education level had higher carbohydrate and lower fat intake. After adjustment for possible confounding factors, higher education in men significantly lowered the odds of having uncontrolled hyperglycemia (glycosylated hemoglobin ≥7.5%) (odds ratio [OR], 0.63; 95% confidence interval [CI], 0.43 to 0.91 for highest education; Ptrend= 0.048), while higher household income in men significantly lowered the odds of having diabetic retinopathy (OR, 0.59; 95% CI, 0.37 to 0.95 for highest income level; Ptrend=0.048). In women, lower income was associated with a higher stress level.
Conclusion: Men with lower SES had higher odds of having diabetic retinopathy and uncontrolled hyperglycemia, showing the need to improve care targeted to this population.
Keywords: Diabetes mellitus, type 2; Education; Income; Social class
Corresponding author: Moon-Suk Nam https://orcid.org/0000-0003-1756-8498 Division of Endocrinology and Metabolism, Department of Internal Medicine, Inha University School of Medicine, 27 Inhang-ro, Jung-gu, Incheon 22332, Korea E-mail: [email protected]
INTRODUCTION
Type 2 diabetes mellitus (T2DM) is a growing epidemic, with an estimated 415 million people with diabetes worldwide in 2015, and projected to increase to 642 million in 2040 [1]. There has also been a great increase since the 1970s in the prevalence of T2DM in Asian countries, including Korea [2]. T2DM is of-
ten accompanied by microvascular complications, and the de- velopment and progression of microvascular complications can be prevented by improved glycemic control [3]. Lifestyle factors, including a healthy diet, physical activity, maintaining a normal weight, and not smoking, are also essential in the management of T2DM [4].
Lower socioeconomic status (SES) has been shown to be as- https://doi.org/10.4093/dmj.2017.0102
pISSN 2233-6079 · eISSN 2233-6087
sociated with the development of T2DM [5]. Lower SES has also been reported to be associated with higher mortality in patients with T2DM [6]. Studies evaluating the effect of socio- economic deprivation on the prevalence of complications and glycemic control in patients with diabetes have been reported, and some have shown higher prevalence of diabetic complica- tions and poorer glycemic control [7-11]. However, this associ- ation has not been consistently seen in all studies [12], and while many studies have evaluated the impact of socioeco- nomic deprivation on prevalence or incidence of diabetes or cardiovascular risk factors in various populations, the role of SES in patients with T2DM has been less studied [5,7,13].
Although previous studies have evaluated the association between SES and diabetes care-associated parameters, few studies have evaluated glycemic control, diabetes-specific com- plications, and related health behaviors concurrently in people with T2DM. Also, since these associations may differ between different societies, there is a need to evaluate this association in Asian countries that have gone through rapid economic chang- es and urbanization in recent decades. Therefore, this study aimed to evaluate the role of socioeconomic position on glyce- mic control, microvascular complications, and health behav- iors in Korean patients with T2DM. Because many of the life- style factors and clinical parameters differ between men and women [14], the effect of SES was analyzed separately in men and women.
METHODS
Study population
The study population consisted of patients with T2DM age 30 to 65 years old who participated in the Korean National Diabe- tes Program (KNDP) cohort study. The KNDP cohort is a pro- spective, multicenter, observational study performed in Kore- an patients with T2DM and patients at high risk for diabetes that started enrollment in May 2006, and primary observation of the registered patients ended in March 2014. Study details have been published previously [15,16]. The present study pop- ulation consisted of 3,294 individuals from the KNDP cohort who were diagnosed with T2DM and were 30 to 65 years old at enrollment and had data on SES with concurrent baseline clin- ical evaluation. The study protocol was approved by the Insti- tutional Review Board of Inha University Hospital (IRB 2006- 67) and of each hospital and all participants provided written informed consent before participation.
SES, dietary assessment, and lifestyle variables
SES, dietary assessment, and lifestyle variables were collected according to a standardized questionnaire by trained research personnel. Indicators of SES used in the current study were household income and maximal education attainment. Level of education attainment was divided into three categories: less than high school, high school graduation, and college gradua- tion. Data for monthly household income were obtained by a questionnaire that consisted of multiple-choice questions cov- ering each 1,000,000 Korean won (KRW) as follows: (1) <1,000,000 KRW; (2) 1,000,000 to 2,000,000 KRW; (3) 2,000,000 to 3,000,000 KRW; (4) 3,000,000 to 4,000,000 KRW; (5) 4,000,000 to 5,000,000 KRW; and (6) >5,000,000 KRW. Monthly household income was divided into three categories after merging each two cate- gories as follows: <2,000,000 KRW (1,700 US$), 2,000,000 to 4,000,000 KRW (1,700 to 3,400 US$), and >4,000,000 KRW (3,400 US$).
For dietary intake, patients were interviewed in person by trained registered dietitians using a 24-hour dietary recall ques- tionnaire as previously described [14]. The reported dietary in- take was analyzed by the Computed Aided Nutrient Analysis Program version 3.0 (CAN-Pro 3.0; The Korean Nutrition So- ciety, Seoul, Korea) that converted food consumption records to nutrient intake. Intakes of total calories, carbohydrate, pro- tein, total fat, and fiber were assessed in the current analysis.
Energy-adjusted nutrient intakes were shown as percent of to- tal energy for protein, fat, and carbohydrates and g/1,000 kcal for dietary fiber.
Leisure time physical activity was evaluated by a question- naire that was modified from the Minnesota Leisure Time Phys- ical Activity Questionnaire (MLTPAQ) [14,17]. The total ener- gy expenditure was calculated into kcal/day as previously de- scribed [14]. Smoking habit was classified into two categories:
current smoker or not. Alcohol intake was categorized into two categories as current regular drinking or not. Stress level was evaluated by the Korean version of the Brief Encounter Psychosocial Instrument (BEPSI-K). The BEPSI-K score is the average of five closed question items, which is measured using a five-point Likert scale. A higher score indicates a higher stress level [18,19].
Anthropometric and laboratory measurements
All anthropometric measurements were standardized for all participating centers and made with participants wearing light clothing without shoes. Weight and height were measured to
the nearest 0.1 kg and 0.1 cm. Body mass index (BMI) was cal- culated as weight (kg) divided by the square of height (m). Obe- sity was defined as BMI ≥25 kg/m2 [20]. Blood pressure was measured after the subject has been at rest for at least 5 min- utes in a sitting position. Blood samples were collected after an overnight fast of at least 10 hours and was analyzed as previ- ously described [21]. Glycosylated hemoglobin (HbA1c) levels were determined by a high-performance liquid chromatogra- phy method that received National Glycohemoglobin Standard- ization Program certification. Total cholesterol, triglyceride, high density lipoprotein cholesterol (HDL-C), low density li- poprotein cholesterol (LDL-C), creatinine, and plasma glucose levels were analyzed using an automated analyzer that received a certification of quality control from the Korean Society for Laboratory Medicine.
Diabetic complications and medical history assessment Diabetic microvascular complications were assessed as previ- ously reported [22]. To identify diabetic nephropathy, albumin- uria was assessed by random urinary albumin creatinine ratio (UACR). Diabetic nephropathy with the presence of increased urinary albumin excretion was defined as UACR ≥30 mg/g Cr.
Diabetic retinopathy was diagnosed by funduscopic examina- tion.
Statistical analysis
Differences of clinical and laboratory variables between men and women were analyzed by Mann-Whitney U test and chi- square test for continuous and categorical variables, respective- ly. The association between education level or income level and baseline clinical and laboratory data were assessed separately in men and women. To assess the trend of variables according to education level or income level, spearman correlation was used for continuous variables, and Mantel-Haenszel test of trend was used for categorical variables. Partial spearman cor- relation was used to assess trend of continuous variables after adjustment for age, duration, or other relevant factors. Logistic regression analyses were performed to evaluate the impact of lower education and income levels on risks of binary variables, including uncontrolled hyperglycemia, obesity, and diabetic retinopathy after adjustment of confounding factors. All analy- ses were performed with SPSS version 19 (IBM Co., Armonk, NY, USA). Statistical significance was defined as P<0.05.
RESULTS
General characteristics of the population
The study population comprised 1,927 men (58.5%) and 1,367 women (41.5%). Median age was 52 years (interquartile range [IQR], 46 to 58 years), diabetes duration was 4 years (IQR, 1 to 10 years), BMI 25.0 kg/m2 (IQR, 23.0 to 27.1 kg/m2), and HbA1c 7.4% (IQR, 6.6% to 8.8%). Men had higher education and high- er household income than women. Compared to men, women had older age, lower systolic and diastolic blood pressure, fast- ing plasma glucose (FPG), triglyceride, and higher HDL-C and LDL-C levels. Women had lower energy, protein and fat intake, and higher carbohydrate and fiber intake than men. Women had lower UACR, lower rates of current drinking, smoking, and albuminuria (Supplementary Table 1).
Characteristics according to education and household income level in men
In men, 424 (22.1%) had an education level of less than high school, 739 of high school graduation (38.5%), and 758 of col- lege graduation (39.5%). Higher education level was associated with younger age, higher income, more current drinking, and lower 2-hour postprandial glucose (PPG), HbA1c, and UACR.
Patients with higher education level had a higher stress level, higher fat intake, and lower carbohydrate and fiber intake. There was no significant association between education level and lei- sure time physical activity, current smoking, or medication use in men. Those with higher education level had lower rates of diabetic retinopathy, albuminuria, and uncontrolled hypergly- cemia (HbA1c ≥7.5%). After adjustment for age, diabetes du- ration, and household income level, higher education level was significantly associated with lower 2-hour PPG and HbA1c level and higher fat intake and lower rate of uncontrolled hy- perglycemia (Table 1).
In men, 516 (28.1%) had a household income of <2 million KRW, 679 (37.0%) had an income of 2 million to 4 million KRW, and 642 (34.9%) had a household income of >4 million KRW.
Higher income level was associated with younger age, higher education level, more current drinking, higher BMI and dia- stolic blood pressure, and lower 2-hour PPG, HbA1c, and UACR.
Patients with higher household income had higher intake of energy, protein, and fat and a lower intake of carbohydrate and fiber. Patients with higher household income had less use of insulin, while statin use was more prevalent. Higher household income was associated with a higher rate of obesity and lower
prevalence of diabetic retinopathy, albuminuria, and uncon- trolled hyperglycemia. After adjustment for age, diabetes dura- tion, and education level, higher household income level was
significantly associated with higher current drinking rate, high- er BMI and diastolic blood pressure, and lower HbA1c and UACR. Associations between income and protein intake, fiber Table 1. Clinical and laboratory characteristics according to education in men
Characteristic Less than high school High school graduation College graduation P valuea P valueb
Number 424 (22.1) 739 (38.5) 758 (39.5)
Age, yr 55 (50–60) 51 (45–57) 48 (42–54) <0.001
DM duration, yr 5 (0.8–10) 3 (1–9) 4 (1–9) 0.235
Monthly household income, % <0.001
<1,700 US$ 61.8 29.4 8.5
1,700–3,400 US$ 28.1 44.9 33.8
>3,400 US$ 10.1 25.6 57.6
Current drinking, % 66.0 73.9 75.4 0.001 0.359
Current smoking, % 33.0 42.0 37.7 0.276 0.076
BMI, kg/m2 24.8 (22.9–26.7) 25.0 (23.1–26.9) 25.1 (23.3–27.1) 0.061 0.438
SBP, mm Hg 125 (116–135) 125 (117–134) 126 (118–135) 0.852 0.912
DBP, mm Hg 80 (70–86) 80 (72–85) 80 (72–86) 0.256 0.252
Fasting plasma glucose, mg/dL 137 (116–174) 139 (120–175) 138 (118–167) 0.621 0.071
2-Hour postprandial glucose, mg/dL 275 (203–360) 252 (178–327) 237 (171–311) <0.001 0.004
HbA1c, % 7.5 (6.6–9.2) 7.5 (6.7–8.9) 7.2 (6.5–8.7) 0.004 0.008
Triglyceride, mg/dL 131 (87–192.3) 139 (91–214) 147 (97–205) 0.084 0.911
HDL-C, mg/dL 44 (38–53) 45 (38–53) 44 (38–52) 0.829 0.313
LDL-C, mg/dL 99.4 (77.8–123.2) 99.8 (77.3–124.0) 101.0 (78.0–123.1) 0.968 0.869
UACR, mg/g Cr 12.0 (5.4–47.2) 11.3 (5.4–31.9) 9.8 (5.4–24.8) 0.039 0.718
LTPA, kcal/day 292.7 (139.4–509.2) 252.7 (124.3–421.2) 260.6 (135.3–447-7) 0.406 0.857
BEPSI score 1.6 (1.0–2.2) 1.6 (1.0–2.2) 1.8 (1.2–2.2) 0.046 0.505
Energy intake, kcal/day 1,908.5 (1,674.4–2,152.3) 1,901.4 (1,677.0–2,177.0) 1,951.9 (1,706.8–2,154.4) 0.177 0.092 Protein intake, % energy 16.8 (14.6–18.8) 17.1 (15.0–19.2) 17.1 (15.0–19.3) 0.168 0.894 Carbohydrate intake, % energy 60.9 (55.3–66.9) 59.2 (25.8–64.4) 57.8 (50.7–63.5) <0.001 0.151 Fat intake, % energy 20.7 (16.4–25.4) 22.2 (17.7–27.1) 23.3 (19.3–28.2) <0.001 0.027 Fiber intake, g/1,000 kcal 14.4 (11.3–17.4) 14.4 (11.6–17.5) 13.6 (11.0–16.5) 0.002 0.161
Insulin use, % 20.3 18.9 17.2 0.210 0.815
Diabetic retinopathy, % 22.2 20.4 16.9 0.036 0.822
Albuminuria, % 30.6 26.7 21.2 0.001 0.321
Uncontrolled hyperglycemia
(HbA1c ≥7.5%), % 49 49.1 40.8 0.002 0.014
Obesity, % 47.9 51.2 51.9 0.207 0.484
Values are presented as number (%) or median (interquartile range).
DM, diabetes mellitus; BMI, body mass index; SBP, systolic blood pressure; DBP, diastolic blood pressure; HbA1c, glycosylated hemoglobin;
HDL-C, high density lipoprotein cholesterol; LDL-C, low density lipoprotein cholesterol; UACR, urinary albumin creatinine ratio; LTPA, lei- sure time physical activity; BEPSI, Brief Encounter Psychosocial Instrument.
aP values were calculated by Spearman’s correlation for continuous variables and Mantel-Haenszel test of trend for categorical variables, bPartial Spearman’s correlation and logistic regression was used to calculate P values after adjustment for age, diabetes duration, and income.
intake, and albuminuria were not significant after adjustment, while associations between income and energy intake, carbo- hydrate and fat intake, use of insulin and statin, presence of di-
abetic retinopathy, and uncontrolled hyperglycemia and obesi- ty remained significant (Table 2).
Table 2. Clinical and laboratory characteristics according to monthly household income in men
Characteristic <1,700 US$ 1,700–3,400 US$ >3,400 US$ P valuea P valueb
Number 516 (28.1) 679 (37.0) 642 (34.9)
Age, yr 55 (48–61) 50 (44–55) 49 (44–54) <0.001
DM duration, yr 4 (1–10) 3 (0–8) 4 (1–9) 0.725
Education level
Less than high school 47.4 16.4 6.2
High school graduation 40.6 47.2 28.4
College graduation 12 36.4 65.4
Current drinking, % 65.0 75.5 77.0 <0.001 0.005
Current smoking, % 35.2 42.2 37 0.635 0.709
BMI, kg/m2 24.5 (22.5–26.5) 25.3 (23.3–27.0) 25.2 (23.5–27.1) <0.001 0.001
SBP, mm Hg 123 (115–132) 126 (117–135) 127 (119–135) 0.050 0.099
DBP, mm Hg 80 (70–82) 80 (73–87) 80 (73–86) <0.001 0.004
Fasting plasma glucose, mg/dL 139 (117–176) 138 (120–176) 138 (119–166) 0.369 0.252
2-Hour postprandial glucose, mg/dL 270 (194–346) 244 (186–320) 237 (168–319) 0.002 0.068
HbA1c, % 7.6 (6.6–9.3) 7.3 (6.6–8.9) 7.2 (6.5–8.6) <0.001 0.003
Triglyceride, mg/dL 131 (85–198) 147 (98–219) 137 (90–199) 0.504 0.524
HDL-C, mg/dL 44 (37–52) 44 (38–52) 45 (38–53) 0.125 0.063
LDL-C, mg/dL 100 (76.6–123.5) 101.4 (80.4–123.3) 99.0 (77.4–124.5) 0.783 0.707
UACR, mg/g Cr 12.0 (5.4–39.3) 10.9 (5.4–32.2) 9.6 (5.0–24.5) 0.006 0.009
LTPA, kcal/day 295.2 (138.1–477.4) 237.5 (118.4–414.2) 270.2 (135.3–438.3) 0.260 0.843
BEPSI score 1.6 (1.2–2.2) 1.6 (1.2–2.2) 1.6 (1.2–2.2) 0.666 0.318
Energy intake, kcal/day 1,840.0 (1,647.6–2,093.1) 1,930.1 (1,711.8–2,187.2) 1,967.0 (1,716.3–2,178.7) <0.001 <0.001 Protein intake, % energy 16.7 (14.8–18.8) 17.1 (14.9–19.1) 17.2 (15.1–19.4) 0.028 0.105 Carbohydrate intake, % energy 61.2 (55.8–67.3) 58.9 (52.3–64.2) 57.2 (49.9–63.2) <0.001 <0.001 Fat intake, % energy 20.6 (16.4–25.6) 22.4 (18.3–27.3) 23.5 (18.9–28.5) <0.001 0.002 Fiber intake, g/1,000 kcal 14.7 (11.5–17.8) 13.8 (11.4–16.9) 13.8 (11.1–16.6) 0.008 0.805
Insulin use, % 22.5 19 13.7 <0.001 0.002
Diabetic retinopathy, % 28.1 17.2 14.7 <0.001 <0.001
Albuminuria (%) 29 26.7 20.6 0.004 0.083
Uncontrolled hyperglycemia
(HbA1c ≥7.5%), % 51.1 45.3 41.7 0.002 0.045
Obesity 42.9 54.7 53.8 <0.001 0.003
Values are presented as number (%) or median (interquartile range).
DM, diabetes mellitus; BMI, body mass index; SBP, systolic blood pressure; DBP, diastolic blood pressure; HbA1c, glycosylated hemoglobin;
HDL-C, high density lipoprotein cholesterol; LDL-C, low density lipoprotein cholesterol; UACR, urinary albumin creatinine ratio; LTPA, lei- sure time physical activity; BEPSI, Brief Encounter Psychosocial Instrument.
aP values were calculated by Spearman’s correlation for continuous variables and Mantel-Haenszel test of trend for categorical variables, bPartial Spearman’s correlation and logistic regression was used to calculate P values after adjustment for age, diabetes duration, and education.
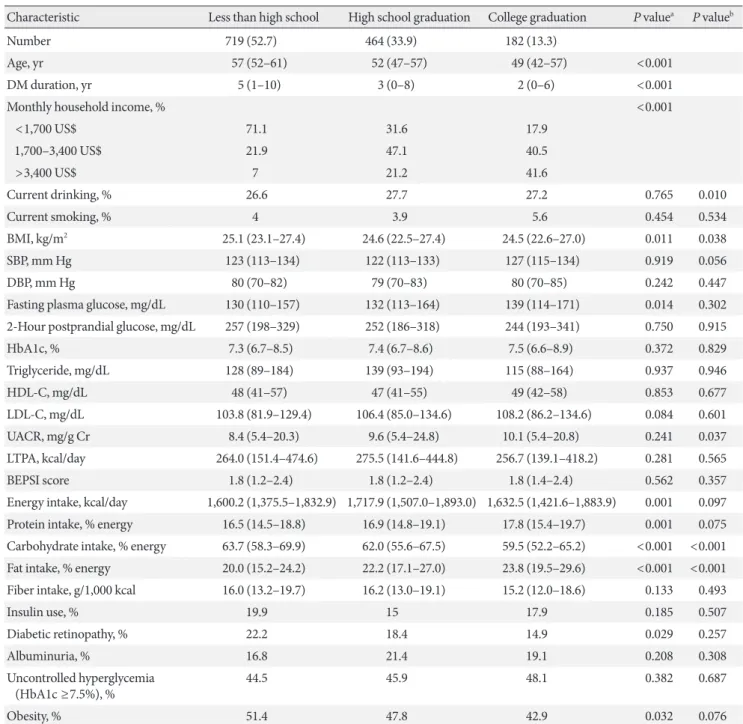
Characteristics according to education and household income level in women
In women, 719 (52.7%) had an education level of less than high
school, 464 of high school graduation (33.9%), and 182 of col- lege graduation (13.3%). Those with higher education level had younger age, shorter diabetes duration, higher household in-
Table 3. Clinical and laboratory characteristics according to education in women
Characteristic Less than high school High school graduation College graduation P valuea P valueb
Number 719 (52.7) 464 (33.9) 182 (13.3)
Age, yr 57 (52–61) 52 (47–57) 49 (42–57) <0.001
DM duration, yr 5 (1–10) 3 (0–8) 2 (0–6) <0.001
Monthly household income, % <0.001
<1,700 US$ 71.1 31.6 17.9
1,700–3,400 US$ 21.9 47.1 40.5
>3,400 US$ 7 21.2 41.6
Current drinking, % 26.6 27.7 27.2 0.765 0.010
Current smoking, % 4 3.9 5.6 0.454 0.534
BMI, kg/m2 25.1 (23.1–27.4) 24.6 (22.5–27.4) 24.5 (22.6–27.0) 0.011 0.038
SBP, mm Hg 123 (113–134) 122 (113–133) 127 (115–134) 0.919 0.056
DBP, mm Hg 80 (70–82) 79 (70–83) 80 (70–85) 0.242 0.447
Fasting plasma glucose, mg/dL 130 (110–157) 132 (113–164) 139 (114–171) 0.014 0.302
2-Hour postprandial glucose, mg/dL 257 (198–329) 252 (186–318) 244 (193–341) 0.750 0.915
HbA1c, % 7.3 (6.7–8.5) 7.4 (6.7–8.6) 7.5 (6.6–8.9) 0.372 0.829
Triglyceride, mg/dL 128 (89–184) 139 (93–194) 115 (88–164) 0.937 0.946
HDL-C, mg/dL 48 (41–57) 47 (41–55) 49 (42–58) 0.853 0.677
LDL-C, mg/dL 103.8 (81.9–129.4) 106.4 (85.0–134.6) 108.2 (86.2–134.6) 0.084 0.601
UACR, mg/g Cr 8.4 (5.4–20.3) 9.6 (5.4–24.8) 10.1 (5.4–20.8) 0.241 0.037
LTPA, kcal/day 264.0 (151.4–474.6) 275.5 (141.6–444.8) 256.7 (139.1–418.2) 0.281 0.565
BEPSI score 1.8 (1.2–2.4) 1.8 (1.2–2.4) 1.8 (1.4–2.4) 0.562 0.357
Energy intake, kcal/day 1,600.2 (1,375.5–1,832.9) 1,717.9 (1,507.0–1,893.0) 1,632.5 (1,421.6–1,883.9) 0.001 0.097 Protein intake, % energy 16.5 (14.5–18.8) 16.9 (14.8–19.1) 17.8 (15.4–19.7) 0.001 0.075 Carbohydrate intake, % energy 63.7 (58.3–69.9) 62.0 (55.6–67.5) 59.5 (52.2–65.2) <0.001 <0.001 Fat intake, % energy 20.0 (15.2–24.2) 22.2 (17.1–27.0) 23.8 (19.5–29.6) <0.001 <0.001 Fiber intake, g/1,000 kcal 16.0 (13.2–19.7) 16.2 (13.0–19.1) 15.2 (12.0–18.6) 0.133 0.493
Insulin use, % 19.9 15 17.9 0.185 0.507
Diabetic retinopathy, % 22.2 18.4 14.9 0.029 0.257
Albuminuria, % 16.8 21.4 19.1 0.208 0.308
Uncontrolled hyperglycemia
(HbA1c ≥7.5%), % 44.5 45.9 48.1 0.382 0.687
Obesity, % 51.4 47.8 42.9 0.032 0.076
Values are presented as number (%) or median (interquartile range).
DM, diabetes mellitus; BMI, body mass index; SBP, systolic blood pressure; DBP, diastolic blood pressure; HbA1c, glycosylated hemoglobin;
HDL-C, high density lipoprotein cholesterol; LDL-C, low density lipoprotein cholesterol; UACR, urinary albumin creatinine ratio; LTPA, lei- sure time physical activity; BEPSI, Brief Encounter Psychosocial Instrument.
aP values were calculated by Spearman’s correlation for continuous variables and Mantel-Haenszel test of trend for categorical variables, bPartial Spearman’s correlation and logistic regression was used to calculate P values after adjustment for age, diabetes duration, and income.
come, lower BMI, and higher FPG level. Higher education lev- el was associated with higher energy, protein, and fat intake and lower carbohydrate intake. Higher education level was as-
sociated with lower use of sulfonylurea and renin angiotensin aldosterone system inhibitors (angiotensin converting enzyme inhibitors or angiotensin receptor blocker) and lower preva-
Table 4. Clinical and laboratory characteristics according to monthly household income in women
Characteristic <1,700 US$ 1,700–3,400 US$ >3,400 US$ P valuea P valueb
Number 637 (50.4) 418 (33.0) 210 (15.4)
Age, yr 57 (51–61) 51 (46–57) 52 (45–57) <0.001
DM duration, yr 4 (1–10) 4 (1–8) 2 (0–7) 0.001
Education level <0.001
Less than high school 75.8 36.9 23.4
High school graduation 19.5 45.6 42.0
College graduation 4.8 17.4 34.6
Current drinking, % 25.2 30.0 27.6 0.262 0.899
Current smoking, % 4.5 3.6 3.8 0.554 0.502
BMI, kg/m2 25.1 (23.0–27.5) 24.7 (22.8–27.4) 24.7 (22.8–27.3) 0.127 0.586
SBP, mm Hg 124 (115–136) 123 (113–132) 125 (110–133) 0.132 0.582
DBP, mm Hg 80 (70–82) 80 (70–83) 80 (70–85) 0.595 0.905
Fasting plasma glucose, mg/dL 132 (111–159) 137 (116–171) 130 (112–154) 0.506 0.405
2-Hour postprandial glucose, mg/dL 251 (183–319) 260 (201–337) 238 (171–306) 0.993 0.651
HbA1c, % 7.3 (6.6–8.5) 7.6 (6.7–8.8) 7.3 (6.7–8.3) 0.377 0.362
Triglyceride, mg/dL 133 (90–186) 131 (92–176) 126 (88–194) 0.670 0.693
HDL-C, mg/dL 47 (40–57) 48 (42–56) 47 (41–55) 0.637 0.482
LDL-C, mg/dL 104 (83–128) 108 (85–136) 104 (85–132) 0.161 0.630
UACR, mg/g Cr 9.5 (5.7–21.8) 8.9 (5.2–23.2) 10.1 (5.4–21.8) 0.615 0.098
LTPA, kcal/day 255.3 (149.9–459.4) 290.7 (155.3–473.7) 242.9 (93.3–457.6) 0.466 0.844
BEPSI score 1.8 (1.2–2.6) 1.8 (1.2–2.2) 1.6 (1.2–2.4) 0.025 <0.001
Energy intake, kcal/day 1,617.7 (1,402.8–1,866.4) 1,622.7 (1,456.1–1,879.3) 1,659.0 (1,481.6–1,865.6) 0.055 0.810 Protein intake, % energy 16.4 (14.4–18.5) 17.0 (15.0–19.5) 17.9 (15.2–19.8) <0.001 <0.001 Carbohydrate intake, % energy 64.0 (58.1–70.0) 61.6 (56.3–67.5) 60.4 (53.4–64.7) <0.001 0.001 Fat intake, % energy 20.0 (15.1–24.6) 21.9 (16.7–26.7) 23.3 (18.8–28.2) <0.001 0.012 Fiber intake, g/1,000 kcal 15.7 (12.9–19.2) 16.1 (13.1–19.7) 16.0 (12.4–19.3) 0.402 0.100
Insulin use, % 19.9 15.4 12.3 0.010 0.068
Diabetic retinopathy, % 21.8 18.9 17.4 0.162 0.675
Albuminuria, % 18.5 20.6 16.6 0.800 0.453
Uncontrolled hyperglycemia
(HbA1c ≥7.5%), % 43.8 50 40.4 0.939 0.151
Obesity, % 51.5 48 48.3 0.296 0.857
Values are presented as number (%) or median (interquartile range).
DM, diabetes mellitus; BMI, body mass index; SBP, systolic blood pressure; DBP, diastolic blood pressure; HbA1c, glycosylated hemoglobin;
HDL-C, high density lipoprotein cholesterol; LDL-C, low density lipoprotein cholesterol; UACR, urinary albumin creatinine ratio; LTPA, lei- sure time physical activity; BEPSI, Brief Encounter Psychosocial Instrument.
aP values were calculated by Spearman’s correlation for continuous variables and Mantel-Haenszel test of trend for categorical variables, bPartial Spearman’s correlation and logistic regression was used to calculate P values after adjustment for age, diabetes duration, and education.
lence of diabetic retinopathy and obesity. After adjustment for age, diabetes duration, and household income level, higher ed- ucation level was significantly associated with higher rate of current drinking, lower BMI, higher UACR, lower carbohy- drate intake, and higher fat intake. The associations between household income and medication use, diabetic retinopathy, and obesity were attenuated after adjustment (Table 3).
In women, 637 (50.4%) had an income level of <2,000,000 KRW, 418 (33%) had an income level of 2,000,000 to 4,000,000 KRW, and 210 (15.4%) had an income level of >4,000,000 KRW.
Higher income level was associated with younger age, shorter diabetes duration, higher education attainment, lower stress level, higher protein and fat intake, lower carbohydrate intake, and less insulin use. After adjustment for age, diabetes dura- tion, and education level, patients with higher household in- come was significantly associated with lower stress level, high-
er protein and fat intake, and lower carbohydrate intake (Table 4). The higher stress level in lower-income patients was signifi- cant after further adjustment for current drinking, smoking, energy intake, carbohydrate intake, fat intake, and insulin use (ρ=–0.093, P=0.004 by partial spearman correlation analysis).
SES and uncontrolled hyperglycemia, obesity, and retinopathy
Since the prevalence of uncontrolled hyperglycemia, obesity, and diabetic retinopathy were significantly associated with SES in men, the association was evaluated with further adjustment for confounding factors. Logistic regression analysis, after ad- justing for education or income level, age, diabetes duration, smoking, and drinking (Model 1), showed that lower educa- tion level conferred a significant risk of uncontrolled hypergly- cemia in men. The highest education level (college graduation)
Table 5. Odds ratios of education and income levels on uncontrolled hyperglycemia and obesity by gender
Education level Income level
Less than
high school High school
graduation College
graduation P valuea <1,700
US$ 1,700–3,400 US$ >3,400 US$ P valuea Uncontrolled hyperglycemia (HbA1c ≥7.5%)
Men
Model 1 1.000 0.977 (0.740–1.289) 0.710 (0.522–0.907) 0.021 1.000 0.773 (0.593–1.008) 0.747 (0.560–0.997) 0.097 Model 2 1.000 0.926 (0.685–1.253) 0.691 (0.493–0.968) 0.043 1.000 0.890 (0.665–1.193) 0.897 (0.653–1.232) 0.719 Model 3 1.000 0.776 (0.556–1.082) 0.628 (0.433–0.910) 0.048 1.000 0.917 (0.664–1.267) 0.856 (0.599–1.221) 0.691 Women
Model 1 1.000 0.959 (0.716–1.285) 1.155 (0.762–1.752) 0.658 1.000 1.260 (0.940–1.688) 0.914 (0.629–1.329) 0.147 Model 2 1.000 0.956 (0.697–1.310) 1.252 (0.796–1.970) 0.468 1.000 1.364 (0.993–1.872) 0.976 (0.648–1.470) 0.096 Model 3 1.000 1.053 (0.750–1.478) 1.328 (0.813–2.170) 0.515 1.000 1.134 (0.805–1.600) 0.911 (0.589–1.409) 0.556 Obesity
Men
Model 1 1.000 0.954 (0.724–1.258) 0.853 (0.627–1.159) 0.532 1.000 1.489 (1.145–1.936) 1.513 (1.135–2.017) 0.006 Model 2 1.000 1.030 (0.770–1.377) 0.898 (0.650–1.240) 0.558 1.000 1.406 (1.065–1.857) 1.410 (1.040–1.911) 0.037 Model 3 1.000 1.093 (0.797–1.499) 0.900 (0.633–1.278) 0.372 1.000 1.295 (0.955–1.755) 1.227 (0.877–1.717) 0.246 Women
Model 1 1.000 0.889 (0.668–1.183) 0.645 (0.427–0.974) 0.114 1.000 0.914 (0.686–1.220) 0.915 (0.635–1.317) 0.804 Model 2 1.000 0.866 (0.641–1.170) 0.666 (0.430–1.031) 0.186 1.000 0.909 (0.672–1.230) 0.848 (0.575–1.251) 0.676 Model 3 1.000 0.844 (0.611–1.165) 0.726 (0.453–1.165) 0.362 1.000 0.882 (0.636–1.223) 0.803 (0.531–1.214) 0.547 Values are presented as adjusted odds ratios (95% confidence interval) for logistic regression. Model 1: adjustment for age, duration, smoking, drinking, and education or income level; Model 2: adjustment for age, duration, smoking, drinking, education or income level, and insulin use;
Model 3: adjustment for age, duration, smoking, drinking, education or income level, insulin use, energy intake, and carbohydrate and fat intake.
HbA1c, glycosylated hemoglobin.
aP values were calculated by the trend test.
was associated with 29% lower odds of having uncontrolled hyperglycemia compared with the lowest education level (less than high school) (95% confidence interval [CI], 0.52 to 0.97;
Ptrend=0.021) (Table 5). After further adjustment for insulin use, energy intake, and carbohydrate and fat intake (Model 3), lower education level maintained its significance as a risk fac- tor of uncontrolled hyperglycemia in men (odds ratio, 0.63;
95% CI, 0.43 to 0.91) for highest education level compared to lowest (Ptrend=0.048) (Table 5). In contrast, there was no signif- icant association between SES and uncontrolled hyperglyce- mia in women.
Men with higher income level were found to have a greater risk of obesity after adjustment for age, duration, current smok- ing, current drinking, and education level (Model 1). A house- hold income of >4,000,000 KRW was associated with a 1.51- fold increase in the odds of obesity compared to a household income of <2,000,000 KRW (95% CI, 1.14 to 2.02; Ptrend=0.006).
This association was significant after further adjustment for in- sulin use (Model 2) but was attenuated after further adjustment for dietary factors (Model 3) (Table 5). In women, there were no significant association between SES and obesity.
For diabetic retinopathy, men with lower income level showed a higher risk for having diabetic retinopathy after adjustment for age, duration, education level, current smoking, and drink-
Table 6. Odd ratios of education and income levels on diabetic retinopathy by gender
Education level Income level
Less than
high school High school
graduation College
graduation P valuea <1,700
US$ 1,700–3,400 US$ >3,400 US$ P valuea Men
Model 1 1.000 1.146 (0.772–1.703) 1.143 (0.729–1.792) 0.782 1.000 0.533 (0.367–0.774) 0.452 (0.298–0.687) <0.001 Model 2 1.000 1.165 (0.768–1.767) 1.155 (0.720–1.855) 0.762 1.000 0.541 (0.366–0.800) 0.483 (0.311–0.750) 0.002 Model 3 1.000 1.152 (0.758–1.751) 1.171 (0.727–1.885) 0.770 1.000 0.542 (0.366–0.804) 0.487 (0.313–0.758) 0.002 Model 4 1.000 1.105 (0.715–1.707) 1.046 (0.635–1.723) 0.894 1.000 0.624 (0.410–0.948) 0.593 (0.370–0.949) 0.048 Women
Model 1 1.000 1.000 (0.659–1.518) 0.602 (0.308–1.177) 0.277 1.000 0.938 (0.618–1.424) 1.197 (0.687–2.085) 0.691 Model 2 1.000 0.895 (0.577–1.388) 0.529 (0.259–1.081) 0.215 1.000 1.029 (0.661–1.602) 1.435 (0.809–2.546) 0.433 Model 3 1.000 0.869 (0.557–1.355) 0.510 (0.247–1.053) 0.190 1.000 1.066 (0.681–1.668) 1.399 (0.780–2.510) 0.522 Model 4 1.000 1.042 (0.648–1.675) 0.580 (0.272–1.239) 0.272 1.000 1.019 (0.628–1.653) 1.425 (0.778–2.610) 0.471 Values are presented as adjusted odds ratios (95% confidence interval) for logistic regression. Model 1: adjustment for age, duration, education or income level, smoking, and drinking; Model 2: adjustment for age, duration, education or income level, current smoking, current drinking, and insulin use; Model 3: adjustment for age, duration, education or income level, smoking, drinking, insulin use, glycosylated hemoglobin (HbA1c), systolic blood pressure (BP), and diastolic BP; Model 4: adjustment for age, duration, education or income level, smoking, drinking, insulin use, HbA1c, systolic BP, diastolic BP, energy intake, and carbohydrate and fat intake.
aP values were calculated by the trend test.
ing (Model 1, Ptrend<0.001). After further adjustment for insu- lin use (Model 2), HbA1c, systolic blood pressure, diastolic blood pressure (Model 3), energy intake, and carbohydrate and fat intake (Model 4), this association remained significant. Com- pared to an income of <2,000,000 KRW, an income of 2,000,000 to 4,000,000 KRW, and >4,000,000 KRW were associated with a 38% and 41%, respectively, lower odds of having diabetic ret- inopathy after adjustment (Model 4, Ptrend=0.048) (Table 6).
For women, there was no significant association between SES and diabetic retinopathy.
DISCUSSION
The current study evaluated the role of SES on health behav- iors, clinical parameters, and diabetic complications in Korean men and women with T2DM. Lower income and lower educa- tion were closely related, and older age was associated with low SES in both men and women. In men, lower education level was associated with uncontrolled hyperglycemia, and lower household income was associated with a significantly increased risk of having diabetic retinopathy after adjustment for poten- tial confounding factors. While higher income was associated with higher BMI and obesity in men, this association was at- tenuated after adjustment for dietary intake. Women and men
with lower income and education level had higher carbohy- drate and lower fat intake. In women, lower household income was associated with higher stress level.
Good comprehensive management, including glycemic con- trol, blood pressure control, lipid management, and other risk factor management, is crucial for the prevention and manage- ment of diabetes-related complications and outcomes [23]. Di- abetes is defined by hyperglycemia, and glycemic control is central to diabetes management. Intensive glycemic control significantly decreases rates of microvascular complications in patients with T2DM [24]. Many studies have evaluated wheth- er social deprivation in people with T2DM is linked to poor glycemic control [25]. Some studies have shown that social de- privation is linked to poor glycemic control [10,26,27], while other studies have not shown this association [9,12,28,29]. In Korean men with T2DM, social deprivation (lower income and lower education attainment) was associated with a higher HbA1c level. Lower education level played a more significant role than lower income level in men. Korean men with diabe- tes in the highest education level had 37% lower odds of having uncontrolled hyperglycemia compared to those in the lowest education level after adjustment for multiple possible confound- ing factors. Among the SES factors, education level can capture the transition from parental SES to adult SES, reflecting mate- rial and intellectual resources of family origin. The skill and knowledge attained through education may affect the recep- tiveness to health information and appropriate communica- tion with healthcare services that will be important for main- taining good glycemic control [5,30]. On the contrary, there was no significant association between social deprivation and glycemic control in women, showing a different role for SES on glycemic control according to different genders.
Socioeconomic factors differentially affected BMI and obesi- ty in men and women. For men, higher income level was asso- ciated with higher BMI, and the odds of being obese were sig- nificantly increased by higher income level. The highest income level was associated with 41% increased odds of being obese compared to the lowest income level after adjustment for age, diabetes duration, smoking, drinking, education level, and in- sulin use. This association was attenuated after further adjust- ment for dietary intake of energy, carbohydrate, and fat, sug- gesting a role for dietary factors for this association. In women, higher education was significantly associated with lower BMI after adjustment for age, diabetes duration, and income level.
But, although there was a significant association between edu-
cation level and odds of being obese in women without adjust- ment, this association was attenuated after adjusting for possi- ble confounding factors. Our finding contrasts with many re- ports from developed Western countries, showing that in both men and women, low SES is associated with higher BMI and obesity [9,10]. The different association between SES and obe- sity in men and women seen in patients with diabetes is similar to that of the general Korean population. Analysis of the Kore- an National Health and Nutritional Examination Survey data have shown that in Korean men, income but not education showed a slight positive association with BMI, and in Korean women, education, but not income, was inversely associated with both obesity and BMI. These relationships were attenuat- ed after adjusting for health-related behavioral factors [31].
Diabetic retinopathy was associated with lower income in men after adjusting for multiple confounding factors. This as- sociation was not seen in women. Previous studies have report- ed an inverse association between SES and prevalence of mi- crovascular diabetes complications, especially retinopathy from other countries [32], while other studies have reported no as- sociation between SES and complications [12]. In Mexican- Americans with T2DM, low income was associated with a high- er risk of proliferative retinopathy [32]. There is a possibility that a low income influenced preventive measures for diabetic retinopathy. It is also possible that a low income in men identi- fies a group with more difficulty managing their diabetes, hav- ing a higher rate of insulin use and diabetic retinopathy. There is also a possibility that diabetic retinopathy had a reverse in- fluence that can lead to lower income in men. In a longitudinal study, Klein et al. [33] have shown that severe retinopathy led to unemployment in men in a Caucasian cohort.
Understanding the lifestyle and psychological factors that influence the association between SES and clinical outcomes is important, since interventions targeting these factors might help decrease disparities associated with SES in patients with diabetes. We have evaluated whether SES status is associated with different lifestyle factors and stress level. We have also ad- justed for these factors to assess whether they play a role in the association between SES and clinical outcomes such as glyce- mic control, obesity, and diabetic complications. For dietary nutrient intake, there was a similar pattern seen in those with lower SES in men and women. The most significant difference was a lower fat intake and a higher carbohydrate intake in those with lower SES. There was no significant difference in smoking and leisure time physical activity according to SES in both men
and women. Higher income in men and higher education in women were associated with a higher rate of current drinking.
Lower income in women was associated with a higher level of stress. The association between obesity and income in men was attenuated by adjusting for dietary intake of fat and carbohy- drate, suggesting a role for dietary factors. Since lower SES and its association with uncontrolled hyperglycemia and diabetic retinopathy were still significant after adjusting for these fac- tors, lower SES may play a significant role independent of the factors evaluated in this study.
Previous studies have shown that the influence SES has on diabetes risk is greater in women than in men [5,34]. But in Korean patients with diabetes, the role of SES on glycemic con- trol or complications is seen only men but not in women. This may be due to the fact that, while SES-related factors play a role in the predisposition to T2DM, once an individual has developed T2DM, its severity may be related to other factors in women.
In Korea since 1989, a mandatory National Health Insurance Program has existed with only relatively few uninsured people.
This universal coverage program is thought to minimize health inequalities for people with chronic diseases and economic de- privation [35]. Korea has undergone rapid economic growth and urbanization, and many nearby countries in Asia have also experienced or are currently experiencing this transition. Little data exist on the role of SES on health behaviors, intermediate outcomes such as glycemic control or obesity, and diabetic com- plications in people with T2DM from Asian countries that have been going through rapid economic growth during the previ- ous decade and having steadily increasing numbers of patients with T2DM. The current results may also give insight about the role of socioeconomic deprivation for these countries.
The current study has some limitations. The current analysis does not provide a clear causal relationship between SES and clinical outcomes because of its cross-sectional design. How- ever, since education level usually is established earlier in life, there is a low possibility of reverse causality for education level being influenced by other current clinical factors. Another lim- itation is that the population included in the current study is mainly from tertiary hospitals that are academically affiliated.
A previous study from Germany has shown that the influence of socioeconomic deprivation on higher HbA1c was attenuat- ed after treatment and education in a tertiary care center [36].
Therefore, there is a possibility that the unfavorable influence of socioeconomic deprivation may have been diluted in our study. However, the findings of our study showing that socio-
economic deprivation is associated with worse glycemic con- trol in men with lower education level and more diabetic reti- nopathy in men with lower income can give insight to the cur- rent influence of SES in Korea and other countries with similar economic growth and health systems. Efforts to diminish in- equalities for men with lower education and income should be continuously implemented.
CONFLICTS OF INTEREST
No potential conflict of interest relevant to this article was re- ported.
ACKNOWLEDGMENTS
This study was supported by a research grant from the Korea Healthcare Technology R&D Project, Ministry of Health and Welfare, Republic of Korea (HI10C2020), and the NRF (2017R1D- 1A1B03034581), Republic of Korea.
REFERENCES
1. International Diabetes Federation. IDF diabetes atlas. 7th ed.
Brussels: International Diabetes Federation; 2015.
2. Yoon KH, Lee JH, Kim JW, Cho JH, Choi YH, Ko SH, Zimmet P, Son HY. Epidemic obesity and type 2 diabetes in Asia. Lancet 2006;368:1681-8.
3. UK Prospective Diabetes Study (UKPDS) Group. Intensive blood-glucose control with sulphonylureas or insulin compared with conventional treatment and risk of complications in pa- tients with type 2 diabetes (UKPDS 33). Lancet 1998;352:837- 53.
4. American Diabetes Association. Standards of medical care in diabetes-2017. Diabetes Care 2017;40(Suppl 1):S1-135.
5. Agardh E, Allebeck P, Hallqvist J, Moradi T, Sidorchuk A. Type 2 diabetes incidence and socio-economic position: a systematic review and meta-analysis. Int J Epidemiol 2011;40:804-18.
6. Rawshani A, Svensson AM, Zethelius B, Eliasson B, Rosengren A, Gudbjornsdottir S. Association between socioeconomic sta- tus and mortality, cardiovascular disease, and cancer in patients with type 2 diabetes. JAMA Intern Med 2016;176:1146-54.
7. Wild S, Macleod F, McKnight J, Watt G, Mackenzie C, Ford I, McConnachie A, Lindsay RS. Impact of deprivation on cardio- vascular risk factors in people with diabetes: an observational study. Diabet Med 2008;25:194-9.
8. Bachmann MO, Eachus J, Hopper CD, Davey Smith G, Prop- per C, Pearson NJ, Williams S, Tallon D, Frankel S. Socio-eco- nomic inequalities in diabetes complications, control, attitudes and health service use: a cross-sectional study. Diabet Med 2003;20:921-9.
9. Collier A, Ghosh S, Hair M, Waugh N. Impact of socioeconom- ic status and gender on glycaemic control, cardiovascular risk factors and diabetes complications in type 1 and 2 diabetes: a population based analysis from a Scottish region. Diabetes Metab 2015;41:145-51.
10. Larranaga I, Arteagoitia JM, Rodriguez JL, Gonzalez F, Esnaola S, Pinies JA; Sentinel Practice Network of the Basque Country.
Socio-economic inequalities in the prevalence of type 2 diabe- tes, cardiovascular risk factors and chronic diabetic complica- tions in the Basque Country, Spain. Diabet Med 2005;22:1047- 53.
11. Wandell PE, Gafvels C. Patients with type 2 diabetes aged 35- 64 years at four primary health care centres in Stockholm Coun- ty, Sweden. Prevalence and complications in relation to gender and socio-economic status. Diabetes Res Clin Pract 2004;63:
195-203.
12. Haffner SM, Hazuda HP, Stern MP, Patterson JK, Van Heuven WA, Fong D. Effects of socioeconomic status on hyperglyce- mia and retinopathy levels in Mexican Americans with NID- DM. Diabetes Care 1989;12:128-34.
13. Kim SR, Han K, Choi JY, Ersek J, Liu J, Jo SJ, Lee KS, Yim HW, Lee WC, Park YG, Lee SH, Park YM. Age- and sex-specific re- lationships between household income, education, and diabe- tes mellitus in Korean adults: the Korea National Health and Nutrition Examination Survey, 2008-2010. PLoS One 2015;10:
e0117034.
14. Kim SH, Hong SB, Suh YJ, Choi YJ, Nam M, Lee HW, Park IeB, Chon S, Woo JT, Baik SH, Park Y, Kim DJ, Lee KW, Kim YS;
KNDP Study Group. Association between nutrient intake and obesity in type 2 diabetic patients from the Korean National Diabetes Program: a cross-sectional study. J Korean Med Sci 2012;27:1188-95.
15. Rhee SY, Hong SM, Chon S, Ahn KJ, Kim SH, Baik SH, Park YS, Nam MS, Lee KW, Woo JT, Kim YS. Hypoglycemia and medical expenses in patients with type 2 diabetes mellitus: an analysis based on the Korea National Diabetes Program Co- hort. PLoS One 2016;11:e0148630.
16. Rhee SY, Chon S, Kwon MK, Park IeB, Ahn KJ, Kim IJ, Kim SH, Lee HW, Koh KS, Kim DM, Baik SH, Lee KW, Nam MS, Park YS, Woo JT, Kim YS. Prevalence of chronic complications
in Korean patients with type 2 diabetes mellitus based on the Korean National Diabetes Program. Diabetes Metab J 2011;35:
504-12.
17. Ainsworth BE, Haskell WL, Leon AS, Jacobs DR Jr, Montoye HJ, Sallis JF, Paffenbarger RS Jr. Compendium of physical ac- tivities: classification of energy costs of human physical activi- ties. Med Sci Sports Exerc 1993;25:71-80.
18. Huh BY, Yim JH, Bae JM, Choi SS, Kim SW, Hwang HS. The validity of modified Korean: translated BEPSI (Brief Encounter Psychosocial Instrument) as instrument of stress measurement in outpatient clinic. Korean J Fam Med 1996;17:42-53.
19. Frank SH, Zyzanski SJ. Stress in the clinical setting: the brief en- counter psychosocial instrument. J Fam Pract 1988;26:533-9.
20. World Health Organization; Regional Office for the Western Pacific. Asia-Pacific perspective: redefining obesity and its treat- ment. Sydney: Health Communications Australia; 2000.
21. Chin SO, Rhee SY, Chon S, Baik SH, Park Y, Nam MS, Lee KW, Chun KH, Woo JT, Kim YS. Hypoglycemia is associated with dementia in elderly patients with type 2 diabetes mellitus: an analysis based on the Korea National Diabetes Program Co- hort. Diabetes Res Clin Pract 2016;122:54-61.
22. An SY, Kim HJ, Chun KH, Kim TH, Jeon JY, Kim DJ, Han SJ, Kim YS, Woo JT, Ahn KJ, Park Y, Nam M, Baik SH, Lee KW.
Clinical and economic outcomes in medication-adherent and -nonadherent patients with type 2 diabetes mellitus in the Re- public of Korea. Clin Ther 2014;36:245-54.
23. Gaede P, Vedel P, Larsen N, Jensen GV, Parving HH, Pedersen O. Multifactorial intervention and cardiovascular disease in patients with type 2 diabetes. N Engl J Med 2003;348:383-93.
24. UK Prospective Diabetes Study (UKPDS) Group. Effect of in- tensive blood-glucose control with metformin on complications in overweight patients with type 2 diabetes (UKPDS 34). Lan- cet 1998;352:854-65.
25. Grintsova O, Maier W, Mielck A. Inequalities in health care among patients with type 2 diabetes by individual socio-eco- nomic status (SES) and regional deprivation: a systematic liter- ature review. Int J Equity Health 2014;13:43.
26. James GD, Baker P, Badrick E, Mathur R, Hull S, Robson J. Eth- nic and social disparity in glycaemic control in type 2 diabetes:
cohort study in general practice 2004-9. J R Soc Med 2012;105:
300-8.
27. Reisig V, Reitmeir P, Doring A, Rathmann W, Mielck A; KORA Study Group. Social inequalities and outcomes in type 2 diabe- tes in the German region of Augsburg. A cross-sectional sur- vey. Int J Public Health 2007;52:158-65.
28. Connolly VM, Kesson CM. Socioeconomic status and cluster- ing of cardiovascular disease risk factors in diabetic patients.
Diabetes Care 1996;19:419-22.
29. Unwin N, Binns D, Elliott K, Kelly WF. The relationships be- tween cardiovascular risk factors and socio-economic status in people with diabetes. Diabet Med 1996;13:72-9.
30. Galobardes B, Shaw M, Lawlor DA, Lynch JW, Davey Smith G.
Indicators of socioeconomic position (part 1). J Epidemiol Com- munity Health 2006;60:7-12.
31. Kim J, Sharma SV, Park SK. Association between socioeconom- ic status and obesity in adults: evidence from the 2001 to 2009 Korea National Health and Nutrition Examination Survey. J Prev Med Public Health 2014;47:94-103.
32. West SK, Munoz B, Klein R, Broman AT, Sanchez R, Rodriguez J, Snyder R. Risk factors for type II diabetes and diabetic reti-
nopathy in a Mexican-American population: Proyecto VER.
Am J Ophthalmol 2002;134:390-8.
33. Klein R, Klein BE, Jensen SC, Moss SE. The relation of socio- economic factors to the incidence of proliferative diabetic reti- nopathy and loss of vision. Ophthalmology 1994;101:68-76.
34. Lee DS, Kim YJ, Han HR. Sex differences in the association be- tween socio-economic status and type 2 diabetes: data from the 2005 Korean National Health and Nutritional Examination Survey (KNHANES). Public Health 2013;127:554-60.
35. Luft HS. Universal health care coverage: a potential hybrid so- lution. JAMA 2007;297:1115-8.
36. Baz L, Muller N, Beluchin E, Kloos C, Lehmann T, Wolf G, Muller UA. Differences in the quality of diabetes care caused by social inequalities disappear after treatment and education in a tertia- ry care centre. Diabet Med 2012;29:640-5.
Supplementary Table 1. Clinical and laboratory characteristics according to gender
Characteristic Total Male Female P valuea
Number 3,294 1,927 (58.5) 1,367 (41.5)
Age, yr 52 (46–58) 51 (45–57) 54 (49–60) <0.001
Diabetes duration, yr 4 (1–10) 4 (1–9) 4 (1–10) 0.386
BMI, kg/m2 25.0 (23.0–27.1) 25.0 (23.1–26.9) 24.9 (22.8–27.4) 0.734
SBP, mm Hg 125 (116–134) 126 (117–135) 123 (113–133) 0.028
DBP, mm Hg 80 (70–85) 80 (71–85) 80 (70–83) <0.001
FPG, mg/dL 136 (116–167) 138 (119–173) 132 (112–162) <0.001
2-Hour PPG, mg/dL 250 (185–327) 249 (180–327) 253 (193–328) 0.564
HbA1c, % 7.4 (6.6–8.8) 7.4 (6.5–8.9) 7.4 (6.7–8.6) 0.829
Triglyceride, mg/dL 135 (91–197) 140 (92–205) 130 (90–184) <0.001
HDL-C, mg/dL 46 (39–54) 45 (38–53) 48 (41–56) <0.001
LDL-C, mg/dL 102 (80–126) 100 (78–123) 105 (83–105) <0.001
LTPA, kcal/day 266.3 (138.1–447.3) 265.7 (131.0–441.9) 266.5 (146.1–457.2) 0.270
BEPSI score 2.0 (1.0–2.0) 2.0 (1.0–2.0) 2.0 (1.0–3.0) 0.003
Energy intake, kcal/day 1,793.7 (1,560.7–2,055.3) 1,917.6 (1,689.8–2,162.3) 1,639.4 (1,426.2–1,873.5) <0.001
Protein intake, % energy 16.9 (14.9–19.1) 17.1 (14.9–19.2) 16.7 (14.7–19.1) 0.066
Carbohydrate intake, % energy 60.6 (54.2–66.4) 59.1 (52.4–64.6) 62.4 (56.4–68.4) <0.001
Fat intake, % energy 21.9 (17.2–26.8) 22.3 (18.1–27.2) 21.2 (16.2–25.9) <0.001
Fiber intake, g/1,000 kcal 14.9 (11.8–14.9) 14.0 (11.3–17.0) 16.0 (13.0–19.4) <0.001
UACR, mg/g Cr 10.0 (5.4–26.4) 10.9 (5.4–30.4) 9.2 (5.4–21.8) 0.009
Current drinking, % 53.8 72.7 27.0 <0.001
Current smoking, % 24.1 38.2 4.2 <0.001
Education level, %
Less than high school 34.8 22.1 52.7 <0.001
High school graduation 36.6 38.5 34.0
College graduation 28.6 39.5 13.3
Monthly household income, %
<1,700 US$ 37.2 28.1 50.4 <0.001
1,700–3,400 US$ 35.4 37.0 33.0
>3,400 US$ 27.5 34.9 16.6
Medication use, %
Insulin 18.3 18.5 18.0 0.770
Sulfonylureas 44.1 44.9 43.0 0.161
Metformin 63.8 61.4 67.2 0.001
ARB or ACE inhibitor 37.7 38.1 37.0 0.560
Statin 38.2 36.7 40.3 0.052
Diabetic retinopathy, % 19.7 19.4 20.0 0.730
Albuminuria, % 22.6 25.4 18.7 <0.001
HbA1c (≥7.5%), % 45.6 45.8 45.5 0.887
Obesity, % 50.1 50.8 49 0.338
Values are presented as number (%) or median (interquartile range).
BMI, body mass index; SBP, systolic blood pressure; DBP, diastolic blood pressure; FPG, fasting plasma glucose; PPG, postprandial glucose;
HbA1c, glycosylated hemoglobin; HDL-C, high density lipoprotein cholesterol; LDL-C, low density lipoprotein cholesterol; LTPA, leisure time physical activity; BEPSI, Brief Encounter Psychosocial Instrument; UACR, urinary albumin creatinine ratio; ARB, angiotensin receptor blocker;
ACE, angiotensin converting enzyme.
aP value was obtained by Mann-Whitney U test or chi-sqaure test as appropriate.