Effects of Noise on the Masticatory Muscles
Sang-Il Lee, D.D.S., Ki-Suk Kim, D.D.S.,M.S.D.,Ph.D.
Department of Oral Medicine, School of Dentistry, Dankook University
The purpose of this study was to investigate short-term masticatory muscle reactions in response to simulated noise and music sound. Hypothesis of this study was that loud noise would cause increased stiffness and decreased elasticity of the masticatory muscles compared to low level of noise or identical sound level of music.
Fifteen male volunteers were recruited for the study. The sound levels of noise and music used here were 60 dB and 100 dB. The experiment comprised 4 sessions, Session 1 with 100 dB of noise for the 1st day of experiment: Session 2 with 100 dB of music for the 2nd day: Session 3 with 60 dB of noise for the 3rd day: Session 4 with 60 dB of music for the 4th day. Stiffness and elasticity on the anterior temporalis and superficial masseter muscles were measured with tactile sensor before and 2, 4 and 6 minutes after exposure of sound.
The study indicated that, in short-term exposure of sound, there was no significant difference between noise and music at both 60 and 100 dB of sound level, but that there were partially significant differences between 60 and 100 dB of sound level regardless of sound type. This suggest that high level of sounds like 100 dB used in this study, in spite of short term exposure of several minutes, would lead to masticatory muscle contraction, especially in the masseter muscles.
Key words: Noise, Masticatory muscle, Stiffness, Elasticity
1)
Ⅰ. INTRODUCTION
Lambert et al
1)estimated that in the European Union approximately 77 million people (i.e., 22% of the total population of the EU in 1994) are exposed to a transportation noise level exceeding 65 dB during the day, which many countries consider to be
Corresponding author : Ki-Suk Kim
Dept. of Oral Medicine, School of Dentistry, Dankook University Sinbu-dong san 7-1, Chunan, Choongnam 330-716 Korea
Tele : 041-550-1914 Fax : 041-556-9665
Email : [email protected] Received: 2010-01-13
Accepted: 2010-02-24
* The present research was conducted by the research fund of Dankook University in 2009.
unacceptable. Depending on the country, road traffic noise annoyed between 20% and 25% of the population.
A recent survey illustrates that noise annoyance is widespread in the industrialized countries, as well as in urban areas in the developing countries. The growing transportation network with increasing traffic densities is a primary cause of the high prevalence of noise annoyance.
2)For making policy to control environmental noise,
it is important to have a set of relationships that
show how annoyance levels are associated with
given noise exposure levels. Many studies have been
conducted to establish such relationships. However,
doubt regarding the predictability of noise annoyance
has impeded the acceptance of the exposure-
response relationships that have been proposed.
3-5)Stress reactions associated with cognitively
demanding tasks have been addressed in a number of studies.
6-9)In general, these studies have all demonstrated that the combined effect of the work tasks and the stressors elicit cardiovascular responses that exceed the response imposed by the cognitive tasks alone. Moreover, the cardiovascular reactions are paralleled by increased electrical activity in various muscles in the arms and shoulders. It has therefore been hypothesized that the combined load of cognitively demanding tasks and other stressors might be important factors in the etiology of musculoskeletal symptoms associated with computer work.
10)Noise is a well-known occupational stressor, and exposure to noise has been linked to various adverse effects.
11-13)It can quicken pulse rate, increase blood pressure and narrow blood vessels. Over a long period of time, these may place an added burden on the heart. Noise can also cause abnormal secretions of hormones and tensing of muscles. People who deal with noise every day may complain of nervousness, sleeplessness and fatigue. Job performance may also suffer when people are exposed to high levels of noise.
14)Sound levels in offices are relatively low, but surprisingly psychological arousal is higher during cognitive work in office noise compared to quiet conditions.
15,16)Yet, little is known about the noise effects on the masticatory muscles.
The purpose of this explorative study was therefore to investigate short-term masticatory muscle reactions in response to simulated noise and music sound. Hypotheses of this study are loud noise will cause increased stiffness and decreased elasticity of the masticatory muscles compared to low noise level and identical sound level of music.
Ⅱ. METHODS 1. Participants
Fifteen male volunteers were recruited for the study. They were all dental students. Mean age of them was 25.7±2.1 years (range: 30~24 years).
Exclusion criteria were those with; systemic diseases, long-span bridge > 3-unit bridge, skeletal anomaly with class II or III occlusions, or temporomandibular disorders.
All participants participated after giving informed consent. The study was approved by IRB of Dankook University Dental Hospital (IRB No.:
H-0905/012/002).
2. Experimental sound
Street noise used in this study was obtained from a broadcast station (KBS), which was consisted of a band of 20 Hz to 20 kHz, centered at 250 and 800 Hz. Mozart-Concerto for Clarinet and Orchestra in A Major KV622 was chosen as control sound of classical music. The sound level of noise and music were adjusted prior to the study using a cone shape of parabolic reflector, which was made by plastic sheet like 2.5 cm of external ear, connected to between an earphone of MP3 player (iriver T10, Korea)and a calibrated Digital Sound Level Meter (AR824, Shenzhen Arco Science & Technology Ltd.
China). The sound levels of noise and music were set at 60 dB and 100 dB.
3. Experimental design
The experiment comprised 4 sessions, Session 1 with 6-minute exposure of 100 dB of noise for the 1
stday of experiment: Session 2 with 100 dB of music for the 2
ndday: Session 3 with 60 dB of noise for the 3
rdday: Session 4 with 60 dB of music for the 4
thday. Noise or music sound was delivered to subjects via a stereo-earphone of MP3 player during examination.
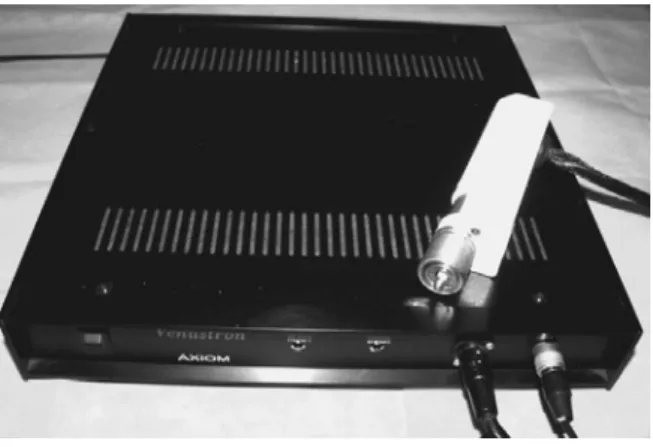
To investigate effect of sound on the masticiatory
muscles, stiffness and elasticity on the anterior
temporalis(Ta) and superficial masseter(Ms)
muscles were measured with tactile sensor
(Venustron
Ⓡ, Axiom Co. Ltd., Japan, Fig. 1) before
and 2, 4 and 6 minutes after exposure of sound. Prior
to start the experiment, rest period of 5 minutes was
given to each participant in supine position at a
Fig. 1. The tactile sensor system (VenustronⓇ, Axiom Co. Ltd., Japan)
dental unit.
For measurement of the muscle stiffness and elasticity with a tactile sensor, the skin over the muscles to be measured for each subject was marked with a pen. Ta and Mm were identified by manual palpation while each subject was asked to relax and clench alternatively and their thickest area was selected to be measured.
Prior to noise or music exposures, muscle examination with the tactile sensor was carried out in a relaxed condition. While the subjects were in light contact in their teeth, the probe of the tactile sensor was placed perpendicularly over the marked point over the skin, followed by computer-controlled movement; gently pressing straight down on the muscle for a second and retracting. The distance moved by the sensor probe for each muscle was determined separately in regards with the thickness of muscle and relation with adjacent structures; 8 mm for Mm and 3 mm for Ta. The examinations were performed only at right side of muscle unilaterally.
Experiments were performed at the clinic in the evening, starting between 8:00 and 9:00 p.m. The participants were asked not to chew or move jaw during the experiment. During this study, the participants were encouraged to eat similar consistency of foods in dinner. Mean temperature was 20℃ to 24℃ and relative humidity was 35 % to 40 % during the experiment.
4. Tactile sensor system
The tactile sensor consists of a piezoelastic transducer made of ceramics such as lead zirconate titanate (PZT) and a vibration pickup (made of PZT or polyvinylidene fluoride (PVF2) film) and it is connected to a computer equipped with the appropriate software.
When there is an electric input, the PZT element vibrates at its own inherent resonance frequency. If the sensor probe vibrating in this frequency is pressed against an object, this frequency shifts and the amount of shift in frequency is determined by the object s acoustical impedance, which directly correlated with the hardness/softness of the material. The change in frequency, or △f is defined as the difference between the new frequency, f
xand the initial frequency, f
0, shown as △f = f
x- f
0. The initial frequency, f
0was 57 Hz and the tip diameter of sensor probe was 5 mm in this tactile sensor system.
17)When the sensor probe is placed over the surface to be measured, measurement begins via the Windows’ compatible software. A small motor located in the upper end of the probe shaft is activated by the computer, which controls the depression. The sensor tip pushes down on the material once and retracts to provide a continuous stream of simultaneous stiffness, pressure and depression in real time. 200 tactile, pressure and depression data per second are swiftly and sequentially processed and recorded by the computer.
5. Statistical analysis
The values indicating stiffness and elasticity of
each muscle during experiment was obtained from
its hysteresis curve and their mean values obtained
from the examinations of 4 sessions were
transformed into relative ratio. They were compared
using Repeated 2 way ANOVA and multiple
comparison t-tests (SPSS ver. 14.0).
Ⅲ. RESULTS
A hysteresis curve composed of two parts, which are formed when the sensor pushes down(bottom) and then retracts,
18)was obtained through each examination for unilateral masseter and temporal muscles during sound exposure. The slope of the tangent of the hysteresis curve (△f/△x) is defined as stiffness of the muscle being measured and the distance between the two parts as its elasticity. The higher value of stiffness indicates decrease of stiffness of target material and the lower value does increase of that.
19)It can be seen the means and standard deviations of stiffness and elasticity for muscles measured before, during and after sound exposure in Table 1. These raw data were
Sound Masseter muscle Temporalis muscle
Stiffness Elasticity Stiffness Elasticity
60 dB Music (n=15) 0.36±0.12 141.8±57.82 0.27±0.11 93.5±37.19
Noise (n=15) 0.30±0.14 181.7±100.10 0.26±0.10 104.8±46.24
100 dB Music (n=15) 0.27±0.10 141.8±67.79 0.25±0.09 85.9±30.77
Noise (n=15) 0.24±0.09 146.5±61.01 0.23±0.08 102.5±37.90
Table 1. Means and standard deviations of stiffness and elasticity of the superficial masseter and anterior temporal muscles before, during and after sound exposures
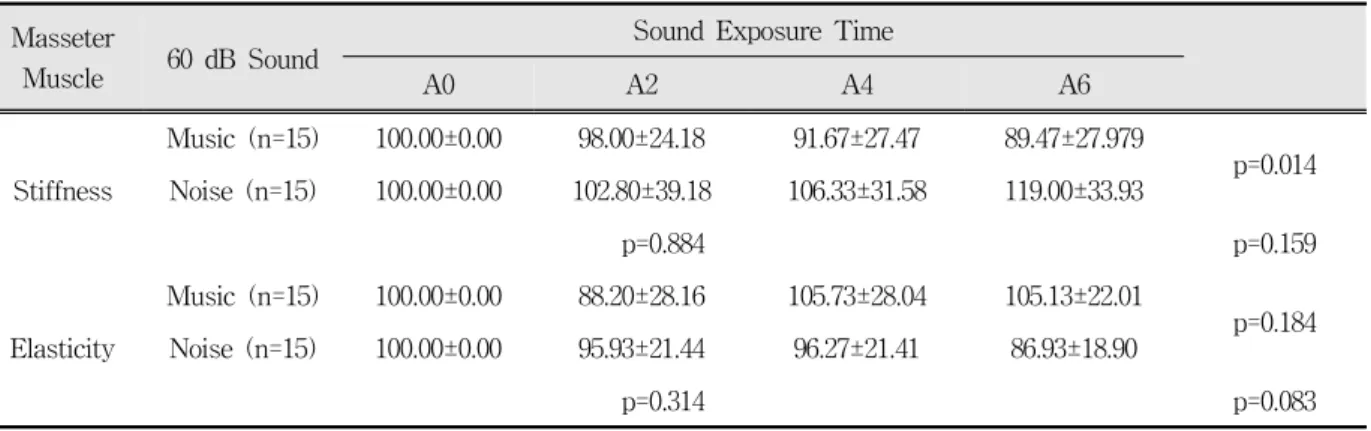
Masseter
Muscle 60 dB Sound Sound Exposure Time
A0 A2 A4 A6
Stiffness
Music (n=15) 100.00±0.00 98.00±24.18 91.67±27.47 89.47±27.979
p=0.014 Noise (n=15) 100.00±0.00 102.80±39.18 106.33±31.58 119.00±33.93
p=0.884 p=0.159
Elasticity
Music (n=15) 100.00±0.00 88.20±28.16 105.73±28.04 105.13±22.01
p=0.184 Noise (n=15) 100.00±0.00 95.93±21.44 96.27±21.41 86.93±18.90
p=0.314 p=0.083
A0, A2, A4 and A6: Before, 2, 4 and 6 minutes after sound exposure
Table 2. Means and standard deviations of ratio for stiffness and elasticty of the masseter muscle measured according to time during sound exposure of 60 dB and results of repeated 2-way ANOVA
transformed into relative ratio and relative comparison was performed to decreased differences due to individual variations of data.
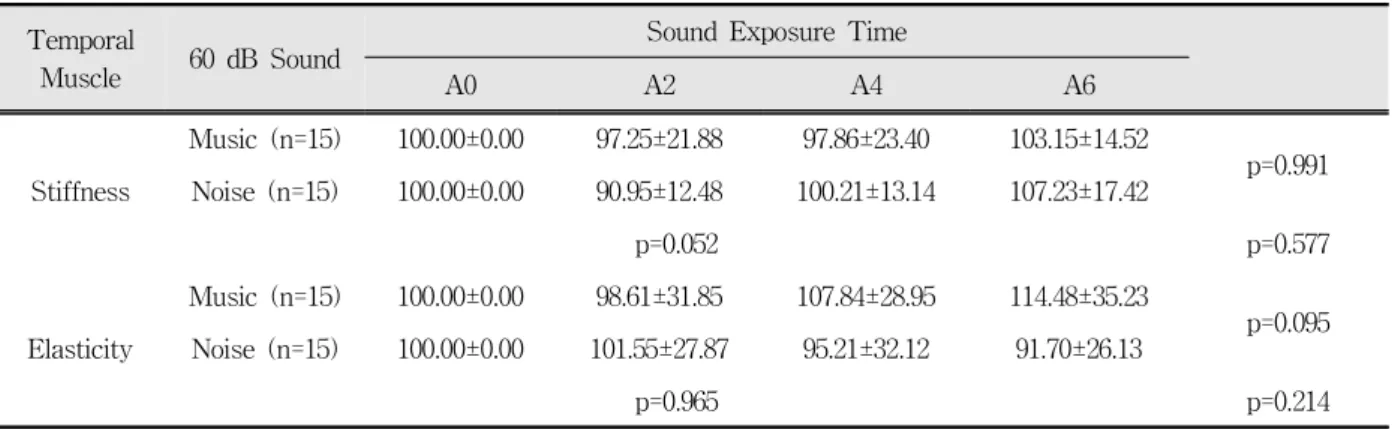
As compared the changes of the muscles during noise and music, there was no significant difference in the stiffness and elasticity measured in the masseter and temporal muscles respectively during noise and music exposures with 60 dB of sound level except the stiffness of masseter muscle(Table 2,3).
Comparing the stiffness of masseter between noise and music exposure groups, the stiffness of noise group was rather decreased than that of music group against our expectation
There was also no significant difference in the
stiffness and the elasticity between noise and music
group during 100 dB of sound exposure (Table 4, 5)
Temporal
Muscle 60 dB Sound Sound Exposure Time
A0 A2 A4 A6
Stiffness
Music (n=15) 100.00±0.00 97.25±21.88 97.86±23.40 103.15±14.52
p=0.991 Noise (n=15) 100.00±0.00 90.95±12.48 100.21±13.14 107.23±17.42
p=0.052 p=0.577
Elasticity
Music (n=15) 100.00±0.00 98.61±31.85 107.84±28.95 114.48±35.23
p=0.095 Noise (n=15) 100.00±0.00 101.55±27.87 95.21±32.12 91.70±26.13
p=0.965 p=0.214
A0, A2, A4 and A6: Before, 2, 4 and 6 minutes after sound exposure
Table 3. Means and standard deviations of ratio for stiffness and elasticity of the temporal muscle measured according to time during sound exposure of 60 dB and results of repeated 2-way ANOVA
Masseter
Muscle 100 dB Sound Sound Exposure Time
A0 A2 A4 A6
Stiffness
Music (n=15) 100.00±0.00 89.27±36.37 99.13±29.34 103.80±29.90
p=0.997 Noise (n=15) 100.00±0.00 97.53±11.77 97.07±15.10 97.53±21.77
p=0.579 p=0.653
Elasticity
Music (n=15) 100.00±0.00 104.60±26.13 102.80±23.19 90.67±25.13
p=0.923 Noise (n=15) 100.00±0.00 101.47±10.07 97.53±14.42 100.33±19.42
p=0.436 p=0.383
A0, A2, A4 and A6: Before, 2, 4 and 6 minutes after sound exposure
Table 4. Means and standard deviations of ratio for stiffness and elasticity of the masseter muscle measured according to time during sound exposure of 100 dB and results of repeated 2-way ANOVA
Temporal
Muscle 100 dB Sound Sound Exposure Time
A0 A2 A4 A6
Stiffness
Music (n=15) 100.00±0.00 107.34±29.58 102.30±25.60 97.84±25.12
p=0.293 Noise (n=15) 100.00±0.00 94.52±19.56 102.84±23.27 94.03±19.65
p=0.648 p=0.579
Elasticity
Music (n=15) 100.00±0.00 103.22±37.03 106.00±24.94 101.33±25.32
p=0.021 Noise (n=15) 100.00±0.00 89.99±24.69 90.64±28.08 88.79±24.85
p=0.872 p=0.601
A0, A2, A4 and A6: Before, 2, 4 and 6 minutes after sound exposure
Table 5. Means and standard deviations of ratio for stiffness and elasticity of the temporal muscle measured according to time during sound exposure of 100 dB and results of repeated 2-way ANOVA
except the elasticity of temporal muscle. It can be seen that the elasticity of temporal muscle in noise group significantly decreased compared with that of music group in Table 5.
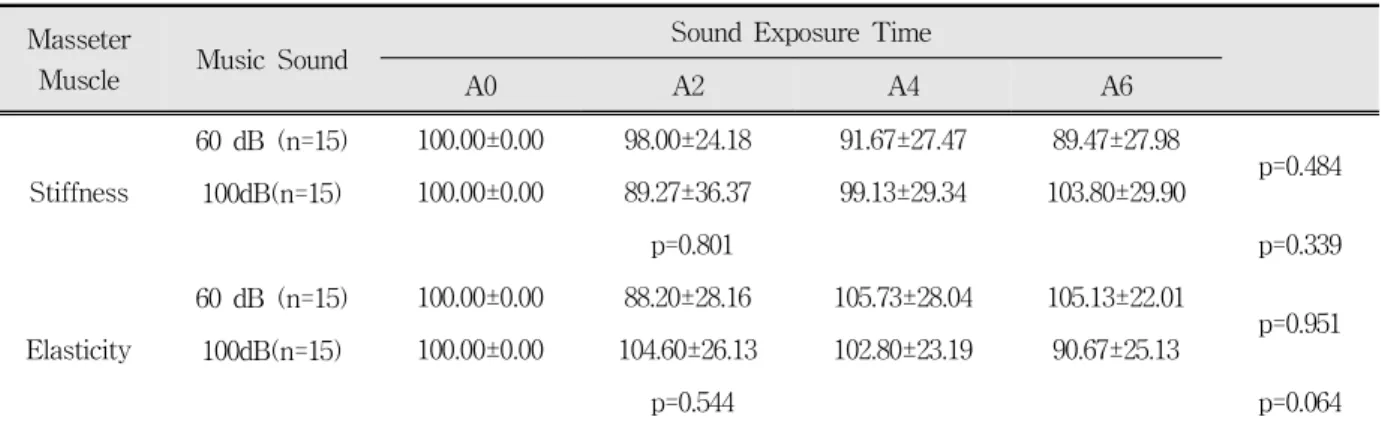
There was almost no difference in the stiffness and the elasticity of masticatory and temporal muscles between 60 dB and 100 dB of sound level groups during music or noise exposure(Table 6, 7, 8, 9), which was very similar to results of the experiments for investigating a difference of stiffness and elasticity between music and noise groups with 60 dB or 100 dB of sound level(Table 2-5). Table 6, however, shows that there was
Masseter
Muscle Music Sound Sound Exposure Time
A0 A2 A4 A6
Stiffness
60 dB (n=15) 100.00±0.00 98.00±24.18 91.67±27.47 89.47±27.98
p=0.484 100dB(n=15) 100.00±0.00 89.27±36.37 99.13±29.34 103.80±29.90
p=0.801 p=0.339
Elasticity
60 dB (n=15) 100.00±0.00 88.20±28.16 105.73±28.04 105.13±22.01
p=0.951 100dB(n=15) 100.00±0.00 104.60±26.13 102.80±23.19 90.67±25.13
p=0.544 p=0.064
A0, A2, A4 and A6: Before, 2, 4 and 6 minutes after sound exposure
Table 6. Means and standard deviations of ratio for stiffness and elasticity of the masseter muscle measured according to time during two different dB of music exposure and results of repeated 2-way ANOVA
Temporal
muscle Music Sound Sound Exposure Time
A0 A2 A4 A6
Stiffness
60 dB (n=15) 100.00±0.00 97.13±21.96 98.00±23.33 103.27±14.57
p=0.546 100dB(n=15) 100.00±0.00 107.33±29.76 102.33±25.59 97.87±25.10
p=0.974 p=0.514
Elasticity
60 dB (n=15) 100.00±0.00 98.67±31.94 107.87±29.01 114.40±35.27
p=0.599 100dB(n=15) 100.00±0.00 103.13±37.02 106.07±25.02 101.40±25.47
p=0.560 p=0.632
A0, A2, A4 and A6: Before, 2, 4 and 6 minutes after sound exposure
Table 7. Means and standard deviations of ratio for stiffness and elasticity of the temporal muscle measured according to time during two different dB of music exposure and results of repeated 2-way ANOVA
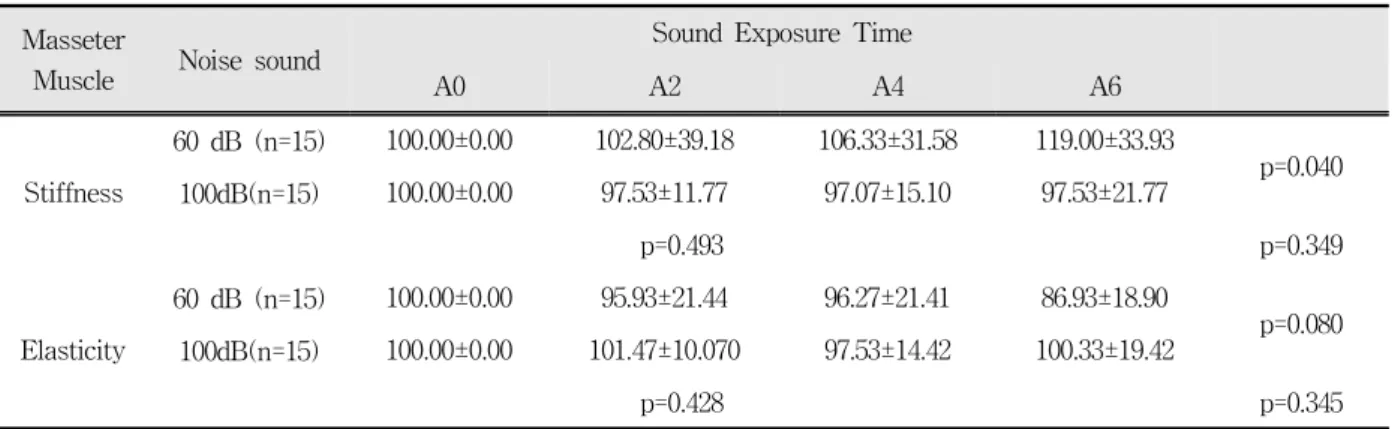
significant decrease in the elasticity of masseter muscle of 100 dB of sound level group during music exposure, compared with that of 60 dB of sound level group. Table 8 also shows that there was significant decrease in the stiffness of masseter muscle from 100 dB of sound level group during noise exposure, compared with that of 60 dB of sound level group.
Ⅳ. DISCUSSION
The impulses are conducted through the acoustic
nerve to the primary nuclei in the medulla (cochlear
nuclei) and then through a number of secondary nuclei (corpus geniculatum mediale and nucleus olivaris superior) to the cortex cerebri and to the motor nuclei. This conduction proceeds to the homolateral as well as to the contralateral nuclei.
20)Thus the unilateral acoustic stimulus will elicit a bilateral muscular contraction- exactly like the pupillary reflex and unilateral measurements of masseter and temporal muscles were used in this study.
The acoustic middle ear reflex has been studied extensively in both humans and animals. The effector organ of the acoustic middle ear reflex in humans is the stapedius muscle and in some animal
Masseter
Muscle Noise sound Sound Exposure Time
A0 A2 A4 A6
Stiffness
60 dB (n=15) 100.00±0.00 102.80±39.18 106.33±31.58 119.00±33.93
p=0.040 100dB(n=15) 100.00±0.00 97.53±11.77 97.07±15.10 97.53±21.77
p=0.493 p=0.349
Elasticity
60 dB (n=15) 100.00±0.00 95.93±21.44 96.27±21.41 86.93±18.90
p=0.080 100dB(n=15) 100.00±0.00 101.47±10.070 97.53±14.42 100.33±19.42
p=0.428 p=0.345
A0, A2, A4 and A6: Before, 2, 4 and 6 minutes after sound exposure
Table 8. Means and standard deviations of ratio for stiffness and elasticity of the masseter muscle measured according to time during two different dB of noise exposure and results of repeated 2-way ANOVA
Temporal
Muscle Noise sound Sound Exposure Time
A0 A2 A4 A6
Stiffness
60 dB (n=15) 100.00±0.00 90.95±12.48 100.21±13.14 107.23±17.42
p=0.540 100dB(n=15) 100.00±0.00 94.52±19.56 102.84±23.27 94.03±19.65
p=0.115 p=0.138
Elasticity
60 dB (n=15) 100.00±0.00 101.55±27.87 95.21±32.12 91.70±26.13
p=0.275 100dB(n=15) 100.00±0.00 89.99±24.69 90.64±28.08 88.79±24.85
p=0.430 p=0.810
Table 9. Means and standard deviations of ratio for stiffness elasticity of the temporal muscle measured according to time during two different dB of noise exposure and results of repeated 2-way ANOVA
species, the tensor tympani muscle also contracts in response to loud sounds. Thus, despite the fact that the stapedius and the tensor tympani muscles are innervated by two different cranial nerves (the facial and the trigeminal nerves, respectively) these two muscles contract together as an acoustic reflex, at least in the animals often used in auditory research such as the cat, guinea pig, and rat.
The stapedius muscle is innervated by the
stapedius nerve, which is a branch of the facial
nerve that takes off from the main trunk of this
nerve in the facial canal peripheral to the petrosal
nerve and the geniculate ganglion, but centrally to
the chorda tympani. In humans, the nerve to the
stapedius muscle branches off the facial nerve approximately 1 cm from the styloimastoid foramen.
The tensor tympani muscle is innervated by the mandibular branch(V3) of the Vth cranial nerve (trigeminal nerve).
21)The tensor tympani muscle can be brought to contract by stimulating the skin around the eye, for instance by air puffs.
22)The response they observed was elicited by stimulation of the trigeminal nerve, which innervates the skin around the eye and the cornea. Stimulation of that area of the face also elicits the blink reflex that is a natural protective reflex. The tensor tympani muscle normally contracts while swallowing. It can be, therefore, postulated that the contraction of tympani muscle due to loud noise have some relationship to that of masticatory muscles, especially temporal and masseter muscles.
When the acoustic middle ear reflex is studied by recording changes in the ear s acoustic impedance the response amplitude increases gradually after a brief latency to attain a plateau after approximately 500 ms at stimulus levels just above threshold. The increase in the response amplitude occurs more rapidly when elicited by sounds of higher intensity.
The amplitude of the reflex response elicited by high-frequency sounds decreases over time (adaptation) but normally the reflex response elicited by tones below 1500 Hz shows little adaptation.
21)In this study, used noise consisted of a broad band of 20 Hz to 20 kHz, although centered at 250 and 800 Hz. By the results of present study that there was a variability of these response, contrary to the expectations, even duration short term, it can be thought because adaptation be occurred by tones above 1500 Hz of noise used in this study or acoustic reflex to protect cochlea be occurred.
21)The threshold of the acoustic middle ear reflex is poorly defined because small irregular responses are obtained in a large range of stimulus intensities near threshold. The variability of these responses makes it difficult to determine the absolute threshold of the acoustic middle ear reflex accurately. The
“threshold” of the acoustic middle ear reflex, defined
as the sound intensity necessary to elicit a response with an amplitude of 10% of the maximal response, is a more reproducible measure of the sensitivity of the reflex.
23)While the sound intensity needed to elicit a response with a small amplitude shows a high degree of reproducibility in the same individual when recorded at different times. The reflex threshold determined in that way shows considerable individual variations. The reflex threshold, as defined here is approximately 85 dB above hearing threshold in young individuals with normal hearing for stimulation of the contralateral ear.
24)These measures have large individual variations, even in young individuals with normal hearing and without a history of middle ear disorders. The large individual variation should be considered when the threshold of the acoustic middle ear reflex is used for diagnostic purposes.
This is another explanation for large variation of the results in this study.
Many hypotheses about the functional importance of the acoustic middle ear reflex have been presented. Maybe the most plausible hypothesis is that at least one of the important functions of the reflex is to keep the input to the cochlea nearly constant for sounds above sound levels of a certain value, while allowing rapid changes in the sound level to be preserved. The middle ear reflex thus acts as a relatively slow automatic volume control that keeps the mean level of sound that reaches the cochlea within narrow limits (amplitude compression). Contractions of the stapedius muscle reduce sound transmission through the middle ear.
The acoustic middle ear reflex therefore functions as
a control system that makes the input to the cochlea
vary less than the sound that reaches the tympanic
membrane, thus amplitude compression. Therefore,
the amplitude compression is most effective for
steady-state sounds or sounds with slowly varying
amplitude. Studies of the function of the cochlea
with the acoustic middle ear reflex inactivated
indicate that the cochlea does not function properly
at sound levels above threshold for the acoustic
reflex (approximately 85 dB above hearing
threshold). The reflex response to tones above approximately 800 Hz do not show a sign in oscillation study that the contraction of the stapedius muscle does not change the sound transmission through the middle ear noticeably above low frequency and thus the acoustic middle ear reflex is not an efficient control system for sounds above 800 Hz.
In this study we used 100 dB of sound level of noise above the protection acoustic threshold(85 dB), which was consisted of a band of 20 Hz to 20 kHz, centered at 250 and 800 Hz. Although centered at 250 and 800 within the range of amplitude compression, higher frequency than 800 Hz was included and sound level than 85 dB was used in this study.
21)It is , therefore, believed that we have some positive results in spite of short term experiment in this study.
Physiological arousal and stress reactions in response to noise exposure of low- and moderate -intensity have been addressed only in a few other studies. Evans and Johnson
25)observed a higher excretion of epinephrine in a group of subjects performing office-like tasks in noise compared to a group doing the work in quiet conditions. Recent study,
26)however, reported that they did not find such changes contrary to their expectations. They insisted that their negative results be attributed to a shorter noise exposure time (approximately 35 min). The different findings in the two studies may be related to differences in the design. Although they thought that was because of a difference of noise exposure time: 3 hours vs 35 min, it is believed that they studied noise effects under cognitively demanding tasks, not pure noise effects in recent study.
26)In this study, we used a shorter exposure time (6 min). The rationale for this choice is the prior assumption that noise is an acute stressor. Support for this contention comes from observations of raised psychological arousal and stress in response to office noise, for example, in the study by Loewen and Suedfeld
27)Noteworthy is also the study by Lundberg and Frankenhaeuser
28)who observed a
significant increase in heart rate in subjects after 10 min exposure to white noise of 76 dB.
Therefore, it is suggested that masseter muscle contraction should be caused secondarily by CNS stimulation due to noise rather than directly caused by intraauricular muscle contraction due to noise.
These mean that stress caused by noise is likely more important to muscle contraction than noise itself.
Comparing the stiffness of masseter muscle between noise and music group, significant difference was also found, but since the effect was opposite of the expected direction it is regarded as a chance finding. 60 dB of noise used in this study is a continuous sound and a sound level of talking by the side.
14)It, therefore, could be thought that this level of noise would be adapted
21)more easily than similar level of music sound and be able to relax the muscles more effectively.
Further researches are required for comparing the effect on the masticatory muscles of pulsed or intermittent noise with that of continuous noise and for investigating the level of sound relation to muscle contraction in the future.
The study indicated that, in short-term exposure of sound, there was no significant difference between noise and music at both 60 and 100 dB of sound level, but that there were partially significant differences between 60 and 100 dB of sound level regardless of sound type. This suggest that high level of sounds like 100 dB used in this study, in spite of short term exposure of several minutes, would lead to masticatory muscle contraction, especially in the masseter muscles.
REFERENCES
1. Lambert J, Vallet M. Study Related to the Preparation of a Communication on a Future EC Noise Policy.
Report 9420 prepared for CEC-DG XI, Bron, France:
INRETS-LEN, 1994.
2. Al-harthy I, Tamura A. Sound environment evaluation and categorization of audible sounds - the first survey of the human response to the sound environment in Muscat City (Oman). J Acoust Soc Jpn 1999;
20:353-364.
3. Chultz TJ. Synthesis of social surveys on noise annoyance. J Acoust Soc Am 1978;64:377-405.
4. Fidell S, Barber DS, Schultz TJ. Updating a dosage- effect relationship for the prevalence of annoyance due to general transportation noise. J Acoust Soc Am 1991;89:221-233.
5. Miedema HME, Vos H. Exposure-response relation- ships for transportation noise. J Acoust Soc Am 1998;
104:3432-3445.
6. Wahlström J, Hagberg M, Johnson PW, Svensson J, Rempel D. Influence of time pressure and verbal provocation on physiologicaland psychological reactions during work with a computer mouse. Eur J Appl Physiol 2002;87:257-263.
7. Finsen L, Søgaard K, Christensen H. Influence of memory demand and contra lateral activity on muscle activity. J Electromyogr Kinesiol 2001;11:373-380.
8. Finsen L, Søgaard K, Jensen C, Borg V, Christensen H. Muscle activity and cardiova- scular response during computer-mouse work with and without memory demands.
Ergonomics 2001;44:1312-1329.
9. Hjortskov N, Rissén D, Blangsted AK et al. The effect of mental stress on heart rate variability and blood pressure during computer work. Eur J Appl Physiol 2004;92:84-89.
10. Wahlström J, Lindegård A, Ahlborg G Jr, Ekman A, Hagberg M. Perceived muscular tension, emotional stress, psychological demands and physical load during VDU work. Int Arch Occup Environ Health 2003;76:584-590.
11. van Kempen EEMM, Kruize H, Boshuizen HC et al.
The association between noise exposure and blood pressure and ischemic heart disease: a meta-analysis.
Environ Health Perspect 2002;110:307-317.
12. Davies HW, Teschke K, Kennedy SM et al.
Occupational exposure to noise and mortality from acute myocardial infarction. Epidemiology 2005;16:
25-32.
13. Willich SN, Wegscheider K, Stallman M, Keil T. Noise burden and the risk of myocardial infarction. Eur Heart J 2006;27:276-282.
14. Dawna L.C, Johnson SB. Extension crops specialist.
Maine Farm Safety Program: Hearing protection for Farmers. Bulletin 2293 (www.umext.maine.edu/
onlinepubs/PDFpubs/2293.pdf)
15. Witterseh T, Wyon DP, Clausen G. The effects of moderate heat stress and open-plan office noise distraction on SBS symptoms and on the performance of office work. Indoor Air 2004;14:30-40.
16. Loewen L, Suedfeld P. Cognitive and arousal effects of masking office noise. Environ Behav 1992;24:
381-395.
17. Venustron user’s manual version 2.3. Axiom Co., Ltd.
1996:www.axiom-j.co.jp
18. Johannes WR, Yokochi C. Color atlas of anatomy.
LIPPINCOTT WILLIAMS & WILKINS. 1990.
19. Kim SK, Kim ME, Kim KS. Effects of oral parafunction on the stiffness and elasticity in the muscles of the mastication and facial expression. Kor J Oral Med 2008;3:85-95.
20. Bach V, Libert JP, Tassi P, et al. Cardiovascular responses and electroencephalogram disturbances to intermittent noise: effects of nocturnal heat and daytime exposure. Eur J Appl Physiol 1991;63:330-337.
21. Moller AR. Hearing : Its Physiology and pathophysiology, “Acoustic Middle Ear Reflex”. New York,. 2000, Elseviar Science, Academic Press pp.345-368.
22. Klockhoff L, Anderson N. Recording of the stapedius reflex elicited by cutaneous stimulation. Acta Otolaryngol 1959;50:451-454.
23. Moller AR. Bilateral contraction of the Tympanic Muscles in Man. Royal Institute of Technology(KTH), Div. of Telegraphy-Telephony, Report No. 18, Speech Transmission Laboratory, Stockholm. 1961, pp.1-15.
24. Moller AR. The sensitivity of contraction of the tympanic muscles in man. Ann Otol Rhinol Laryngol 1962;48:663-675.
25. Evans GW, Johnson D. Stress and open-office noise.
J Appl Psychol 2000;85:779-783.
26. Kristiansen J, Mathiesen L, Nielsen PK, etc. Stress reactions to cognitively demanding tasks and open-plan office noise. Int Arch Occup Environ Health 2009;82;631-641.
27. Loewen L, Suedfeld P. Cognitive and arousal effects of masking office noise. Environ Behav 1992;24:
381-395.
28. Lundberg U, Frankenhaeuser M. Psychophysiological reactions to noise as modified by personal control over noise intensity. Biol Psychol 1978;6:51-59
국문요약
소음이 저작근에 미치는 효과
단국대학교 치과대학 구강내과학 교실
이상일․김기석
본 연구는 단기간의 인공소음과 음악 청취에 대한 저작근의 반응을 조사하였다. 연구의 가설은 높은 소음은 작은 소음이나 음악에 비하여 저작근의 경도는 높이고 탄성도는 감소시킨다는 것이다.
15명의 지원자에게 60 dB 과 100 dB 의 소음과 음악을 각각 6분씩 들려주고 청취 전과, 청취 2분후, 4분후, 6분후에 tactile sensor system을 이용하여 교근과 측두근의 경도 및 탄성도를 조사하였다. 첫째날은 100 dB의 소음, 둘째날은 100 dB 의 음악, 셋째날은 60 dB 의 소음, 넷째날은 60 dB 의 음악을 청취한 후 조사하였다.
실험 결과, 60 dB, 100 dB 모두에서 소음과 음악 청취군 간에는 유의성 있는 차이가 대부분 없었으며, 60 dB, 100 dB군간의 비교에서 측두근에서는 유의한 차이가 없었으나 교근의 경우, 음악군에서는 탄성도에서, 소음군에서는 경도에서 유의한 차이 를 보여주었다. 이는 소음의 종류에 관계없이 비록 음악이고 단기간의 청취일지라도 큰 소음인 경우에는 저작근의 수축을 야기할 수 있음을 의미한다.
주제어: 소음, 저작근, 경도(Stiffness), 탄성도(Elasticity)