https://doi.org/10.20307/nps.2017.23.2.139
139
Flavonoid Compounds from the Leaves of Kalanchoe prolifera and Their Cytotoxic Activity against P-388 Murine Leukimia Cells
Lilis Siti Aisyah
1, Yenny Febriani Yun
1, Tati Herlina
2, Euis Julaeha
2, Achmad Zainuddin
2, Ida Nurfarida
3, Ace Tatang Hidayat
2,3Unang Supratman
2,3,*, and Yoshihito Shiono
41
Department of Chemistry, Faculty of Mathematics and Natural Sciences, Jenderal Achmad Yani, University, Cimahi 40528, Indonesia
2
Department of Chemistry, Faculty of Mathematics and Natural Sciences, Universitas Padjadjaran, Jatinangor 45363, Indonesia
3
Central Laboratory of Universitas Padjadjaran, Jatinangor 45363, Indonesia
4
Department of Food, Life, and Environmental Science, Faculty of Agriculture, Yamagata University, Tsuruoka, Yamagata 997-8555, Japan
Abstract − Seven flavonoid compounds, kaempferol (1), quercetin (2), quercetin-3-O-β-D-glucopyranoside (3), kaempferol-3-O-β-D-glucopyranoside (4), kaempferol-3-O-α-L-rhamnoside (5), quercetin-3-O-sophoroside (6) and quercetin-3-O-rutinoside (7), were isolated from the methanolic extract of leaves of Kalanchoe prolifera.
Compounds 1-7 were isolated for first time from this plant. These compounds were evaluated their cytotoxic activity against P-388 murine leukimia cells in vitro. Among those compounds kaempferol (1) and quercetin (2) showed strongest cytotoxic activity with IC
50values of 4.45 ± 0.05 and 6.28 ± 0.02 μg/mL, respectively.
Keywords − Flavonoids, Kalanchoe prolifera, Crassulaceae, P-388 murine leukimia cell
Introduction
Kalanchoe prolifera belong to Crassulaceae family is a perennial herb and succulent leaves which grown in high terrain and indigenous to low altitude of Indonesia
1. The leaves of K. prolifera are used in Indonesian traditional medicine for the treatment of fever, infections, rheumatism and skin diseases
1,2. The genus of Kalanchoe reported to contain bufadienolides
3-5, triterpenoids
6and flavonoids
7-9and to possess biological activities such as blocking human lymphocyte proliferation
6,10, cytotoxic
11, insecti- cidal
5,12and inhibiting cancer cell growth
13,14. However, thus so far there is no phytochemistry reported from K.
prolifera. Our preliminary screening in search for novel cytotoxic agents from Indonesian Kalanchoe plants, we found that the methanolic extract of K. prolifera exhibited significant cytotoxic against P-388 murine leukimia cells in vitro. Repeated column chromatography of the metha- nolic extract of fresh leaves of K. prolifera by bioassay- guided isolation resulted in the isolation of seven flavonoids
(Fig. 1). The isolation, structure identification, and cytotoxic evaluation against P-388 murine leukimia cells of these isolated compounds are described herein.
Experimental
General experimental procedures − Ultra-violet spectra was recorded in methanol on Jasco UV-1575 spectropho- tometer. The IR spectra were measured on a Perkin Elmer spectrum-100 FT-IR in KBr. Mass spectra were obtained with a Water Qtof HR-MS XEV
otmand Water TQD MS/
MS mass spectrometers. NMR spectra were recorded with a JEOL JNM A-500 spectrometer using tetra methyl silane (TMS) as an internal standard. Chromatographic separation were carried out on silica gel 60 (Merck).
PTLC glass plates were precoated with silica gel GF
254(Merck, 0.25 mm). TLC plates were precoated with silica gel GF
254(Merck, 0.25 mm), detection was achieved with 10% H
2SO
4in ethanol, followed by heating and under ultra-violet at λ 254 and 367 nm.
Plant materials − The fresh leaves of K. prolifera were collected from Manaco Botanical Garden, Lembang, Bandung, West Java Province, Indonesia in May, 2014.
The plant was identified by the staff of the Bogoriense Herbarium, Bogor, Indonesia and a voucher specimen
*Author for correspondence
Unang Supratman, Department of Chemistry, Faculty of Mathemat- ics and Natural Sciences, Universitas Padjadjaran, Jatinangor 45363, Indonesia
Tel: +62-22-7794391; E-mail: [email protected]
(No. B0-129211) was deposited at the herbarium.
Extraction and isolation − The fresh ground leaves (20 kg) of K. prolifera was extracted with methanol exhaustively (50 L) at room temperature for 3 days. After removal of the solvent under vacuum, the viscous concentrated of MeOH extract (320 g) was first suspended in H
2O and then partitioned with n-hexane, EtOAc and n- butanol, successively. Evaporation resulted in the crude extract of n-hexane (40.2 g), EtOAc (84.5 g) and n-butanol (53.5 g), respectively. The ethyl acetate extract showed strongest cytotoxic activity against P-388 murine leukimia cells with IC
50value of 24.4 μg/mL. The EtOAc extract was subjected to vacuum liquid chromatography using gradient elution of n-hexane-EtOAc-MeOH to afford 15 fractions (A-O). Fraction C (4.5 g) was further subjected to column chromatography using mixture of n-hexane-EtOAc (10:0-6:1) as eluting solvents to afford 8 subfractions (C1- C8). Fraction C4 (340 mg) was subjected to flash column chromatography on silica gel, eluted with CHCl
3-MeOH (9:1), to give 1 (15.4 mg). Fractions C6-C7 were com- bined (4.4 g) and subjected to silica gel column chromato- graphy using mixture of n-hexane-acetone (10:0-1:1) as eluting solvents to give 10 subfractions (C6.1-C6.10).
Subfractions C6.6 (285 mg) was preparative TLC on silica gel GF
254, eluted with CHCl
3:MeOH (9.5:0.5) to give 2 (42.5 mg) and 3 (12.8 mg). Fractions D and E were combined (5.2 g) was further subjected to column chro- matography using mixture of n-hexane-EtOAc (10:0-5:1) as eluting solvents to afford 6 subfractions (D1-D6).
Subfraction D5 (340 mg) was subjected to flash column
chromatography on silica gel, eluted with CHCl
3-MeOH (9.5:0.5), to give 4 (12.4 mg). Fractions D4-6 were combined (3.4 g) and subjected to silica gel column chromatography using mixture of n-hexane/acetone (10:0-1:1) as eluting solvents to give 7 subfractions (D4.1-D4.7). Subfractions D4.2 and D4.3 were combined (485 mg) was preparative TLC on silica gel GF
254, eluted with CHCl
3:MeOH (9.75:
0.25) to give 5 (42.5). Fractions F-H were combined (6.2 g) was further subjected to column chromatography using mixture of n-hexane-EtOAc-MeOH as eluting solvents to afford 10 subfractions (F1-F10). Fraction F6 (240 mg) was subjected to flash column chromatography on silica gel, eluted with n-hexane:acetone (7:3) and CHCl
3-MeOH (9.5:0.5), to give 6 (12.4 mg). Fractions F3-6 were com- bined (4.2 g) and subjected to silica gel column chromato- graphy using mixture of n-hexane/acetone (10:0-1:1) as eluting solvents to give 6 subfractions (F3.1-F3.6). Fractions F3.2-F3.4 were combined (385 mg) was preparative TLC on silica gel GF
254, eluted with n-hexane: acetone (3:2) and CHCl
3:MeOH (9.75:0.25) to give 7 (12.5 mg).
Kaempferol (1) – Yellow amorphous powder; UV (MeOH): λ
max(log ε) 272 (4.0), 364 (3.7) nm; IR (KBr) ν
maxcm
−1: 3420, 1690, 1605, 1260, 720;
1H-NMR (CD
3OD, 500 MHz): δ
H8.04 (2H, dd, J = 11.5, 2.8 Hz, H-2′, H-6′), 6.95 (2H, dd, J = 9.8, 2.7 Hz, H-3′, H-5′), 6.52 (1H, d, J = 2.0, H-8), 6.28 (1H, d, J = 2.0, H-6);
13C-NMR (CD
3OD, 125 MHz): Table 1; ESI-TOFMS (m/z 285.2263 [M-H]
+), calcd. for C
15H
10O
6m/z 286.2270.
Quercetin (2) – Yellow amorphous powder; UV (MeOH):
λ
max(log ε) 274 (3.8), 360 (3.6) nm; IR (KBr) ν
maxcm
−1:
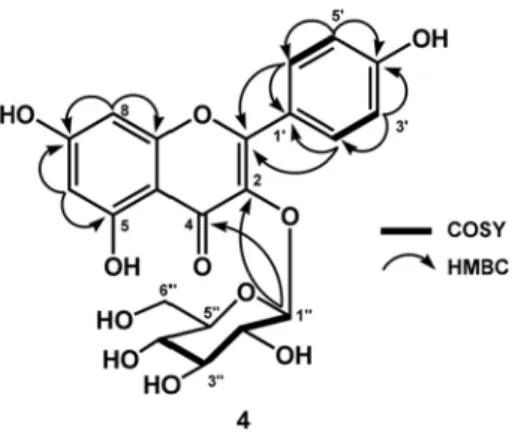
Fig. 1. The structure of compounds 1 - 7 isolated from K. prolifera.
3430, 1680, 1610, 1250;
1H-NMR (CD
3OD, 500 MHz):
δ
H7.65 (1H, d, J = 2.1 Hz, H-2′), 7.50 (1H, dd, J = 8.4, 2.1 Hz, H-6 ′), 6.85 (1H, d, J = 8.4 Hz, H-5′), 6.40 (1H, d, J = 2.0 Hz, H-8), 6.20 (1H, d, J = 2.0 Hz, H-6);
13C-NMR (CD
3OD, 125 MHz): Table 1; ESI-TOFMS spectral data ( m/z 285.2263 [M-H]
+, calcd. for C
15H
10O
7m/z 302.40).
Quercetin-3-O-β-D-glucopyranoside (3) – Yellow pow- der; UV (MeOH): λ
max(log ε) 264 (3.85), 350 (3.58) nm;
IR (KBr) ν
maxcm
−1: 3310, 1662, 1602, 1040;
1H-NMR (CD
3OD, 500 MHz): δ
H7.64 (1H, dd, J = 8.4, 1.9 Hz, H- 6 ′), 7.47 (1H, d, J = 1.9 Hz, H-2′), 6.79 (1H, d, J = 8.4 Hz, H-5 ′), 6.38 (1H, d, J = 2.0 Hz, H-8), 6.16 (1H, d, J = 2.0 Hz, H-6); (
13C-NMR (CD
3OD, 125 MHz): Table 1.
Kaempferol-3-O-β-D-glucopyranoside (4) – Yellow amorphous powder; UV (MeOH): λ
max(log ε) 266 (3.9), 356 (3.7) nm; IR (KBr) ν
maxcm
−1: 3251, 1710, 1607, 1045;
1H-NMR (CD
3OD, 500 MHz): δ
H8.05 (2H, dd,
J = 11.4, 2.8 Hz, H-2′, H-6′), 6.95 (2H, dd, J = 9.7, 2.7 Hz, H-3 ′, H-5′), 6.50 (1H, d, J = 2.0, H-8), 6.30 (1H, d, J = 2.0, H-6), 5.48 (1H, d, J = 7.8 Hz, H-1′′), 3.72 (1H, dd, J = 12.0, 4.2 Hz, H-6′′b), 3.58 (1H, dd, J = 12.0, 4.5 Hz, H-6 ′′a), 3.55 (1H, d, J = 11.4, H-3′′), 3.32 (1H, d, J = 11.4 Hz, H-2′′), 3.21 (1H, d, J = 7.8 Hz, H-5′′), 3.20 (1H, m, H-4 ′′);
13C-NMR (CD
3OD, 125 MHz): Table 1;
TQD MS ES
−m/z [M−H]
−447.34, calcd. for C
21H
20O
11m/z 448.35].
Kaempferol-3-O-α-L-rhamnoside (5) – Yellow amor- phous powder; UV (MeOH): λ
max(log ε) 266 (3.8), 354 (3.6) nm; IR (KBr) ν
maxcm
−1: 3278, 1655, 1607, 1062;
1
H-NMR (CD
3OD, 500 MHz): δ
H7.20 (2H, d, J = 7.18 Hz, H-2 ′, H-6′), 6.90 (2H, dd, J = 7.20 Hz, H-3′, H-5′), 6.10 (1H, d, J = 2.0, H-8), 5.95 (1H, d, J = 2.0, H-6), 5.49 (1H, d, J = 1.9 Hz, H-1′′), 3.80 (1H, dd, J = 8.0, 7.10 Hz, H-2 ′′), 3.74 (1H, dd, J = 10.0, 6.10 Hz, H-5′′), 3.45 (1H, Table 1.
13C-NMR data for compounds 1 - 7 (125 MHz in CD
3OD)
Position C
1 2 3 4 5 6 7
δ
C(mult.) δ
C(mult.) δ
C(mult.) δ
C(mult.) δ
C(mult.) δ
C(mult.) δ
C(mult.)
2 146.8 (s) 147.7 (s) 158.4 (s) 156.4 (s) 153.6 (s) 156.7 (s) 159.0 (s)
3 136.6 (s) 135.7 (s) 135.6 (s) 133.3 (s) 134.6 (s) 133.5 (s) 135.6 (s)
4 176.6 (s) 176.8 (s) 179.1 (s) 177.4 (s) 179.7 (s) 177.9 (s) 179.4 (s)
5 162.3 (s) 160.7 (s) 163.0 (s) 161.3 (s) 163.3 (s) 161.7 (s) 163.5 (s)
6 99.2 (d) 98.2 (d) 98.0 (d) 99.1 (d) 98.6 (d) 98.4 (d) 99.8 (d)
7 164.9 (s) 163.9 (s) 168.4 (s) 164.2 (s) 165.5 (s) 164.5 (s) 167.1 (s)
8 94.4 (d) 94.5 (d) 95.6 (d) 93.8 (d) 99.4 (d) 93.9 (d) 95.2 (d)
9 157.7 (s) 156.1 (s) 160.0 (s) 156.5 (s) 155.0 (s) 156.0 (s) 158.5 (s)
10 104.1 (s) 103.0 (s) 105.7 (s) 104.1 (s) 104.5 (s) 104.8 (s) 106.2 (s)
1′ 123.3 (d) 121.9 (d) 121.2 (s) 121.0 (s) 124.0 (s) 121.6 (s) 123.2 (s)
2′ 125.9 (d) 115.0 (d) 115.9 (d) 131.0 (d) 128.4 (d) 115.8 (d) 117.7 (d)
3′ 116.3 (d) 145.0 (d) 146.5 (s) 115.2 (d) 114.6 (d) 145.3 (s) 146.0 (s)
4′ 160.1 (s) 145.8 (s) 151.4 (s) 160.0 (s) 158.0 (s) 148.9 (s) 150.1 (s)
5 ′ 116.3 (d) 115.6 (d) 116.9 (d) 115.2 (d) 114.6 (d) 116.5 (d) 116.1 (d)
6 ′ 125.9 (d) 124.5 (d) 121.3 (d) 131.0 (d) 128.4 (d) 122.3 (d) 116.1 (d)
1 ′′ 104.4 (d) 101.2 (d) 97.0 (d) 99.1 (d) 104.7 (d)
2′′ 75.7 (d) 74.3 (d) 74.8 (d) 83.2 (d) 75.7 (d)
3′′ 78.1 (d) 76.5 (d) 77.5 (d) 70.1 (d) 78.2 (d)
4′′ 71.2 (d) 69.9 (d) 78.6 (d) 76.5 (d) 71.4 (d)
5′′ 78.4 (d) 77.6 (d) 75.6 (d) 77.2 (d) 77.2 (d)
6′′ 62.6 (t) 60.9 (t) 20.8 (q) 61.4 (t) 61.5 (t)
1 ′′′ 104.5 (d) 102.4 (d)
2 ′′′ 74.9 (d) 71.4 (d)
3 ′′′ 77.0 (d) 72.1 (d)
4 ′′′ 69.6 (d) 73.9 (d)
5′′′ 78.0 (d) 69.7 (d)
6′′′ 61.2 (t) 17.8 (q)
dd, J = 10.0, 4.30 Hz, H-3′′), 3.42 (1H, t, J = 10.0 Hz, H- 4 ′′), 0.94 (3H, d, J = 6.0 Hz, H-6′′);
13C-NMR (CD
3OD, 125 MHz): Table 2; ESI-TOFMS [M −H]
−m/z 431.11, calcd. for C
21H
20O
11m/z 432.10.
Quercetin-3-O-sophoriside (6) − Yellow powder; UV (MeOH): λ
max(log ε) 262 (3.83), 352 (3.50) nm; IR (KBr) ν
maxcm
−1: 3320, 1672, 1620, 1030;
1H-NMR (CD
3OD, 500 MHz): δ
H7.60 (1H, dd, J = 8.5, 2.2 Hz, H-6′), 7.55 (1H, d, J = 2.2 Hz, H-2′), 6.87 (1H, d, J = 8.5 Hz, H-5′), 6.40 (1H, d, J = 2.1 Hz, H-8), 6.19 (1H, d, J = 2.1 Hz, H- 6), 5.70 (1H, d, J = 7.3 Hz, H-1′′); 4.60 (1H, d, J = 7.8 Hz, H-1 ′′), 3.71 (1H, m, H-6′′a), 3.70 (1H, m, H-6′′′a), 3.56 (1H, m, H-6 ′′b), 3.54 (1H, m, H-3′′), 3.50 (1H, m, H-2 ′′), 3.48 (1H, m, H-6′′′b), 3.47 (1H, m, H-3′′′), 3.46 (1H, m, H-2 ′′′), 3.45 (1H, m, H-4′′), 3.38 (1H, m, H-5′′), 3.36 (1H, m, H-4 ′′′), 3.34 (1H, m, H-5′′′);
13C-NMR (CD
3OD, 125 MHz): Table 2; TQD MS-ES
+[M+H]
+m/z 625.59.
Quercetin-3-O-rutinoside (7) − Yellow powder; UV (MeOH): λ
max(log ε) 268 (3.80), 356 (3.58) nm; IR (KBr) ν
maxcm
−1: 3350, 1670, 1615, 1020;
1H-NMR (CD
3OD, 500 MHz): δ
H7.68 (1H, dd, J = 8.5, 2.2 Hz, H-6′), 7.70 (1H, d, J = 2.2 Hz, H-2′), 6.90 (1H, d, J = 8.4 Hz, H-5′), 6.45 (1H, d, J = 2.1 Hz, H-8), 6.25 (1H, d, J = 2.1 Hz, H- 6), 5.17 (1H, d, J = 7.8 Hz, H-1′′), 4.56 (1H, d, J = 1.6 Hz, H-1 ′′′), 3.85 (1H, J = 11.0, 1.6 Hz, H-6′′a), 3.67 (1H, dd, J = 3.5, 1.6 Hz, H-2′′′), 3.57 (1H, dd, J = 9.4, 3.4 Hz, H-3 ′′′), 3.53 (1H, m, 5′′′), 3.52 (1H, m, H-6′′b), 3.44 (1H, d, H-3 ′′), 3.42 (1H, m, H-2′′), 3.41 (1H, m, H-2′′), 3.34 (1H, m, H-5 ′′), 3.29 (1H, m, H-4′′′), 1.16 (3H, d, J = 6.2 Hz, H-6 ′′′);
13C-NMR (CD
3OD, 125 MHz): Table 2; TQD MS ES
−[M −H]
−m/z 611.51.
Cytotoxicity assay – The P-388 cells were seeded into 96-well plates at an initial cell density of approximately 3
× 10
4cells cm
−3. After 24 h of incubation for cell attach- ment and growth, varying concentrations of samples were added. The compounds added were first dissolved in DMSO at the required concentration. Subsequent six
desirable concentrations were prepared using PBS (pho- sphoric buffer solution, pH = 7.30 − 7.65). Control wells received only DMSO. The assay was terminated after a 48 h incubation period by adding MTT reagent [3-(4,5- dimethylthiazol-2-yl)-2,5-diphenyl tetrazolium bromide;
also named as thiazol blue] and the incubation was continued for another 4 h, in which the MTT-stop solution containing SDS (sodium dodecyl sulphate) was added and another 24 h incubation was conducted. Optical density was read by using a micro plate reader at 550 nm. IC
50values were taken from the plotted graph of percentage live cells compared to control (%), receiving only PBS and DMSO, versus the tested concentration of com- pounds ( μg/mL). The IC
50value is the concentration required for 50% growth inhibition. Each assay and analysis was run in triplicate and averaged.
Results and Discussion
The methanol extract of the fresh leaves of K. prolifera was succesively partitioned with n-hexane, EtOAc and n- BuOH. Repeated column chromatography using silica gel of the EtOAc soluble fractions led to the isolation of seven flavonoid compounds (Fig. 1). The structures of the isolated compounds were determined by spectroscopic methods including 1D, 2D NMR and ESI-TOFMS and TQD MS/MS. To the best our knowledge, compounds 1 - 7 were isolated from K. prolifera for the first time.
Compound 1 was obtained as yellow amorphous powder.
The molecular formula was established to be C
15H
10O
6from its ESI-TOFMS spectral data ( m/z 285.2263 [M- H]
+), and NMR spectra (Table 1), thus requiring eleven degrees of unsaturations. The UV spectrum of 1 showed λ
maxat 272 and 364 nm and exhibited a bathochromic shift by added NaoH and AlCl
3suggested the presence of flavonoid structure with 4 ′ and 5-hydroxyl groups
15. The IR spectrum of 1 showed the absorption band correspond to hydroxyl (3420 cm
−1), carbonyl (1690 cm
−1) and double bond (1605 cm
−1) groups. The
1H-NMR spectrum of 1 showed the presence of meta-coupled of aromatic protons at δ
H6.28 (1H, d, J = 2.0 Hz) and 6.52 (1H, d, J = 2.0 Hz) corresponds to H-6 and H-8, respectively. The
1H-NMR spectrum of 1 also showed the presence of two doublet signals at δ
H8.04 (2H, d, J = 2.8, 11.5 Hz, H-2′ and H-6′) and 6.95 (2H, d, J = 2.8, 9.7 Hz, H-3′ and H-5′) corresponds to four aromatic protons in ring B, characteristics for the 1 ′,4′-disubstituted flavone
16. A total fifteen carbon signals were observed in the
13C-NMR spectrum. These were assigned by DEPT and HMQC experiments to fourteen sp
2carbons and a carbonyl signal at δ
C176.6. The degree Table 2. Cytotoxicity activity of compounds 1 – 7 against P-388
murine leukemia cells
Compounds IC
50( μg/mL)
Kaempferol (1) 4.45 ± 0.05
Quercetin (2) 6.28 ± 0.02
Quercetin-3- O-glucoside (3) 29.15 ± 0.05
Kaempferol-3- O-glucoside (4) 35.92 ± 0.02
Kaempferol-3- O-rhamnoside (5) 32.15 ± 0.04
Quercetin-3-O-sophoriside (6) 50.44 ± 0.02
Quercetin-3-O-rutinoside (7) 58.54 ± 0.03
of unsaturations was accounted for eight out of the total eleven double bond equivalents. The remaining three degree of unsaturation were consistent to flavonol structure
17. A comparison of the NMR data of 1 with those of kaempferol,
18-20revealed that the structures of the two compounds are very similar, therefore, compound 1 was identified as kaempferol.
Compound 2 was obtained as a yellow amorphous powder. The ESI-TOFMS of 1 gave a ion peak [M-H]
+at m/z 301.40, compatible with the molecular formula C
15H
10O
7. Its UV absorptions in MeOH were consistent with the presence of a 3, 5, 7, 3 ′, 4′- pentahydroxyflavone structure
15. The
1H- and
13C-NMR spectra of 1 exhibited resonances due to aromatic systems. The
13C-NMR signals of 1 were assigned with the help of an HMQC experi- ment. In the
1H-NMR spectrum of 1, the aromatic region exhibited an ABX system at δ
H7.65 (1H, d, J = 2.1 Hz, H-2 ′), 7.50 (1H, dd, J = 2.1, 8.4 Hz, H-6′), and 6.87 (1H, d, J = 8.4 Hz, H-5′) due to a 3′, 4′ disubstitution of ring B and a typical meta-coupled pattern for H-6 and H-8 protons ( δ
C6.20 and 6.40, d, J = 2.0 Hz). The
13C-NMR spectrum of 1 showed the presence of 15 aromatic carbon signals. Based on the NMR data and comparison of the data given in the literature previously
18-19, the structure of compound 2 was identified as quercetin.
Compound 3 was isolated as yellow amorphous powder.
In the UV spectral analysis of 3 gave a typical MeOH spectrum of quercetin derivatives
15,18. The NMR spectra showed the presence of a quercetin moiety and sugar residue whose aglycone parts were the same as those of compound 2. An anomeric proton signal of 3 appeared at δ
H5.23 (1H, d, J = 7.6 Hz, H-1′′), and the resonances at δ
H3.71 (1H, dd, J = 2.5, 12.0 Hz, H-6b′′), 3.56 (1H, dd, J = 5.0 12.0, Hz, H-6a′′), 3.48 (1H, t, J = 9.2 Hz, H-2′′), 3.44 (1H, t, J = 8.8 Hz, H-3′′), 3.42 (1H, m, H-4′′), 3.39 (1H, m, H-5 ′′); together with the corresponding carbon resonances inferred from the HMQC spectrum suggested the presence of β-glucopyranose units. In the HMBC spectrum, a crosspeak between C-3 and H-1 ′′ established the linkage point quercetin and sugar moieties. Conse- quently, the structure of 3 was identified as quercetin-3- O- β-D-glucopyranoside
16,
21.
Compound 4 was isolated as yellow amorphous powder and has a molecular formula of C
21H
20O
11from its LC- MS spectral ( m/z 448.35) and NMR data (Table 1). In the UV and IR spectral analysis of 4 gave a typical spectra of kaempferol derivatives
15,17. The NMR spectra of 3 was very similar to those of 1, except the presence of an anomeric proton as a doublet at δ
Η5.48 corresponds to sugar residue and was identified as β-glucopyranose on
the basis of coupling constant ( J
1′′,2′′= 7.8 Hz)
19,22. The
13