http://e-nrp.org
Validation of dietary reference intake equations for estimating energy requirements in Korean adults by using the doubly labeled water method
Eun-Kyung Kim
1§, Jae-Hee Kim
1, Myung-Hee Kim
1, Didace Ndahimana
1, Seo-Eun Yean
1, Jin-Sook Yoon
2, Jung-Hyun Kim
3, Jonghoon Park
4and Kazuko Ishikawa-Takata
51Department of Food and Nutrition, Gangneung-Wonju National University, 120 Gangneungdaehangno, Gangneung, Gangwon 25457, Korea
2Department of Food and Nutrition, Keimyung University, Daegu 42601, Korea
3Department of Home Economics Education, Pai Chai University, Daejeon 35345, Korea
4Department of Physical Education, Korea University, Seoul 02841, Korea
5Department of Nutritional Education, National Institute of Health and Nutrition, Tokyo 162-8636, Japan
BACKGROUND/OBJECTIVES: The doubly labeled water (DLW) method is considered the gold standard for the measurement of total energy expenditure (TEE), which serves to estimate energy requirements. This study evaluated the accuracy of predictive dietary reference intake (DRI) equations for determining the estimated energy requirements (EER) of Korean adults by using the DLW as a reference method.
SUBJECTS/METHODS: Seventy-one participants (35 men and 36 women) aged between 20 and 49 years were included in the study. The subjects’ EER, calculated by using the DRI equation (EER
DRI), was compared with their TEE measured by the DLW method (TEE
DLW).
RESULTS: The DRI equations for EER underestimated TEE by -36.3 kcal/day (-1.3%) in men and -104.5 kcal/day (-4.9%) in women.
The percentages of accurate predictions among subjects were 77.1% in men and 62.9% in women. There was a strong linear correlation between EER
DRIand TEE
DLW(r = 0.783, P < 0.001 in men and r = 0.810, P < 0.001 in women).
CONCLUSIONS: The present study supports the use of DRI prediction equations to determine EER in Korean adults. More studies are needed to confirm our results and to assess the validity of these equations in other population groups, including children, adolescents, and older adults.
Nutrition Research and Practice 2017;11(4):300-306; https://doi.org/10.4162/nrp.2017.11.4.300; pISSN 1976-1457 eISSN 2005-6168
Keywords: Nutritional requirements, energy metabolism, adult
INTRODUCTION
5)The doubly labeled water (DLW) method is considered the gold standard for the measurement of total energy expenditure (TEE) [1,2]. The TEE can be used to obtain an individual’s estimated energy requirements (EER), based on observations that for an individual to maintain energy balance and a stable body weight, energy intake should be equal to energy expendi- ture [3,4]. The DLW method has been shown to be highly accurate, and it allows the possibility of measuring energy expenditure in free-living individuals [5]. However, the number of studies using the DLW method for the measurement of TEE is limited due to various challenges, including the high cost of DLW, expensive analytical equipment, and a high level of technical expertise required to obtain analytical measurements. In addition, it has been observed that most studies using the DLW method
were conducted on a limited number of subjects [3].
Nevertheless, total energy expenditure (TEE) measured by the DLW method (TEE
DLW) has been used as a basis for the calculation of a population’s EER in several developed countries including the USA, Canada, Australia, Germany, and Japan [3].
In 2002, the Institute of Medicine (IOM) of the National Academies established dietary reference intakes (DRI) for Americans and Canadians, and the equations for EER were developed by using pooled data from studies that had used the DLW method [3].
Since 2005, these equations have been used for establishment of EER in the Dietary Reference Intakes for Koreans (KDRI) [6].
Population characteristics such as ethnicity have been reported to be among the factors that affect energy expenditure [7]. However, the DRI predictive equations for EER, which were developed based on American and Canadian populations, have not been investigated for accuracy in the Korean population,
This research was financially supported by the Centers for Disease Control & Prevention (CDC) Korea (2012E3500800 and 2013E3500300).
§Corresponding Author: Eun-Kyung Kim, Tel. 82-33-640-2336, Fax. 82-33-640-2330. Email. [email protected] Received: March 6, 2017, Revised: April 11, 2017, Accepted: May 8, 2017
This is an Open Access article distributed under the terms of the Creative Commons Attribution Non-Commercial License (http://creativecommons.org/licenses/by-nc/3.0/) which permits unrestricted non-commercial use, distribution, and reproduction in any medium, provided the original work is properly cited.
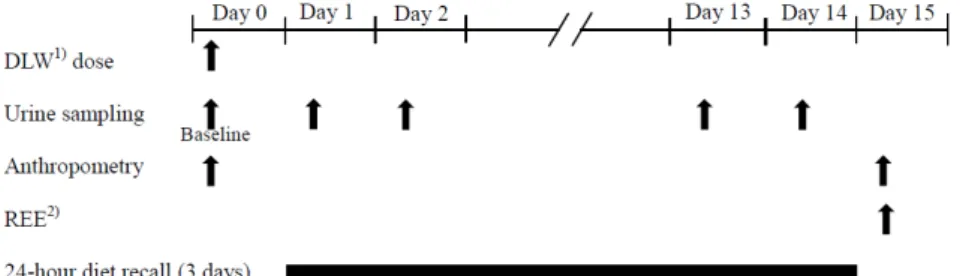
Fig. 1. Protocol of the study. 1)DLW: Doubly labeled water 2)REE: Resting energy expenditure
which has different ethnic characteristics from those in other countries [3]. The purpose of this study was to assess the accuracy of DRI equations for determining EER in Korean adults by using the DLW method as a reference method.
SUBJECTS AND METHODS Study subjects
Participants in this study were from the population of the Gangneung region in Gangwondo Province, Korea. Recruitment was done through internet advertisement and flyers that were displayed in the area. Subjects were between 20 and 49 years of age. The following inclusion criteria were applied: (1) normal weight (18.5 ≤ body mass index [BMI] < 25), (2) absence of disease or taking medication that affects energy metabolism, (3) not in a weight control program, (4) not a highly exercising individual, and (5) living in the study province for 2 weeks before and during the study. The present study initially involved a total of 72 adult participants, including 36 men and 36 women.
However, mid-study, one man dropped out and the final number was 71 participants.
Overview of the protocol
Before participating in the study, every participant signed a written informed consent. In addition, approval was received from the institutional review board of Gangneung-Wonju National University (approval GWNUIRB-2013-3). The TEE was measured over a 2 week period by using the DLW method, which has been described in detail elsewhere [2]. Briefly, the DLW dose was administered on day 0, after taking the baseline urine sample and obtaining anthropometric measurements.
Subjects were then instructed to take subsequent urine samples on postdose days 1, 2, 13, and 14. During this measurement period, a 24-hour dietary recall was conducted on 3 non- consecutive days for each subject (2 weekdays and 1 weekend day). On the last day of measurement (day 15), anthropometric measurements were taken and the participant’s resting energy expenditure (REE) was measured. The study protocol is presented in Fig. 1.
Anthropometric measurements
Subjects’ anthropometric measurements were taken on the first and last days of testing, to assess whether there was a body weight change during the testing period. Height was measured using an automatic extensometer (BSM 330, Biospace, Korea) with subjects standing upright with light clothing and
without shoes. In addition to obtaining body weight, the percentage of body fat and fat-free mass were measured by using the body composition analyzer (InBody 720, Biospace, Korea), which is based on a bioelectrical impedance method.
Resting energy expenditure
The subject’s REE was assessed by performing indirect calorimetry with a ventilated hood system (TrueOne2400, Parvo Medics, USA). To achieve accurate assessment of REE, participants were instructed to fast for at least 12 hours before measurement and to abstain from exercise during a pre-test period of 24 hours. On the morning of measurement day, they were instructed to refrain from physical activities as much as possible. After arriving at the laboratory, the subject was told to lie on a bed and rest for at least 10 minutes, after which the subject’s head was covered by the calorimetry canopy. During measurement, subjects breathed comfortably for 15 minutes and the volumes of consumed oxygen and produced carbon dioxide were measured. These measured volumes were applied in an abbreviated Weir’s formula [8,9] for the calculation of REE:
REE (kcal/day) = [3.941 × VO
2(L/min) + 1.106 × VCO
2(L/min)]
× 1440,
where VO
2is the volume of consumed O
2and VCO
2is the volume of produced CO
2.
Dietary data
The participants’ dietary data were collected within the two weeks of the DLW measurements by using a 24-hour dietary recall method. This was done for 3 non-consecutive days (2 weekdays and 1 weekend day) for each subject. On the day of dietary data collection, all foods and drinks consumed on the previous day were recorded. To minimize possible sources of error (recall bias) in the information on food intake, food models were used during the subject interview. Nutritional analysis of the recorded foods and drinks was performed by using the CAN-PRO 4.0 software, which was developed by the Korean Nutrition Society.
Measurement of TEE
TEE was assessed over a 14 day period by using the DLW method. The principles of this method have been extensively discussed elsewhere [2]. Briefly, the DLW was prepared by mixing 0.18 g of
18O (10%) per kilogram of total body water and 0.12 g of
2H (99.9%) per kilogram of total body water. The
18
O was purchased from Taiyo Nippon Sanso, Japan, while the
Men
(n = 35) Women
(n = 36)
Age (yrs) 33.5 ± 8.81) 33.3 ± 8.5
Height (cm) 172.6 ± 5.9 159.4 ± 5.9***
Body weight (kg) 69.1 ± 7.0 56.5 ± 8.5***
BMI (kg/m2)2) 23.2 ± 2.1 22.2 ± 3.2
% body fat3) 18.6 ± 5.1 30.1 ± 5.6***
Fat mass (kg)3) 12.9 ± 4.1 17.3 ± 5.3***
Fat-free mass (kg)3) 56.2 ± 5.8 39.2 ± 4.6***
Age distribution
20-29 yrs 13 (37)4) 12 (33)
30-39 yrs 12 (34) 12 (33)
40-49 yrs 10 (29) 12 (33)
1)Mean ± SD
2)BMI: Body mass index
3)Measured with Inbody 720 body composition analyzer
4)n (%)
Significant difference between male and female subjects, by independent Student’s t-test at ***P< 0.001
Table 1. Characteristics of the study subjects 2
H was purchased from Sigma-Aldrich, USA. Subject’s total body
water (TBW) was estimated as 60% of body weight [2]. Before DLW dose administration, subjects’ baseline urine samples were collected. Subsequently, every subject ingested 1.1 g of the DLW dose per kilogram of body weight. To avoid any loss of the dose, subjects were requested to drink with caution. In addition, the cup used for dose administration was rinsed with 100 mL of tap water, which was then ingested by the subject.
Subjects were then instructed to take further urine samples on the following day (day 1), as well as on days 2, 13, and 14.
The urine samples collected on day 0 were taken at the laboratory, whereas those collected on subsequent days were taken by subjects at their residences. To ensure the accuracy of results, every subject collected their urine samples at the same time of the day and collection times were recorded. In the morning of the urine sample collection day, the subject discarded the first urine voided after waking up, and the study sample was collected at least 2 hours later.
For urine sample analysis,
2H equilibration was done with platinum catalyst, and
18O was equilibrated by using CO
2gas.
The
2H and
18O isotopes in urine samples were measured by using an isotope ratio mass spectrometer (Finnigan Delta Plus, Thermo Fisher Scientific, USA). The rates of
2H and
18O elimination from the body (k
hand k
o, respectively) were calculated using the natural logarithm of the isotope concentrations in the urine samples. The rate of CO
2production (rCO
2) was calculated by using the following equation [2,10]:
rCO
2(mol/day) = 0.4554 × TBW (1.007 k
o- 1.041 k
h)
The food quotient (FQ) was calculated based on results of the 24-hour dietary survey, using the equation reported by Black et al. [11]. The obtained rCO
2and FQ were applied in the modified Weir formula [2,8] for the calculation of TEE
DLWas shown in the following formula:
TEE
DLW(kcal/day) = 3.9 (rCO
2/FQ) + 1.1 rCO
2Physical activity level (PAL) was calculated by using the following equation:
PAL = TEE
DLW/REE
DRI predictive equation for EER
In the present study, EER was calculated by using the DRI predictive equations developed by the IOM of the National Academies in 2002 [3]. In these equations, a physical activity (PA) coefficient was applied according to the subjects’ PAL. The IOM DRI equations for EER are given below:
EER
DRIfor men and women aged 19 years and older (kcal/day) = Men: 662 - 9.53 × age (years) + PA [15.91 × weight (kg) +
539.6 × height (m)], where
PA = 1.0 (sedentary), 1.11 (low active), 1.25 (active), or 1.48 (very active).
Women: 354 - 6.91 × age (years) + PA [9.36 × weight (kg) + 726 × height (m)],
where
PA = 1.0 (sedentary), 1.12 (low active), 1.27 (active), or 1.45 (very active).
Data analysis
Data analysis was performed by using IBM SPSS software, version 21.0 (IBM, USA). The difference between gender groups was assessed by using independent Student’s t-test. To assess the accuracy of the DRI predictive equation, EER
DRIwas compared with TEE
DLW. A prediction of EER
DRIbetween 90% and 110% of the TEE
DLWwas considered an accurate prediction, a prediction < 90% of the TEE
DLWwas classified as an under- prediction, and a prediction > 110% of the TEE
DLWwas classified as an overprediction [12,13]. The percentage of participants that had a predicted EER
DRIwithin ± 10% of the TEE
DLWwas considered a measure of accuracy on an individual level [14].
To evaluate how well the model predicted when using our DLW data, we determined the root mean squared prediction error (RMSE), which is a measure of precision [15]. This measure determines how close the predicted value for each subject (EER
DRI) was to the measured value (TEE
DLW) [16]. The following formula was used for calculation [17]:
RMSE = ( ∑ (
EERDRI– /TEEDLW)
2 N) .
Correlation analysis was performed to evaluate similar tendencies between two methods. To assess the agreement between the EER
DRIand TEE
DLW, the Bland-Altman test was performed. Limits of agreement between the two methods (mean difference ± 2SD) were calculated. Narrow limits of agreement indicate that the equation could be used with confidence as an alternative to undertaking DLW studies to determine EER [18]. All results are expressed as mean ± standard deviation (SD) values, and statistical significance was set at P
< 0.05 for all tests.
RESULTS
Characteristics of the subjects
A total of 71 healthy adults (35 men and 36 women) aged
20-49 years old participated in this study. Characteristics of the
subjects are summarized in Table 1. Height and body weight
Males
(n = 35) Females
(n = 36) REE (kcal/day)2) 1,695.3 ± 118.21) 1,375.3 ± 160.1***
REE/BW (kcal/kg/day)3) 24.6 ± 1.4 24.8 ± 2.2
REE/FFM (kcal/kg/day)4) 30.3 ± 2.2 35.5 ± 3.8***
TEEDLW (kcal/day)5) 2,706.0 ± 418.8 2,106.0 ± 329.4***
TEEDLW/BW (kcal/kg/day)6) 39.3 ± 5.7 37.4 ± 4.2 TEEDLW/FFM (kcal/kg/day)7) 48.2 ± 6.1 53.7 ± 5.4***
EERDRI (kcal/day)8) 2,670.0 ± 272.3 1,986.9 ± 218.8***
PAL9) 1.55 ± 0.19 1.46 ± 0.16*
1)Mean ± SD
2)REE: Resting energy expenditure
3)REE adjusted for body weight
4)REE adjusted for fat-free mass
5)Total energy expenditure measured with the DLW method
6)TEEDLW adjusted for body weight
7)TEEDLW adjusted for fat-free mass
8)Estimated energy requirement predicted by the DRI equation.
9)PAL = TEEDLW (kcal/day) / REE (kcal/day)
Significant differences between male and female subjects by independent t-test at
*P< 0.05 or ***P< 0.001.
Table 2. Energy expenditure of the study subjects
n Difference
EERDRI- TEEDLW (kcal/day) Bias2)
(%) Maximum negative
error (%)3) Maximum positive error (%)4) RMSE5)
(kcal/day) Accurate prediction6)
(%) Under prediction7)
(%) Over prediction8) (%)
Men 35 -36.3 ± 266.11) -1.3 ± 9.8 -23.4 17.4 188.1 77.1 11.4 11.4
Women 36 -104.5 ± 193.5 -4.9 ± 9.3 -20.4 13.6 173.8 62.9 28.6 8.6
Total 71 -70.4 ± 233.5 -2.9 ± 9.7 -23.4 17.4 181.0 70.0 20.0 10.0
TEEDLW: total energy expenditure measured with the DLW method
EERDRI: estimated energy requirements calculated with the DRI predictive equation
1)Mean ± SD
2)Mean percentage error between EERDRI and TEEDLW
3)The largest underprediction obtained from this predictive equation as a percentage of the measured value
4)The largest overprediction obtained from this predictive equation as a percentage of the measured value
5)RMSE: root mean squared prediction error.
6)The percentage of subjects predicted by the DRI predictive equation within 10% of TEEDLW.
7)The percentage of subjects predicted by the DRI predictive equation < 10% of TEEDLW.
8)The percentage of subjects predicted by the DRI predictive equation > 10% of TEEDLW.
Table 3. Accuracy of DRI predictive equations for EER based on EERDRI -TEEDLW difference, bias, root mean squared prediction error (RMSE), and percentage of accurate predictions
(A) Men (B) Women
Fig. 2. Correlation between EERDRI and TEEDLW in men (A) and women (B). TEEDLW: total energy expenditure measured with the DLW method. EERDRI: estimated energy requirements calculated by using the DRI predictive equation
were significantly higher in men than in women (172.6 ± 5.9 cm vs. 159.4 ± 5.9 cm and 69.1 ± 7.0 kg vs. 56.5 ± 8.5 kg, respectively) (P < 0.001). The average BMI was in the range of normal weight for both men and women (23.2 ± 2.1 kg/m
2and 22.2 ± 3.2 kg/m
2, respectively), while the percentage of body
fat was significantly higher in women (30.1% ± 5.6%) than in men (18.6% ± 5.1%) (P < 0.001). Women had also a higher body fat mass than men (17.3 ± 5.3 kg and 12.9 ± 4.1 kg, respectively, P < 0.001). In contrast, the fat-free mass (FFM) was higher in men (56.2 ± 5.8 kg) than in women (39.2 ± 4.6 kg) (P < 0.001).
Energy expenditure of the subjects
The results of subjects’ energy expenditures are shown in Table 2. The REE was significantly higher in men (1,695.3 ± 118.2 kcal/day) than in women (1,375.3 ± 160.1 kcal/day) (P < 0.001).
However, there was no significant difference between gender groups in the REE adjusted for body weight (REE/BW). Regarding the REE adjusted for fat-free mass (REE/FFM), it was significantly higher in women than in men (35.5 ± 3.8 kcal/kg/day and 30.3
± 2.2 kcal/kg/day, respectively) (P < 0.001). The TEE
DLWwas significantly higher in men compared to women (2,706.0 ± 418.8 kcal/day and 2,091.4 ± 322.2 kcal/day respectively, P <
0.001). Concerning the PAL, it was significantly higher in men (1.55 ± 0.19) than in women (1.46 ± 0.16) (P < 0.05).
Accuracy of the DRI predictive equations
Table 3 presents the results of the DRI predictive equation
accuracy assessment. The IOM DRI predictive equations
underestimated EER by 36.3 ± 266.1 kcal/day (percentage bias
of -1.3% ± 9.8%) in men and by 104.5 ± 193.5 kcal/day (percentage
bias of -4.9% ± 9.3%) in women. The percentages of accurate
(A) Men (B) Women
Fig. 3. Bland-Altman plots for the EERDRI andTEEDLW in men (A) and women (B). TEEDLW: total energy expenditure measured with the DLW method. EERDRI: estimated energy requirements calculated by using the DRI predictive equation
prediction were 77.1% in men and 62.9% in women. Concerning the RMSE, it was 188.1 kcal/day in men and 173.8 kcal/day in women. The maximum negative error was -23.4% in men and -20.4% in women, while the maximum positive error was 17.4%
in men and 13.6% in women.
A scatter plot of TEE
DLWcompared with EER
DRIis shown in Fig. 2. There was a strong correlation between TEE
DLWand EER
DRI(r = 0.783, P < 0.001 in men; r = 0.810, P < 0.001 in women).
The Bland-Altman plot for evaluation of agreement between EER
DRIand TEE
DLWis presented in Fig. 3. The subjects’ average bias between EER
DRIand TEE
DLWwas closer to zero in men than in women (-36.3 kcal/day and -104.5 kcal/day, respectively). The limits of agreement were smaller in women than in men (interval widths: 758.4 kcal/day for women and 1043.3 kcal/day for men).
DISCUSSION
In this study, TEE was measured in 71 non-obese Korean adults aged 20-49 years by using the DLW method. The objective was to validate the IOM DRI predictive equation for EER by comparing its results with those of TEE
DLW.In both men and women participants, the PAL was that of “low active”
people as defined in the IOM DRI report [3]. Our results are in agreement with the pooled results reported for different studies on Koreans’ PAL [19-24], which were used as a basis for the development of KDRI [5]. In those previous studies, the PAL was reported to be in the “low active” range (1.40-1.59).
Consistent with our expectations and results in previous reports [25,26], the subjects’ TEE
DLWand REE were significantly higher in men than in women (P < 0.001). This gender difference appears to be due to the higher body weight and higher FFM in men compared to women. As has been reported before [27-29], a person’s energy expenditure increases in proportion to the body weight and FFM. The higher TEE
DLWand REE in men compared to women were also reported in the Observing Protein and Energy Nutrition (OPEN) study, which was conducted by Tooze et al. [30]. In their study, the DLW method was used to assess TEE in 450 subjects aged 40-69 years in the USA.
Similar to our findings, their results showed that men had a
higher TEE
DLWthan that in women (2,899 ± 30 kg/day and 2,308
± 33 kg/day, respectively, P < 0.0001). Their findings on REE were also similar to our results, with men having a higher REE than that in women (1,716 ± 12 kg/day and 1,328 ± 13 kg/day, respectively, P < 0.0001). After adjusting the TEE
DLWand REE for body weight, we observed no significant gender difference (P
> 0.05); a difference that has been reported elsewhere [25]. In contrast, women had significantly higher TEE
DLW/FFM and REE/FFM than those in men. A similar reversal of gender difference in TEE after adjustment for FFM was observed in the OPEN study reported by Tooze et al. [30]. In contrast, Carpenter et al. [31] reported higher TEE
DLWand resting metabolic rates (RMR) in men than in women, even after adjusting for FFM.
This difference in study results could be due to the women in their study being older than the women in our study.
Studies on the measurement of TEE by applying the DLW method have been conducted in various countries [32-36], though the number of studies is limited. Among these, we have compared our results with two studies conducted in Japan, a population that has similar ethnic characteristics to those of Koreans. A study conducted by Ishikawa-Takata et al. [32] used the DLW method to assess TEE in 226 Japanese participants aged 20-83 years. Their results showed that TEE
DLWwas 11.21 MJ/day (2,679.3 kcal/day) in men and 8.42 MJ/day (2,012.4 kcal/day) in women; results that are not dissimilar to our findings (2,706.0 kcal/day in men and 2,091.4 kcal/day in women). Another study using the DLW method for the measurement of TEE was performed by Ishikawa-Takata et al.
[33] on 150 Japanese participants (74 males and 76 females) aged 20-59 years. Their results showed that TEE
DLWwas 10.78
± 1.67 MJ/day (2,576.5 ± 399.1 kcal/day) in men and 8.37 ± 1.30 MJ/day (2,000.5 ± 310.7 kcal/day) in women; values that are comparable to our study results.
In the present study, the accuracy of the IOM DRI predictive equations for EER was assessed by comparing the EER
DRIwith the TEE
DLW, and by analyzing the correlation between the results from the two methods. The percentage bias between EER
DRIand TEE
DLWwas -1.3% in men and -4.9% in women, implying
an acceptable level of accuracy when using the IOM DRI
predictive equations for EER [12]. The criterion of a predicted
value within ± 10% of the measured value as the definition of an accurate prediction has been used in other validation studies for prediction equations, including a study conducted by Frankenfield et al. [13] and another by Marra et al. [14]. In the OPEN study [30], which reported the DRI predictive equations for EER to be accurate and supported their use, the percentage bias between EER
DRIand TEE
DLWwas -7.5% in men and -5.9%
in women. Similar to the tendency observed in our bias results, the equations tended to underestimate the EER.
In our study, the percentage of accurate predictions, which is defined as the percentage of subjects predicted by the DRI predictive equations within 10% of TEE
DLW,was 77.1% in men and 62.9% in women. Similar results were obtained in the OPEN study [30], in which the percentage of accurate predictions was 68% in men and 64% in women, indicating that the equations’
predictive accuracy is higher in men than in women. The percentage of accurate predictions observed in the present study is comparable to the results in other studies that have confirmed the accuracy of predictive equations for the estimation of energy expenditure. In a study conducted by Siervo et al.
[37], which evaluated the accuracy of predictive equations for resting energy expenditure (REE) in older adults, the aggregate algorithm was confirmed to be accurate with an accurate prediction percentage of 63%. Another study reported by De la Torre et al. [25] assessed the accuracy of predictive equations for REE in healthy Puerto Rican adults. Their findings indicated the validity of the Harris-Benedict and Mifflin-St Jeor equations for the prediction of REE and reported accurate prediction percentages of 69% and 60%, respectively.
To further assess the accuracy of the IOM DRI predictive equations for EER, we performed a correlation analysis between EER
DRIand TEE
DLW. The results showed a strong correlation between the two methods (r = 0.783, P < 0.001 in men; r = 0.810, P < 0.001 in women), indicating the accuracy of the DRI equations. The OPEN study [30] also found the EER
DRIto be highly correlated with TEE
DLWwith the Pearson’s r of 0.93. In addition to the high correlation, we observed small RMSE values (188.1 kcal/day in men and 173.8 kcal/day in women), further indicating the accuracy of the DRI equations for EER [16]. The maximum negative error and maximum positive error also showed an acceptable range, considering the results reported elsewhere regarding the accuracy of predictive equations for determining energy expenditure [9].
A limitation of the present study is the small number of subjects. Second, the study only focused on participants aged 20-49 years, which limits its generalizability to other age groups.
Nevertheless, the present study is significant as it establishes a database for energy expenditure in Koreans with the data obtained via the DLW method.
In conclusion, our findings support the use of IOM DRI prediction equations for EER in Korean adults. More studies are needed to confirm our findings and to assess the validity of DRI equations in other population groups, including children, adolescents, and older adults.
CONFLICT OF INTEREST
The authors declare no potential conflicts of interest.
REFERENCES
1. Lifson N, Gordon GB, McClintock R. Measurement of total carbon dioxide production by means of D2O18. J Appl Physiol 1955;7:704-10.
2. Park J, Kazuko IT, Kim E, Kim J, Yoon J. Estimating free-living human energy expenditure: practical aspects of the doubly labeled water method and its applications. Nutr Res Pract 2014;8:241-8.
3. Institute of Medicine of the National Academies (US). Dietary Reference Intakes for Energy, Carbohydrate, Fiber, Fat, Fatty Acids, Cholesterol, Protein, and Amino Acids. Washington, D.C.: National Academies Press; 2002.
4. Hill JO, Wyatt HR, Peters JC. Energy balance and obesity. Circulation 2012;126:126-32.
5. Wong WW, Roberts SB, Racette SB, Das SK, Redman LM, Rochon J, Bhapkar MV, Clarke LL, Kraus WE. The doubly labeled water method produces highly reproducible longitudinal results in nutrition studies. J Nutr 2014;144:777-83.
6. Ministry of Health and Welfare (KR); The Korean Nutrition Society.
Dietary Reference Intakes for Koreans 2015. Sejong: Ministry of Health and Welfare; 2016.
7. Wang X, You T, Lenchik L, Nicklas BJ. Resting energy expenditure changes with weight loss: racial differences. Obesity (Silver Spring) 2010;18:86-91.
8. Weir JB. New methods for calculating metabolic rate with special reference to protein metabolism. J Physiol 1949;109:1-9.
9. Ndahimana D, Kim EK. Measurement methods for physical activity and energy expenditure: a review. Clin Nutr Res 2017;6:68-80.
10. Bhutani S, Racine N, Shriver T, Schoeller DA. Special considerations for measuring energy expenditure with doubly labeled water under atypical conditions. J Obes Weight Loss Ther 2015;5:002.
11. Black AE, Prentice AM, Coward WA. Use of food quotients to predict respiratory quotients for the doubly-labelled water method of measuring energy expenditure. Hum Nutr Clin Nutr 1986;40:381-91.
12. Weijs PJ. Validity of predictive equations for resting energy expenditure in US and Dutch overweight and obese class I and II adults aged 18-65 y. Am J Clin Nutr 2008;88:959-70.
13. Frankenfield D, Roth-Yousey L, Compher C. Comparison of predictive equations for resting metabolic rate in healthy nonobese and obese adults: a systematic review. J Am Diet Assoc 2005;105:775-89.
14. Marra M, Montagnese C, Sammarco R, Amato V, Della Valle E, Franzese A, Contaldo F, Pasanisi F. Accuracy of predictive equations for estimating resting energy expenditure in obese adolescents. J Pediatr 2015;166:1390-1396.e1.
15. Sheiner LB, Beal SL. Some suggestions for measuring predictive performance. J Pharmacokinet Biopharm 1981;9:503-12.
16. Taaffe DR, Thompson J, Butterfield G, Marcus R. Accuracy of equations to predict basal metabolic rate in older women. J Am Diet Assoc 1995;95:1387-92.
17. Barnston AG. Correspondence among the correlation, RMSE, and Heidke forecast verification measures; refinement of the Heidke score. Weather Forecast 1992;7:699-709.
18. Bland JM, Altman DG. Statistical methods for assessing agreement between two methods of clinical measurement. Lancet 1986;1:307-10.
19. Yoon JS. A study to determine the recommended dietary allowance of energy and to develop practical dietary education program for
Korean adults. Seoul: Ministry of Health and Welfare; 2002.
20. Kim Y, Na HJ. The estimation of the daily energy expenditure of Korean adolescents. Korean J Community Nutr 2003;8:270-9.
21. Choi HJ, Song JM, Kim EK. Assessment of daily steps, activity coefficient, body composition, resting energy expenditure and daily energy expenditure in female university students. J Korean Diet Assoc 2005;11:159-69.
22. Lee HM, Kim EK. Assessment of daily steps, physical activity and activity coefficient of the elementary school children in the rural area. Korean J Community Nutr 2007;12:361-71.
23. Lee JS, Lee GH, Kim EK. Assessment of daily steps, activity coefficient and daily energy expenditures of dieticians in Youngdong-area. J Korean Diet Assoc 2006;12:277-88.
24. Lee SH, Park JS, Kim EK. Assessment of daily steps, physical activities and activity coefficient of policemen who do shift-work. Korean J Nutr 2007;40:576-83.
25. de la Torre CL, Ramírez-Marrero FA, Martínez LR, Nevárez C.
Predicting resting energy expenditure in healthy Puerto Rican adults. J Am Diet Assoc 2010;110:1523-6.
26. Okubo H, Sasaki S, Rafamantanantsoa HH, Ishikawa-Takata K, Okazaki H, Tabata I. Validation of self-reported energy intake by a self-administered diet history questionnaire using the doubly labeled water method in 140 Japanese adults. Eur J Clin Nutr 2008;62:1343-50.
27. Harris JA, Benedict FG. A biometric study of human basal metabolism. Proc Natl Acad Sci U S A 1918;4:370-3.
28. Schofield WN. Predicting basal metabolic rate, new standards and review of previous work. Hum Nutr Clin Nutr 1985;39 Suppl 1:5-41.
29. Webb P. Energy expenditure and fat-free mass in men and women.
Am J Clin Nutr 1981;34:1816-26.
30. Tooze JA, Schoeller DA, Subar AF, Kipnis V, Schatzkin A, Troiano RP. Total daily energy expenditure among middle-aged men and women: the OPEN study. Am J Clin Nutr 2007;86:382-7.
31. Carpenter WH, Fonong T, Toth MJ, Ades PA, Calles-Escandon J, Walston JD, Poehlman ET. Total daily energy expenditure in free-living older African-Americans and Caucasians. Am J Physiol 1998;274:E96-101.
32. Ishikawa-Takata K, Naito Y, Tanaka S, Ebine N, Tabata I. Use of doubly labeled water to validate a physical activity questionnaire developed for the Japanese population. J Epidemiol 2011;21:114-21.
33. Ishikawa-Takata K, Tabata I, Sasaki S, Rafamantanantsoa HH, Okazaki H, Okubo H, Tanaka S, Yamamoto S, Shirota T, Uchida K, Murata M. Physical activity level in healthy free-living Japanese estimated by doubly labelled water method and International Physical Activity Questionnaire. Eur J Clin Nutr 2008;62:885-91.
34. Ndahimana D, Lee SH, Kim YJ, Son HR, Ishikawa-Takata K, Park J, Kim EK. Accuracy of dietary reference intake predictive equation for estimated energy requirements in female tennis athletes and non-athlete college students: comparison with the doubly labeled water method. Nutr Res Pract 2017;11:51-6.
35. Gonseth S, Dugas L, Viswanathan B, Forrester T, Lambert V, Plange-Rhule J, Durazo-Arvizu R, Luke A, Schoeller DA, Bovet P.
Association between smoking and total energy expenditure in a multi-country study. Nutr Metab (Lond) 2014;11:48.
36. St-Onge M, Mignault D, Allison DB, Rabasa-Lhoret R. Evaluation of a portable device to measure daily energy expenditure in free-living adults. Am J Clin Nutr 2007;85:742-9.
37. Siervo M, Bertoli S, Battezzati A, Wells JC, Lara J, Ferraris C, Tagliabue A. Accuracy of predictive equations for the measurement of resting energy expenditure in older subjects. Clin Nutr 2014;33:613-9.