ABSTRACT
BACKGROUND/OBJECTIVES: This study investigated gender and age differences in nutrient intake and dietary quality of people eating alone.
SUBJECTS/METHODS: From Korean National Health and Nutrition Examination Survey 2013–2016 data, 2,305 adults aged 20 years and older that ate meals alone were included in this study. Their energy and nutrients intakes, as well as their nutrient adequacy ratio (NAR), mean adequacy ratio (MAR), and index of nutritional quality (INQ) were analyzed. Food group consumption pattern, dietary variety score (DVS), dietary diversity score (DDS) were also analyzed. All data were compared among gender and age groups.
RESULTS: Men consumed more energy and nutrients than women, except for vitamin C, and the NARs showed similar gender differences. The INQs of 4 nutrients (calcium, vitamin A, vitamin C, and riboflavin) were lower than 1.0 in men, whereas only the calcium INQ was lower than 1.0 in women. Men had a lower DDS (3.6) than women (3.9) (P < 0.001) and had more ‘undesirable’ food group consumption patterns than women (P < 0.001). The intakes of calcium, vitamin A, and vitamin C were relatively low in the young-aged group (INQs less than 1.0). In the old-aged group, the MAR level was relatively low, and the INQs of calcium, riboflavin, and niacin were below 1.0. The old-aged group consumed more menu items, but their DVS was the lowest.
CONCLUSIONS: Compared to women, the dietary quality and food diversity among men were poorer. There were poorer quality and diversity patterns in the young-aged group compared to those of the older groups. An overall low intake of nutrients and the low nutrient density of meals were the main dietary problems among the old-aged group who eat alone. Therefore, men, particularly young- and old-aged, need to be prioritized in nutritional policies directed toward those who eat alone.
Keywords: Eating alone; gender; age groups; nutrition intake; dietary quality
INTRODUCTION
Commensality, eating together, is a fundamental social activity of human beings throughout time and in every culture [1]. However, rapid social changes have significantly modified
Original Research
Received: Dec 9, 2019 Revised: Feb 26, 2020 Accepted: Jul 7, 2020
§
Corresponding Author:
Youngmi Lee
Department of Food and Nutrition, Myongji University, 116 Myongji-ro, Cheoin-gu, Yongin 17058, Korea.
Tel. +82-31-330-1691 Fax. +82-31-335-7248 E-mail. [email protected]
©2021 The Korean Nutrition Society and the Korean Society of Community Nutrition This is an Open Access article distributed under the terms of the Creative Commons Attribution Non-Commercial License (https://
creativecommons.org/licenses/by-nc/4.0/) which permits unrestricted non-commercial use, distribution, and reproduction in any medium, provided the original work is properly cited.
ORCID iDs Yoonjin Ahn
https://orcid.org/0000-0002-7977-0715 Youngmi Lee
https://orcid.org/0000-0001-9965-0748 Haeryun Park
https://orcid.org/0000-0003-2627-6518 Kyunghee Song
https://orcid.org/0000-0001-9549-0716 Conflict of Interest
The authors declare no potential conflicts of interests.
Yoonjin Ahn , Youngmi Lee
§, Haeryun Park , and Kyunghee Song
Department of Food and Nutrition, Myongji University, Yongin 17058, Korea
Gender and age group differences in
nutrition intake and dietary quality of
Korean adults eating alone: based on
Korean National Health and Nutrition
Examination Survey Data, 2013–2016
Author Contributions
Conceptualization: Ahn Y, Lee Y; Data curation: Ahn Y; Formal analysis: Ahn Y, Lee Y; Investigation: Ahn Y; Methodology: Ahn Y, Lee Y, Park H, Song K; Project administration:
Lee Y; Supervision: Lee Y; Validation: Lee Y, Park H, Song K; Writing - original draft: Ahn Y, Lee Y; Writing - review & editing: Lee Y, Park H, Song K.
societal environments around eating together, and a decline in commensality has become a significant concern in modern societies. In conjunction with social changes in Korea, the dietary behavior of Koreans has also rapidly changed. The number of Korean people who eat alone has been increasing, and new terms related to eating alone have been coined, such as
‘honbabjok’ and ‘honbab’ [2].
Eating alone is a social concern that has emerged during a period of increased aging of the Korean population and increasing numbers of one-person households. The population of South Korea became an ‘aged society’ in 2018 and is expected to become a ‘super-aged society’ in 2026 [3]. The number of one-person households increased from 2.22 million (15.5% of the Korean population) in 2000 to 5.62 million (28.6% of the population) in 2017 [4]. One of 4 elderly Koreans aged 65 years old or above were reported to have eaten alone during the last year [5]; moreover, one-person households were more likely than multi- person households to eat alone [6,7]. Consequently, the number of ‘solo eaters’ is expected to increase in concert with the demographic changes.
Some previous studies reported associations of eating alone with various health problems.
The effect of eating alone on depression or mental illness, especially in older adults, has been widely reported [7-10], and eating alone is a direct risk factor for metabolic syndrome in middle-aged Koreans [11,12]. Unhealthy dietary behaviors of solo eaters have also been reported. Eating alone has been correlated with a lowering of food intake [13-15] and a high frequency of meal skipping [16,17]. Significant close associations between eating alone and an insufficient nutrient intake or a low level of food diversity in different age groups have also been reported [8,9,16-19].
Other studies have shown gender differences in eating alone behaviors. In one study, Korean women had lunch alone more often than men did, while men ate dinner alone more often than women did [20]. It was also reported that women ate significantly more and a greater variety of foods when eating together than when eating alone; however, men did not show such differences [21]. Moreover, Tani et al. [22] revealed that eating alone and living alone may be jointly associated with a higher prevalence of unhealthy eating behaviors in men but not in women. In middle-aged Korean adults, eating alone was associated significantly with a lower intake of potassium and calories from protein in men but not in women. In women, meal nutrient densities are reported to be higher when eating alone than when eating with others [19]. Dietary behaviors related to eating alone also differ by age, with young adults eating alone tending to consume simpler meals compared to those consumed by middle- aged adults when eating alone [23]. In addition, there are gender- and age-related differences in perceptions about eating alone. In men, eating alone was associated with negative
perceptions such as loneliness or boredom. Conversely, eating alone in women was perceived as positive and associated with key words such as ‘free’, ‘joy’, and ‘my own time’ [20]. Also, compared to older adults, young adults reported feeling a greater level of convenience related to eating alone [23]. These various studies indicate there are gender and age differences in the nutritional intake of people who eat alone.
However, many previous studies have focused on nutrition intake and dietary quality
differences between people who eat alone and those who eat together. There is an absence
of detailed comparisons of dietary characteristics among the different types of solo eaters,
and few studies have focused on gender- and age-related differences. Eating alone is not a
phenomenon confined to a particular demographic group, such as one-person households.
Since eating alone has become a typical diet pattern in busy modern societies, more in-depth studies are necessary. Accordingly, this study investigated gender and age group differences in dietary characteristics of solo eaters in order to obtain baseline data that will be useful in future research into improving the diet of solo eaters.
SUBJECTS AND METHODS
Subjects
This study used data obtained by the Korean National Health and Nutrition Examination Survey (KNHANES) from 2013 to 2016. The KNHANES protocol was approved by the Institutional Review Board of the Korea Centers for Disease Control and Prevention (2013-07CON-03-4C, 2013-12EXP-03-5C, 2015-01-02-6C). Among a total of 31,098 subjects, 18,130 subjects aged 20 years and older had participated in both health and nutrition surveys.
Of the latter, 2,663 responded that they had eaten all meals alone in the past year and, thus, were selected for inclusion in this study. In order to avoid outlier-related errors, subjects with daily calories intake levels less than 500 kcal/day or more than 5,000 kcal/day were excluded [24]. The final number of subjects who satisfied the inclusion criteria was 2,305.
In this study, subjects who answered ‘no’ to the survey question ‘have you mostly eaten with other people in general for the last one year?’ were defined as solo eaters. Based on the results of previous studies, which showed that people who eat alone had a high tendency to skip meals [16,17,22], subjects that consumed only one or 2 meals per day were included in the study.
Dietary habits
Meal and eating-out frequencies were analyzed. The meal frequency for each meal was determined for 4 categories: ‘5–7 times a week,’ ‘3–4 times a week,’ ‘1–2 times a week,’ and
‘nearly none,’ whereas the categories for the frequency of eating out were: ‘at least once a day,’
‘3–6 times a week,’ ‘1–2 times a week,’ ‘1–3 times a month,’ and ‘nearly none.’
Energy and nutrient intakes
The amounts of energy and major nutrients consumed by the subjects were analyzed using data obtained from 24-hour recall-based responses. Nutrient adequacy ratio (NAR), mean adequacy ratio (MAR), and index of nutritional quality (INQ) were calculated. The NAR was calculated for energy and 9 nutrients (protein, calcium, phosphorus, iron, vitamin A, thiamine, riboflavin, niacin, and vitamin C) based on the 2015 Korean Nutrient Intake Criteria [25]. The NAR maximum range was regarded as ‘1’ even if the ratio exceeded 1. The MAR was calculated according to the method reported by Madden et al. [26,27]. The INQ was used to compare the recommended and actual intakes of nutrients per 1,000 kcal of energy intake. Meal quality was considered ‘good’ if the INQ was 1.0 or higher.
Meal diversity
In order to assess the diversity of the meals consumed by the subjects, the number of menu
items consumed, as well as the dietary variety score (DVS), food group intake pattern (grain,
meat, vegetable, fruit, and dairy product [GMVFD] pattern), and the dietary diversity score
(DDS) were determined. The number of menu items consumed was calculated based on food
code that were included in the subjects' 24-hour dietary recall data. Based on the report by Kant
et al. [28], minimum food intake levels were applied to calculate DVS, GMVFD pattern, and
DDS. To obtain the GMVFD pattern, 1 point was given when the minimum amount of food from
each food group was consumed and 0 point for the food group not consumed. The maximum score for the DDS was 5 points, which reflects the consumption of all 5 food groups.
Statistical analysis
All statistical analyses, which included complex sample analyses such as cluster sampling, estimation of variance, and factor-weighting adjustments were performed using the SPSS 25.0 statistical package (SPSS Inc., Chicago, IL, USA). All data were compared according to gender and age group. Each subject was classified as young-aged (aged 20–34 years), prime-aged (aged 35–49 years), middle-aged (aged 50–64 years), or old-aged (aged 65 years and more) according to their ages during the relevant KNHANES year. Differences between groups in categorical variable results were analyzed using the χ
2test, whereas differences between groups in continuous variables were analyzed using linear regression models. The data were analyzed in 2 ways: model 1 was used to provide results without adjusting for confounding variables; model 2 provided results after adjusting for confounding variables.
Age, education level, job status, income level, and marital status variables were adjusted in the model 2 analysis of gender. Gender, residence area, education level, job status, household type, and marital status variables were adjusted in the model 2 analysis of age groups.
Statistical significance was present when P < 0.05.
RESULTS
General characteristics
Among 18,130 participants aged 20 years and older that participated in both the health and nutrition surveys within KNHANES, 12.7% were classified as solo eaters (9.8% of men and 14.7% of women). Among the participants aged 65 years and older, 24.0% were solo eaters (14.5% of men and 31.5% of women). Among the participants that resided in one-person households, 57.6% were solo eaters, whereas less than 10% of the other household types were solo eaters (table was not presented).
Table 1 shows the general characteristics of the subjects. The average age of women was 57.0 years, which was significantly higher than the average age of the men (48.8 years; P < 0.001).
The percentage employed was higher in men (51.6%) than in women (38.0%; P < 0.001), but the percentage of men that were married (59.8%) was significantly lower than that of women (86.1%; P < 0.001). There were no significant gender-related differences in residence area or household type.
Gender, residence area, education level, job status, household type, and marital status were significantly different among the 4 age groups (P < 0.001 for all). There were remarkably more women in the old-aged group (71.7%) than in other age groups. More than half of the old-aged group (57.4%) were members of a one-person household type, whereas the percentage of one-person households in the young-aged (16.8%) and prime-aged (21.0%) groups were notably lower. There was no significant difference in income levels among the age groups.
Dietary habits
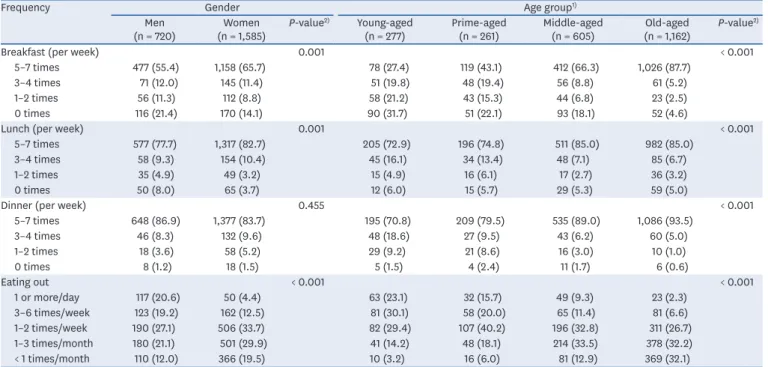
A summary of the meal and eating-out frequencies of the subjects is presented in Table 2.
There were significant gender-related differences among the frequencies of breakfast (P =
0.001), lunch (P = 0.001), and eating out (P < 0.001). However, no significant difference
between genders was detected for dinner frequencies. The percentages of men who skipped breakfast and lunch every day were 21.4% and 8.0%, respectively, which were higher than those of women (14.1% and 3.7%, respectively). The frequency of eating out at least once a day was 20.6% in men and only 4.4% in women.
The frequencies of all meals and of eating out were significantly different by age group (P
< 0.001 for all). Meal skipping tended to decrease, and eating out tended to increase with increasing age. Approximately one-third of the young-aged group (31.7%) skipped breakfast, but only 4.6% of old-aged subjects skipped breakfast. The young-aged group had a high percentage of eating out at least once a day (23.1%), whereas only 2.3% of the old-aged ate out one or more times per day.
Energy and nutrients intake
A summary of the energy and nutrient intakes is presented in Table 3. The intakes of energy and nutrients except for vitamin A were significantly different by gender. The analysis revealed that energy consumption and consumption of all nutrients except vitamins A and Table 1. General characteristics of the subjects
Characteristic Gender Age group
1)Men
(n = 720) Women
(n = 1,585) P-value
2)Young-aged
(n = 277) Prime-aged
(n = 261) Middle-aged
(n = 605) Old-aged
(n = 1,162) P-value
2)Gender - < 0.001
Men - - 122 (55.8) 85 (43.0) 206 (42.0) 307 (28.3)
Women - - 155 (44.2) 176 (57.0) 399 (58.0) 855 (71.7)
Age
20–34 122 (16.9) 155 (9.8) < 0.001 - - - - -
35–49 85 (11.8) 176 (11.1) - - - -
50–64 206 (28.6) 399 (25.1) - - - -
≥ 65 307 (42.6) 855 (53.9) - - - -
Average 48.81 ± 0.89 57.03 ± 0.62 < 0.001 27.21 ± 0.11 42.21 ± 0.09 56.12 ± 0.07 72.38 ± 0.09 < 0.001
Residence area 0.125 < 0.001
Urban 591 (86.5) 1,258 (83.8) 250 (91.4) 230 (89.4) 505 (85.6) 864 (78.2)
Rural 129 (13.5) 327 (16.2) 27 (8.6) 31 (10.6) 100 (14.4) 298 (21.8)
Education level < 0.001 < 0.001
≤ Elementary school 247 (23.0) 881 (45.0) 4 (1.5) 15 (5.0) 230 (33.1) 879 (74.0)
Middle school 101 (11.1) 173 (11.1) 5 (1.5) 25 (9.0) 116 (20.1) 128 (11.4)
High school 215 (37.9) 281 (22.3) 117 (45.5) 104 (42.1) 169 (30.9) 106 (10.3)
≥ College 157 (27.9) 250 (21.5) 151 (51.6) 117 (43.9) 90 (15.8) 49 (4.3)
Job status < 0.001 < 0.001
Employed 353 (51.6) 548 (38.0) 132 (46.6) 159 (64.2) 308 (52.5) 302 (25.8)
Unemployed 367 (48.4) 1,037 (62.0) 145 (53.4) 102 (35.8) 297 (47.5) 860 (74.2)
Income level
3)0.001 0.571
Lowest 305 (42.1) 521 (32.1) 92 (36.8) 88 (35.2) 254 (40.1) 392 (33.0)
Lower middle 174 (24.3) 446 (25.6) 62 (22.6) 63 (24.4) 141 (23.2) 354 (28.4)
Higher middle 123 (17.4) 339 (21.9) 67 (21.5) 51 (19.9) 108 (19.0) 236 (20.1)
Highest 118 (16.3) 279 (20.4) 56 (19.2) 59 (20.5) 102 (17.6) 180 (18.5)
Household type 0.235 < 0.001
One-person 311 (34.1) 793 (37.2) 41 (16.8) 56 (21.0) 227 (32.4) 780 (57.4)
1 generational 118 (12.5) 164 (11.0) 25 (7.9) 34 (12.9) 107 (16.4) 116 (9.9)
2 generational 256 (47.3) 526 (43.7) 187 (66.5) 157 (60.8) 243 (46.7) 195 (23.7)
3 generational 35 (6.0) 102 (8.0) 24 (8.9) 14 (5.4) 28 (4.6) 71 (9.0)
Marital status < 0.001 < 0.001
Married 539 (59.8) 1,446 (86.1) 63 (16.5) 207 (76.3) 570 (94.1) 1,145 (98.7)
Single 181 (40.2) 139 (13.9) 214 (83.5) 54 (23.7) 35 (5.9) 17 (1.3)
Values are presented as number (%) or mean ± SD. Unweighted frequencies and weighted percentages are presented. The data were analyzed by the Complex Samples module of SPSS software.
1)
Young-aged = 20–34 years old, prime-aged = 35–49 years old, middle-aged = 50–64 years old, old-aged = 65 years old and more;
2)P-value by χ
2test or analysis
of variance;
3)Divided into quartile groups.
C were higher in men than in women. Similar results were obtained after adjusting for the confounding variables (subject age, education level, job status, income level, and marital status; model 2). On average, men consumed 2,121 kcal, whereas women consumed 1,647 kcal (P < 0.001). However, women's intake of vitamin C (100.5 mg) was significantly higher Table 2. Meal and eating-out frequency of the subjects
Frequency Gender Age group
1)Men
(n = 720) Women
(n = 1,585) P-value
2)Young-aged
(n = 277) Prime-aged
(n = 261) Middle-aged
(n = 605) Old-aged
(n = 1,162) P-value
2)Breakfast (per week) 0.001 < 0.001
5–7 times 477 (55.4) 1,158 (65.7) 78 (27.4) 119 (43.1) 412 (66.3) 1,026 (87.7)
3–4 times 71 (12.0) 145 (11.4) 51 (19.8) 48 (19.4) 56 (8.8) 61 (5.2)
1–2 times 56 (11.3) 112 (8.8) 58 (21.2) 43 (15.3) 44 (6.8) 23 (2.5)
0 times 116 (21.4) 170 (14.1) 90 (31.7) 51 (22.1) 93 (18.1) 52 (4.6)
Lunch (per week) 0.001 < 0.001
5–7 times 577 (77.7) 1,317 (82.7) 205 (72.9) 196 (74.8) 511 (85.0) 982 (85.0)
3–4 times 58 (9.3) 154 (10.4) 45 (16.1) 34 (13.4) 48 (7.1) 85 (6.7)
1–2 times 35 (4.9) 49 (3.2) 15 (4.9) 16 (6.1) 17 (2.7) 36 (3.2)
0 times 50 (8.0) 65 (3.7) 12 (6.0) 15 (5.7) 29 (5.3) 59 (5.0)
Dinner (per week) 0.455 < 0.001
5–7 times 648 (86.9) 1,377 (83.7) 195 (70.8) 209 (79.5) 535 (89.0) 1,086 (93.5)
3–4 times 46 (8.3) 132 (9.6) 48 (18.6) 27 (9.5) 43 (6.2) 60 (5.0)
1–2 times 18 (3.6) 58 (5.2) 29 (9.2) 21 (8.6) 16 (3.0) 10 (1.0)
0 times 8 (1.2) 18 (1.5) 5 (1.5) 4 (2.4) 11 (1.7) 6 (0.6)
Eating out < 0.001 < 0.001
1 or more/day 117 (20.6) 50 (4.4) 63 (23.1) 32 (15.7) 49 (9.3) 23 (2.3)
3–6 times/week 123 (19.2) 162 (12.5) 81 (30.1) 58 (20.0) 65 (11.4) 81 (6.6)
1–2 times/week 190 (27.1) 506 (33.7) 82 (29.4) 107 (40.2) 196 (32.8) 311 (26.7)
1–3 times/month 180 (21.1) 501 (29.9) 41 (14.2) 48 (18.1) 214 (33.5) 378 (32.2)
< 1 times/month 110 (12.0) 366 (19.5) 10 (3.2) 16 (6.0) 81 (12.9) 369 (32.1)
Values are presented as number (%). Unweighted frequencies and weighted percentages are presented. The data were analyzed by the Complex Samples module of SPSS software.
1)
Young-aged = 20–34 years old, prime-aged = 35–49 years old, middle-aged = 50–64 years old, old-aged = 65 years old and more;
2)P-value by χ
2test.
Table 3. Energy and nutrients intake of the subjects
Gender Age group
1)Men
(n = 720) Women
(n = 1,585) P-value
2)P-value
3)Young-aged
(n = 277) Prime-aged
(n = 261) Middle-aged
(n = 605) Old-aged
(n = 1,162) P-value
2)P-value
3)Energy (kcal) 2,121.34 ± 40.94 1,647.43 ± 21.50 < 0.001 < 0.001 2,052.69 ± 86.61 1,926.00 ± 58.67 1,842.66 ± 39.66 1,662.46 ± 40.82 < 0.001 < 0.001 Protein (g) 70.90 ± 1.70 55.30 ± 0.89 < 0.001 < 0.001 71.31 ± 3.54 64.76 ± 2.72 61.16 ± 1.61 54.38 ± 1.67 < 0.001 < 0.001 Fat (g) 43.88 ± 1.66 34.68 ± 0.81 < 0.001 < 0.001 54.46 ± 3.46 42.71 ± 2.44 35.68 ± 1.40 28.33 ± 1.42 < 0.001 < 0.001 Carbohydrate (g) 320.90 ± 5.89 271.00 ± 3.68 < 0.001 < 0.001 295.87 ± 12.15 289.89 ± 9.52 295.79 ± 6.24 285.26 ± 6.84 0.002 0.606 Calcium (mg) 470.22 ± 13.91 420.52 ± 8.24 < 0.001 0.003 409.62 ± 29.21 469.82 ± 25.28 480.03 ± 17.60 418.11 ± 14.96 < 0.001 0.002 Phosphorus (mg) 1,069.67 ± 24.91 889.75 ± 12.68 < 0.001 < 0.001 1,007.56 ± 51.98 1,014.20 ± 43.08 1,006.45 ± 23.64 878.33 ± 24.49 < 0.001 < 0.001 Iron (mg) 18.64 ± 1.78 14.37 ± 0.27 0.021 0.016 15.83 ± 0.98 14.94 ± 0.92 18.24 ± 2.43 15.15 ± 0.52 0.003 0.565 Sodium (mg) 3,825.36 ± 98.16 2,851.14 ± 60.71 < 0.001 < 0.001 3,422.83 ± 193.37 3,374.76 ± 160.10 3,328.26 ± 112.12 3,013.00 ± 103.66 < 0.001 0.061 Potassium (mg) 2,898.62 ± 75.12 2,623.48 ± 48.24 0.002 0.003 2,621.20 ± 155.00 2,859.76 ± 149.59 2,980.71 ± 80.43 2,568.00 ± 80.36 < 0.001 < 0.001 Vitamin A (RE) 644.22 ± 28.07 663.68 ± 36.55 0.970 0.692 604.34 ± 62.11 642.69 ± 55.05 765.14 ± 59.29 612.03 ± 39.44 < 0.001 0.076 Thiamine (mg) 2.04 ± 0.06 1.66 ± 0.03 < 0.001 < 0.001 1.95 ± 0.13 1.95 ± 0.08 1.83 ± 0.05 1.65 ± 0.05 < 0.001 0.002 Riboflavin (mg) 1.31 ± 0.03 1.13 ± 0.02 < 0.001 < 0.001 1.25 ± 0.08 1.34 ± 0.06 1.29 ± 0.04 1.06 ± 0.04 < 0.001 < 0.001 Niacin (mg) 15.79 ± 0.41 13.10 ± 0.24 < 0.001 < 0.001 15.89 ± 0.90 14.99 ± 0.66 14.46 ± 0.41 12.55 ± 0.42 < 0.001 0.001 Vitamin C (mg) 86.02 ± 4.70 100.52 ± 3.76 0.009 0.014 72.92 ± 11.19 84.68 ± 8.33 114.12 ± 6.92 98.19 ± 6.78 0.001 0.009 Energy (%)
Carbohydrate 63.05 ± 0.57 67.61 ± 0.37 < 0.001 < 0.001 60.78 ± 1.12 62.18 ± 1.05 66.11 ± 0.62 70.24 ± 0.67 < 0.001 < 0.001 Protein 13.20 ± 0.19 13.17 ± 0.12 0.149 0.897 13.61 ± 0.36 13.13 ± 0.29 13.21 ± 0.22 12.91 ± 0.20 < 0.001 0.392 Fat 17.23 ± 0.36 17.53 ± 0.24 0.001 0.491 22.20 ± 0.73 18.63 ± 0.62 16.76 ± 0.41 14.32 ± 0.43 < 0.001 < 0.001 Values are presented as mean ± SE. Values are in model 2 (adjusted for confounding variables). The data were analyzed by the Complex Samples module of SPSS software.
1)
Young-aged = 20–34 years old, prime-aged = 35–49 years old, middle-aged = 50–64 years old, old-aged = 65 years old and more;
2)P-value by χ
2test or analysis
of variance in model 1 (crude),
3)P-value by χ
2test or analysis of variance in model 2 (adjusted for confounding variables).
than that in men (86.0 mg; P = 0.014). Regarding the percentage energy contributions of carbohydrate, protein, and fat, only the carbohydrate energy contribution was significantly different between women (67.6%) and men (63.1%; P < 0.001) after adjusting for the confounding variables (model 2).
Age group-based model 1 analyses revealed significant differences in the intakes of energy and all assessed nutrients; however, there were no significant differences among age groups in the intakes of carbohydrates, iron, sodium, and vitamin A after adjusting for the confounding variables (model 2). The intakes of energy, protein, fat, thiamine, and niacin tended to decrease with increasing age. The intakes of calcium, vitamin A, and vitamin C were lowest in the young-aged group, whereas the intakes of those nutrients, including iron, were highest in the middle-aged group. Sodium intake tended to decrease with age, but the decrease was not significant after adjusting for the confounding variables (P = 0.061; model 2). The percentage energy contributions of carbohydrates (P < 0.001) and fat (P < 0.001) were significantly different among the age groups. The energy contribution of carbohydrate tended to increase whereas that of fat tended to decrease with increasing age.
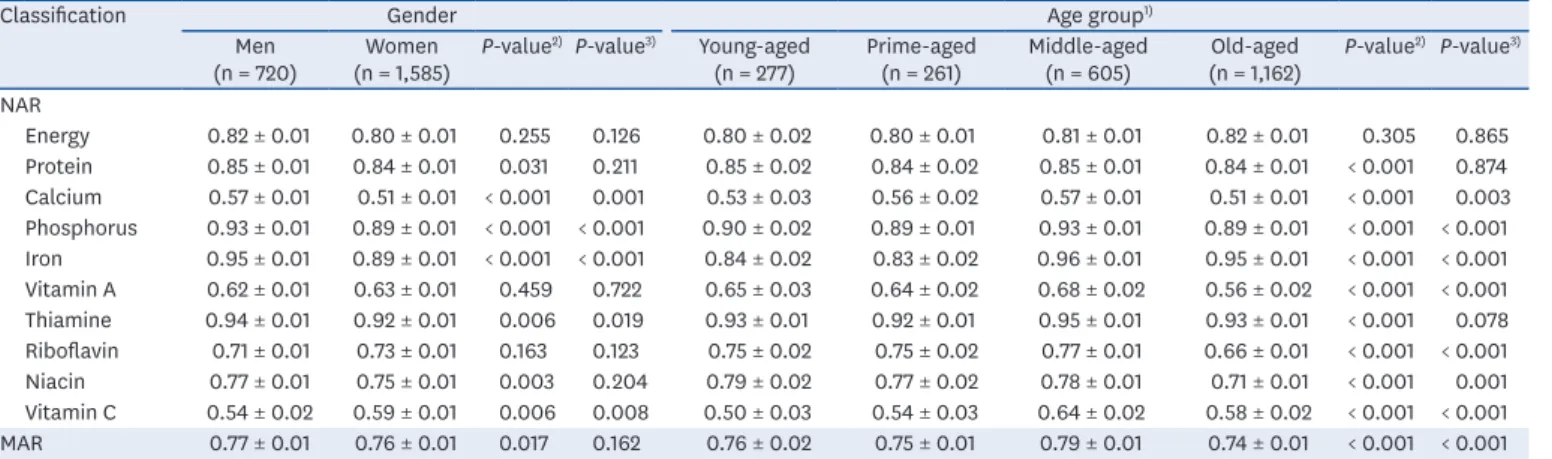
The model 1 assessment of nutrient adequacy revealed no significant differences in NAR of energy, but all nutrients except for vitamin A and riboflavin showed differences by gender.
After adjusting for the confounding variables, similar results were shown, but protein and niacin also showed no significant differences between genders. The NAR for vitamin C was significantly higher in women (0.59) than in men (0.54; P = 0.008) whereas the NARs for calcium (P = 0.001), phosphorus (P < 0.001), iron (P < 0.001), and thiamine (P = 0.019) was higher in men than in women. No significant gender-related difference in MAR was observed after adjusting for the confounding variables (Table 4).
Comparisons of NAR by age group showed no significant difference in energy intake, but model 1 results showed significant differences in the intakes of all assessed nutrients.
However, after adjusting for the confounding variables, the differences in protein and thiamine were no longer significant. The NARs of calcium in the young- and old-aged groups were relatively lower than those in the other 2 groups. The NARs of iron were relatively low
Table 4. The NAR and MAR of the subjects
Classification Gender Age group
1)Men
(n = 720) Women
(n = 1,585) P-value
2)P-value
3)Young-aged
(n = 277) Prime-aged
(n = 261) Middle-aged
(n = 605) Old-aged
(n = 1,162) P-value
2)P-value
3)NAR
Energy 0.82 ± 0.01 0.80 ± 0.01 0.255 0.126 0.80 ± 0.02 0.80 ± 0.01 0.81 ± 0.01 0.82 ± 0.01 0.305 0.865
Protein 0.85 ± 0.01 0.84 ± 0.01 0.031 0.211 0.85 ± 0.02 0.84 ± 0.02 0.85 ± 0.01 0.84 ± 0.01 < 0.001 0.874 Calcium 0.57 ± 0.01 0.51 ± 0.01 < 0.001 0.001 0.53 ± 0.03 0.56 ± 0.02 0.57 ± 0.01 0.51 ± 0.01 < 0.001 0.003 Phosphorus 0.93 ± 0.01 0.89 ± 0.01 < 0.001 < 0.001 0.90 ± 0.02 0.89 ± 0.01 0.93 ± 0.01 0.89 ± 0.01 < 0.001 < 0.001 Iron 0.95 ± 0.01 0.89 ± 0.01 < 0.001 < 0.001 0.84 ± 0.02 0.83 ± 0.02 0.96 ± 0.01 0.95 ± 0.01 < 0.001 < 0.001 Vitamin A 0.62 ± 0.01 0.63 ± 0.01 0.459 0.722 0.65 ± 0.03 0.64 ± 0.02 0.68 ± 0.02 0.56 ± 0.02 < 0.001 < 0.001 Thiamine 0.94 ± 0.01 0.92 ± 0.01 0.006 0.019 0.93 ± 0.01 0.92 ± 0.01 0.95 ± 0.01 0.93 ± 0.01 < 0.001 0.078 Riboflavin 0.71 ± 0.01 0.73 ± 0.01 0.163 0.123 0.75 ± 0.02 0.75 ± 0.02 0.77 ± 0.01 0.66 ± 0.01 < 0.001 < 0.001 Niacin 0.77 ± 0.01 0.75 ± 0.01 0.003 0.204 0.79 ± 0.02 0.77 ± 0.02 0.78 ± 0.01 0.71 ± 0.01 < 0.001 0.001 Vitamin C 0.54 ± 0.02 0.59 ± 0.01 0.006 0.008 0.50 ± 0.03 0.54 ± 0.03 0.64 ± 0.02 0.58 ± 0.02 < 0.001 < 0.001 MAR 0.77 ± 0.01 0.76 ± 0.01 0.017 0.162 0.76 ± 0.02 0.75 ± 0.01 0.79 ± 0.01 0.74 ± 0.01 < 0.001 < 0.001 Values are presented as mean ± SE. Values are in model 2 (adjusted for confounding variables). The data were analyzed by the Complex Samples module of SPSS software.
NAR, nutrient adequacy ratio; MAR, mean adequacy ratio.
1)
Young-aged = 20–34 years old, prime-aged = 35–49 years old, middle-aged = 50–64 years old, old-aged = 65 years old and more;
2)P-value by χ
2test or analysis
of variance in model 1 (crude);
3)P-value by χ
2test or analysis of variance in model 2 (adjusted for confounding variables).
in the young- and prime-aged groups, while those for vitamin A, riboflavin, and niacin were relatively low in the old-aged group. The NAR of vitamin C in the young-aged group (0.5) was relatively lower than those of the other groups (0.54–0.64). The MARs were significantly different among the 4 age groups (P < 0.001), with the highest score in the middle-aged group. Overall, the middle-aged group showed relatively high NARs for most nutrients, while those of the old-aged group were relatively low.
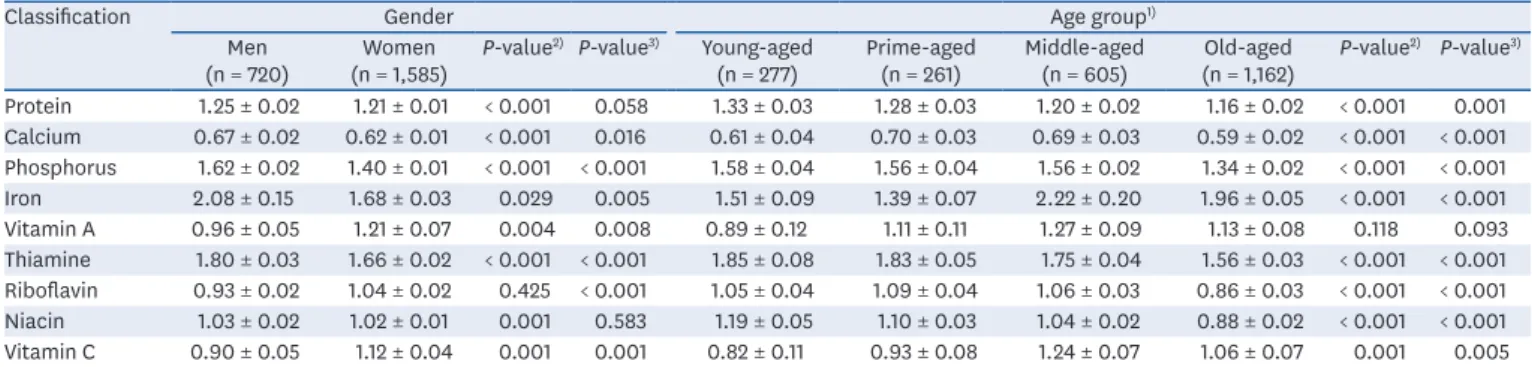
The results of the INQ assessments are shown in Table 5. After adjusting for the confounding variables, the differences in the nutritional quality of protein and niacin detected by model 1 were absent, and a difference in the INQ for riboflavin was detected (P < 0.001). The INQs of men were lower than 1.0 in 4 nutrients (calcium, vitamin A, riboflavin, and vitamin C), whereas only the calcium INQ was less than 1.0 in women; the INQ of calcium was 0.62 in women, significantly lower than that in men (0.67; P = 0.016). In addition, women showed lower INQs for phosphorus (P < 0.001), iron (P = 0.005), and thiamine (P < 0.001) than those for men. However, the INQs for vitamin A (P = 0.008), riboflavin (P < 0.001), and vitamin C (P
< 0.001) were higher in women than in men.
The INQs of all the nutrients except vitamin A were significantly different among the age groups, and the same results were observed after adjusting for the confounding variables.
The INQs of calcium (0.59), riboflavin (0.86), and niacin (0.88) in the old-aged group were relatively lower than those in the other age groups. In the young-aged group, the INQs of vitamin A (0.89) and C (0.82) were notably lower than in the other 3 age groups. There were 3 INQs lower than 1.0 in the young- (calcium, vitamin A, and vitamin C) and old-aged (calcium, riboflavin, and niacin) groups, 2 in the prime-aged group (calcium and vitamin C) and one in the middle-aged group (calcium).
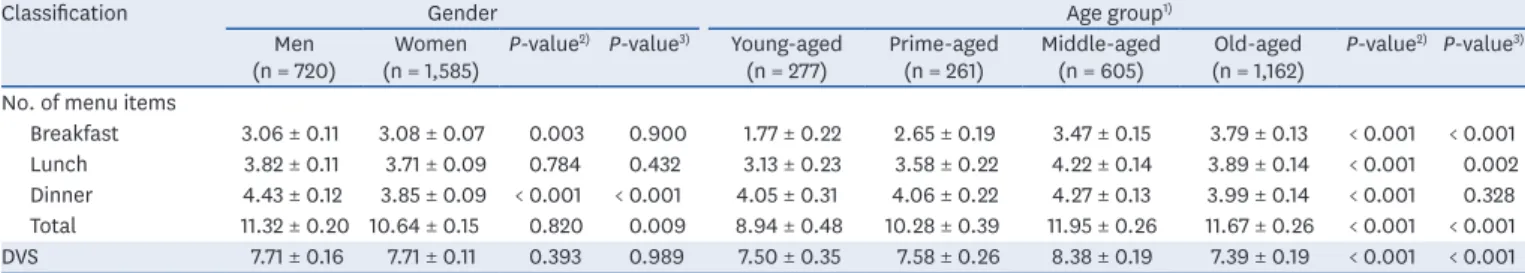
Meal diversity
Table 6 summarizes the number of menu items consumed and the DVS values by gender and age. There were no significant differences in the number of menu items consumed in the model 1 results, but after adjustment for confounding variables (model 2), there were significant differences between men (11.3 items) and women (10.6 items; P = 0.009). At the dinner meal, men consumed a more diverse menu than women both before and after adjustment for confounding variables (all P < 0.001). However, the average DVS had no significant difference by gender.
Table 5. Index of nutritional quality of the subjects
Classification Gender Age group
1)Men
(n = 720) Women
(n = 1,585) P-value
2)P-value
3)Young-aged
(n = 277) Prime-aged
(n = 261) Middle-aged
(n = 605) Old-aged
(n = 1,162) P-value
2)P-value
3)Protein 1.25 ± 0.02 1.21 ± 0.01 < 0.001 0.058 1.33 ± 0.03 1.28 ± 0.03 1.20 ± 0.02 1.16 ± 0.02 < 0.001 0.001 Calcium 0.67 ± 0.02 0.62 ± 0.01 < 0.001 0.016 0.61 ± 0.04 0.70 ± 0.03 0.69 ± 0.03 0.59 ± 0.02 < 0.001 < 0.001 Phosphorus 1.62 ± 0.02 1.40 ± 0.01 < 0.001 < 0.001 1.58 ± 0.04 1.56 ± 0.04 1.56 ± 0.02 1.34 ± 0.02 < 0.001 < 0.001 Iron 2.08 ± 0.15 1.68 ± 0.03 0.029 0.005 1.51 ± 0.09 1.39 ± 0.07 2.22 ± 0.20 1.96 ± 0.05 < 0.001 < 0.001 Vitamin A 0.96 ± 0.05 1.21 ± 0.07 0.004 0.008 0.89 ± 0.12 1.11 ± 0.11 1.27 ± 0.09 1.13 ± 0.08 0.118 0.093 Thiamine 1.80 ± 0.03 1.66 ± 0.02 < 0.001 < 0.001 1.85 ± 0.08 1.83 ± 0.05 1.75 ± 0.04 1.56 ± 0.03 < 0.001 < 0.001 Riboflavin 0.93 ± 0.02 1.04 ± 0.02 0.425 < 0.001 1.05 ± 0.04 1.09 ± 0.04 1.06 ± 0.03 0.86 ± 0.03 < 0.001 < 0.001 Niacin 1.03 ± 0.02 1.02 ± 0.01 0.001 0.583 1.19 ± 0.05 1.10 ± 0.03 1.04 ± 0.02 0.88 ± 0.02 < 0.001 < 0.001 Vitamin C 0.90 ± 0.05 1.12 ± 0.04 0.001 0.001 0.82 ± 0.11 0.93 ± 0.08 1.24 ± 0.07 1.06 ± 0.07 0.001 0.005 Values are presented as mean ± SE. Values are in model 2 (adjusted for confounding variables). The data were analyzed by the Complex Samples module of SPSS software.
1)
Young-aged = 20–34 years old, prime-aged = 35–49 years old, middle-aged = 50–64 years old, old-aged = 65 years old and more;
2)P-value by χ
2test or analysis
of variance in model 1 (crude);
3)P-value by χ
2test or analysis of variance in model 2 (adjusted for confounding variables).
Significant differences in the number of menu items consumed among the age groups were observed for breakfast (P < 0.001) and lunch (P = 0.002) and all meals combined (P < 0.001) but there was no significant difference among age groups in the number of menu items for the dinner meal. The young-aged group consumed relatively fewer menu items than those consumed in the other groups. The DVS was significantly different among the groups and was relatively high in the middle-aged group (P < 0.001).
The GMVFD pattern and DDS results are shown in Table 7. The food group intake patterns showed significant differences by gender (P < 0.001) and age group (P < 0.001). For men, the GMV pattern was the most common (36.0%), followed by the GMVF pattern (25.2%). In women, the GMVF pattern was the most common (30.0%), followed by the GMVFD pattern (23.4%). The DDS was significantly higher in women (3.9) than in men (3.6) (P < 0.001). The ideal food intake pattern (GMVFD) occurred the most in the prime-aged group (23.8%) and was lowest in the old-aged group (16.4%). There was no significant difference in DDS by age group.
DISCUSSION
This study evaluated nutrient intake and dietary quality of people who eat alone and investigated the differences in those factors by gender and age. It has been shown that older adults and one-person households tend to eat alone [5,6], and the rate of eating alone in women is about twice that of men [5]. The same demographic characteristics of solo Table 6. The number of menus for meals and DVS of the subjects
Classification Gender Age group
1)Men
(n = 720) Women
(n = 1,585) P-value
2)P-value
3)Young-aged
(n = 277) Prime-aged
(n = 261) Middle-aged
(n = 605) Old-aged
(n = 1,162) P-value
2)P-value
3)No. of menu items
Breakfast 3.06 ± 0.11 3.08 ± 0.07 0.003 0.900 1.77 ± 0.22 2.65 ± 0.19 3.47 ± 0.15 3.79 ± 0.13 < 0.001 < 0.001 Lunch 3.82 ± 0.11 3.71 ± 0.09 0.784 0.432 3.13 ± 0.23 3.58 ± 0.22 4.22 ± 0.14 3.89 ± 0.14 < 0.001 0.002 Dinner 4.43 ± 0.12 3.85 ± 0.09 < 0.001 < 0.001 4.05 ± 0.31 4.06 ± 0.22 4.27 ± 0.13 3.99 ± 0.14 < 0.001 0.328 Total 11.32 ± 0.20 10.64 ± 0.15 0.820 0.009 8.94 ± 0.48 10.28 ± 0.39 11.95 ± 0.26 11.67 ± 0.26 < 0.001 < 0.001 DVS 7.71 ± 0.16 7.71 ± 0.11 0.393 0.989 7.50 ± 0.35 7.58 ± 0.26 8.38 ± 0.19 7.39 ± 0.19 < 0.001 < 0.001 Values are presented as mean ± SE. Values are in model 2 (adjusted for confounding variables). The data were analyzed by the Complex Samples module of SPSS software.
DVS, dietary variety score.
1)
Young-aged = 20–34 years old, prime-aged = 35–49 years old, middle-aged = 50–64 years old, old-aged = 65 years old and more;
2)P-value by χ
2test or analysis of variance in model 1 (crude);
3)P-value by χ
2test or analysis of variance in model 2 (adjusted for confounding variables).
Table 7. Food group intake pattern and DDS of the subjects
GMVFD Gender Age group
1)Men
(n = 720) Women
(n = 1,585) P-value
2)Young-aged
(n = 277) Prime-aged
(n = 261) Middle-aged
(n = 605) Old-aged
(n = 1,162) P-value
2)GMVFD pattern
3)< 0.001 < 0.001
11110 186 (25.2) 494 (30.0) 62 (21.9) 72 (25.4) 211 (34.2) 335 (28.4)
11100 272 (36.0) 339 (20.6) 65 (25.9) 68 (26.3) 150 (26.1) 328 (28.2)
11111 95 (13.6) 346 (23.4) 67 (21.0) 56 (23.8) 126 (19.8) 192 (16.4)
11101 80 (13.2) 152 (11.5) 51 (18.7) 38 (15.2) 52 (9.6) 90 (8.6)
10100 34 (3.6) 68 (3.3) 3 (0.6) 8 (3.5) 18 (2.8) 73 (5.6)
10110 18 (2.3) 73 (3.9) 6 (2.1) 6 (1.7) 16 (2.2) 63 (5.4)
Others 35 (6.1) 113 (7.4) 23 (9.7) 12 (4.1) 32 (5.3) 81 (7.4)
DDS
4)3.56 ± 0.04 3.87 ± 0.03 < 0.001 3.66 ± 0.08 3.66 ± 0.06 3.83 ± 0.04 3.77 ± 0.04 0.124
Values are presented as number (%) or mean ± SE. The data were analyzed by the Complex Samples module of SPSS software.
GMVFD, grain, meat, vegetable, fruit, and dairy product; DDS, dietary diversity score.
1)
Young-aged = 20–34 years old, prime-aged = 35–49 years old, middle-aged = 50–64 years old, old-aged = 65 years old and more;
2)P-value by χ
2test;
3)Unweighted
frequencies and weighted percentages are presented;
4)Values are in model 2 (adjusted for confounding variables).
eaters were observed in our study. The energy intake of people eating alone was insufficient regardless of gender and age group, indicating that solo eaters do not consume as much as they need. Several other studies have also revealed that people eat less when they eat alone [13-15]. A quantitatively deficient intake of energy could result in deficient intakes of nutrients, and our results showed low NARs for all nutrients in all of our subject groups.
In particular, an excessively low intake of calcium and low calcium density of meals were common among people eating alone.
Besides the common dietary problems of solo eaters, peculiar differences by gender and age group were detected. Men consumed significantly higher amounts of energy and nutrients;
consequently, their NARs were higher than women, except for vitamin C. However, the INQ of as many as 4 (calcium, vitamin A, vitamin C, and riboflavin) nutrients were below 1.0 in men, but only calcium was below 1.0 in women. This result suggested that men's diet was qualitatively poorer than that of women, which was also identified in their dietary patterns.
Although men ate more menu items than women, their dietary diversity was quite the opposite. The food group intake pattern was relatively less ideal for men, and about 40%
of men consumed neither fruit nor dairy products, resulting in a lower nutrient density of their meals. A previous study reported an association between eating alone and the risk of metabolic syndrome in middle-aged Korean men; however, no association was detected in women [19]. The nutrient density of women's meals was higher even when they ate alone [19]. Therefore, the qualitatively poor diet of men eating alone could be a risk factor for developing metabolic diseases.
Among the different age groups assessed, the middle-aged group showed relatively better nutrient intake and dietary quality compared to the other age groups. The middle-aged group intakes of calcium, iron, vitamin A, and vitamin C were the highest among the age groups, and their NARs were also higher than those of the other groups, resulting in the highest MAR and generally higher INQs. The relatively better diet quality of the middle-aged group was verified by the group having the highest DVS. This result could be explained by results in a previous study showing that adults in their fifties consumed relatively better prepared meals when eating alone compared to adults in their twenties or thirties, who usually consumed instant or fast food [23].
Young- and old-aged people eating alone need to be assigned a high priority for nutrition education and policy. Deficient intakes of calcium, vitamin A, and vitamin C and the low densities of those nutrients were the most critical dietary issues in the young-aged group.
The young-aged group consumed a very simple diet with limited menu items, including fewer food ingredients. In particular, their INQs of vitamin A (0.89) and C (0.82) were the lowest among the groups, suggesting that they need to consume more vegetables and fruits. In a study about dietary behavior of Korean adults who eat alone in single households, young adults in their twenties and thirties consumed simpler meals, such as those comprised of single dishes or fast foods, compared to those consumed by people in their forties and fifties.
Ramen was the most frequently consumed food when young adults eat alone [23]. In the old-aged group, intake levels of calcium, riboflavin, and niacin, as well, the nutrient densities of their meals were particularly low. The old-aged group ate relatively more menu items, but their DVS and DDS were low, and the percentage energy contribution of carbohydrates was high (70.2%), indicating their meals were not diverse and included ingredient repetition.
Aging can be a risk factor for poor dietary quality, due to energy intake reduction and
appetite loss with older adults who eat alone having a high risk of malnutrition [29];
therefore, education to improve dietary habits and intake of a quantitatively sufficient diet with more diverse ingredients, as well as support the provision of nutrient-balanced meals for elders who eat alone, is necessary.
The relatively lower quality of diet in men and the young-aged group could be explained by their frequent meal skipping and eating out as well as by their consumption of simple meals, as was identified in our study. The frequent meal skipping and eating out of men [30] and young adults [31,32] was also reported in previous studies. Meal skipping [33] and frequent eating out [34] were associated with low intake of micronutrients, such as calcium, iron, and vitamin C, and frequent eating out can result in an elevated sodium intake [35]. The sodium intake of men (3,877 mg) was much higher than that of women (2,816 mg) in our study, and the young-aged group consumed the largest amount of sodium among the tested age groups.
Interestingly, the high intake of sodium of young-aged group may be characteristic of solo eaters, because sodium intake of Korean adults is reported to be higher in adults aged 40–49 years, followed by older adults [30].
As dietary habits formed in the early adult period have influences on heath and nutritional status in old age, nutrition education for the young-aged group on the importance of regular and nutritionally balanced meals is essential. However, considering that the main reason for eating alone in young adults was reported to be a lack of time [18,36], and young adults eating alone pursue convenience and cost-effectiveness and prefer to eat simple meals [37], a practical approach, such as educating young adults about dietary choice strategies for consuming more healthful convenience store food items, would be more effective.
Convenience stores were one of the major eating places, and convenience store lunch boxes are frequently consumed when young adults eat alone [23]. However, it was reported that the nutritional quality of lunch boxes sold in Korean convenience stores were poor as a single meal [38]. Therefore, voluntary efforts by the food industry to develop healthy convenience meals, including small packages of fruits or vegetables customized for solo eaters, are essential, and related government policies are also necessary. In addition, such strategies could be effective if applied to men who eat alone and are not usually familiar with cooking, thus tending to eat simple meals. On the other hand, a policy-based approach may be more effective for older adults eating alone. Policies that encourage them to consume meals provided by senior welfare centers or expansion of meals-on-wheels programs could improve the nutritional intake of older adults who eat alone. In parallel, community-based nutrition education should be provided to encourage elderly solo eaters to maintain healthy meal consumption patterns.
In conclusion, deficiencies in the intake of energy and nutrients were common dietary issues
for the subjects eating alone in this study. There were excessively low intakes of calcium, and
intakes of energy and nutrients by men were higher than those for women, but men's dietary
quality was poorer, showing a lack of food diversity as well as frequent meal skipping and
eating out. The young-aged group showed similar dietary problems with vitamins A and C
being the most deficient nutrients in their diet. The overall lower intake of food, the higher
energy contribution from carbohydrates, and the low nutrient density of meals were the main
dietary problems in old-aged subjects who ate alone. Their intakes of calcium, riboflavin, and
niacin were notably low. The results of our study suggest that health-promotion campaigns
and policies aimed at promoting healthy eating behaviors by solo eaters need to take into
account gender and age differences when designing dietary strategies. In addition, young-
aged adults and old-aged men need to be assigned a high priority within any nutritional
policies developed for people who eat alone.
There are some limitations in our study. First, caution should be taken when interpreting and generalizing the results as typical energy and nutrient intakes of solo eaters, as the results were obtained by analyzing 24-hour recall data. Additionally, the meal partner variable in the 24-hour recall survey was included in the 2016 KNHANES; thus, we could not divide meals consumed alone from meals consumed with others. Second, it was impossible to determine the specific conditions associated with the subjects' usual consumption as a solo eater, such as duration and place of meals, snacking habits, etc. Despite the limitations, the results of this study could be used as a basis for strategies to improve the dietary life of people who eat alone. As the number of solo eaters will keep increasing in step with other social changes, further in-depth studies about gender and age distinct dietary behaviors should be undertaken. Studies into relevant differences in various sociodemographic characteristics, such as residence area, income level, household type, or job status, are also needed.
REFERENCES
1. Kerner S, Chou C, Warmind M. Commensality: from everyday food to feast. London: Bloomsbury Publishing; 2015.
2. Kim HW. Single-person households and broadcasting trends change. Media Educ 2015;5:152-71.
3. Statistics Korea. 2018 senior citizen statistics [Internet]. Daejeon: Statistics Korea; 2018 [cited 2019 September 10]. Available from: http://kostat.go.kr/portal/korea/kor_nw/1/6/1/index.board?bmode=read&aSeq=370779.
4. Statistics Korea. Current status and characteristics of one-person households [Internet]. Daejeon:
Statistics Korea; 2018 [cited 2019 September 10]. Available from: http://kostat.go.kr/portal/korea/kor_
nw/1/10/1/index.board?bmode=read&aSeq=370806.
5. Kang Y, Kang S, Kim KJ, Ko H, Shin J, Song YM. The association between family mealtime and depression in elderly Koreans. Korean J Fam Med 2018;39:340-6.
PUBMED | CROSSREF
6. Lee KI, Hwang YJ, Ban HJ, Lim SJ, Jin HJ, Lee HS. Impact of the growth of single-person households on the food market and policy tasks. Report No. R762. Naju: Korea Rural Economic Institute; 2015.
7. Song EG, Yoon YS, Yang YJ, Lee ES, Lee JH, Lee JY, Park WJ, Park SY. Factors associated with eating alone in Korean adults, findings from the Sixth Korea National Health and Nutrition Examination Survey 2014.
Korean J Fam Pract 2017;7:698-706.
CROSSREF
8. Kimura Y, Wada T, Okumiya K, Ishimoto Y, Fukutomi E, Kasahara Y, Chen W, Sakamoto R, Fujisawa M, Otsuka K, Matsubayashi K. Eating alone among community-dwelling Japanese elderly: association with depression and food diversity. J Nutr Health Aging 2012;16:728-31.
PUBMED | CROSSREF
9. Tani Y, Sasaki Y, Haseda M, Kondo K, Kondo N. Eating alone and depression in older men and women by cohabitation status: the JAGES longitudinal survey. Age Ageing 2015;44:1019-26.
PUBMED | CROSSREF
10. Wang X, Shen W, Wang C, Zhang X, Xiao Y, He F, Zhai Y, Li F, Shang X, Lin J. Association between eating alone and depressive symptom in elders: a cross-sectional study. BMC Geriatr 2016;16:19.
PUBMED | CROSSREF
11. Kwon AR, Yoon YS, Min KP, Lee YK, Jeon JH. Eating alone and metabolic syndrome, a population-based Korean National Health and Nutrition Examination Survey 2013–2014. Obes Res Clin Pract 2018;12:146-57.
PUBMED | CROSSREF
12. Song SY, Jeong YH. Association between eating alone and metabolic syndrome: a structural equation modeling approach. J Korean Diet Assoc 2019;25:142-55.
CROSSREF
13. de Castro JM, de Castro ES. Spontaneous meal patterns of humans: influence of the presence of other people. Am J Clin Nutr 1989;50:237-47.
PUBMED | CROSSREF
14. Locher JL, Robinson CO, Roth DL, Ritchie CS, Burgio KL. The effect of the presence of others on caloric intake in homebound older adults. J Gerontol A Biol Sci Med Sci 2005;60:1475-8.
PUBMED | CROSSREF
15. Hetherington MM, Anderson AS, Norton GN, Newson L. Situational effects on meal intake: a comparison of eating alone and eating with others. Physiol Behav 2006;88:498-505.
PUBMED | CROSSREF
16. Park YA. Dietary behavior and nutrient intake of high school students in Seoul: focused on students who eat alone [dissertation]. Seoul: Hanyang University; 2011.
17. Bae YJ. Evaluation of nutritional status in Korean adolescents according to eating breakfast together as a family: based on the 2013~2015 Korea National Health and Nutrition Examination Survey. Korean J Food Nutr 2017;30:1210-21.
CROSSREF
18. Lee YM, Cho WK, Oh YJ. Comparison of eating behavior between commensality and solo-eating of university students by BMI. Korean J Community Nutr 2012;17:280-9.
CROSSREF
19. Kim HK, Chung J. Associations of the eating alone behavior with nutrient intake, obesity and metabolic syndrome in middle-aged adults based on the 2013 ~ 2017 Korean National Health and Nutrition Examination Survey. J Nutr Health 2019;52:435-48.
CROSSREF
20. Lee EJ, Lee KR. Comparison of solo eating perception and dietary behaviors according to gender in the Seoul and Gyonggi-do regions. J Korean Soc Food Cult 2018;33:531-42.
CROSSREF
21. Lee Y, Oh YJ, Cho W, Jo PK. Differences in solo eating perceptions and dietary behaviors of university students by gender. J Korean Diet Assoc 2015;21:57-71.
CROSSREF
22. Tani Y, Kondo N, Takagi D, Saito M, Hikichi H, Ojima T, Kondo K. Combined effects of eating alone and living alone on unhealthy dietary behaviors, obesity and underweight in older Japanese adults: results of the JAGES. Appetite 2015;95:1-8.
PUBMED | CROSSREF
23. Jo PK, Oh YJ. Comparison of dietary behavior of eating alone in single households by status of workers and age. Korean J Community Nutr 2019;24:408-21.
CROSSREF
24. Park SH, Lee KS, Park HY. Dietary carbohydrate intake is associated with cardiovascular disease risk in Korean: analysis of the third Korea National Health and Nutrition Examination Survey (KNHANES III).
Int J Cardiol 2010;139:234-40.
PUBMED | CROSSREF
25. Ministry of Health and Welfare (KR); The Korean Nutrition Society. Dietary reference intakes for Koreans 2015. Seoul: The Korean Nutrition Society; 2015.
26. Guthrie HA, Scheer JC. Validity of a dietary score for assessing nutrient adequacy. J Am Diet Assoc 1981;78:240-5.
PUBMED
27. Madden JP, Goodman SJ, Guthrie HA. Validity of the 24-hr. recall. Analysis of data obtained from elderly subjects. J Am Diet Assoc 1976;68:143-7.
PUBMED
28. Kant AK, Block G, Schatzkin A, Ziegler RG, Nestle M. Dietary diversity in the US population, NHANES II, 1976-1980. J Am Diet Assoc 1991;91:1526-31.
PUBMED
29. Yang SJ. Nutritional risk and its contributing factors in the low-income elderly in urban areas. J Korean Acad Community Health Nurs 2005;16:392-403.
30. Ministry of Health and Welfare (KR); The Korean Nutrition Society. Korea health statistics 2017: Korea National Health and Nutrition Examination Survey (KNHANES VII-2). Sejong: Ministry of Health and Welfare; 2019.
31. Lee JW. Effects of frequent eating-out and breakfast skipping on body mass index and nutrients intake of working male adults: analysis of 2001 Korea National Health and Nutrition Survey data. Korean J Community Nutr 2009;14:789-97.
32. Lee KA, Jeong BY, Moon SK, Kim IS, Soichiro N. Comparisons of Korean adults' eating habits, food preferences, and nutrient intake by generation. Korean J Nutr 2006;9:494-504.
33. Min C, Noh H, Kang YS, Sim HJ, Baik HW, Song WO, Yoon J, Park YH, Joung H. Skipping breakfast is associated with diet quality and metabolic syndrome risk factors of adults. Nutr Res Pract 2011;5:455-63.
PUBMED | CROSSREF
34. Lachat C, Nago E, Verstraeten R, Roberfroid D, Van Camp J, Kolsteren P. Eating out of home and its association with dietary intake: a systematic review of the evidence. Obes Rev 2012;13:329-46.
PUBMED | CROSSREF
35. An HK. A study on the recognition and practice for reducing sodium intake of one-person households [dissertation]. Seoul: Chung-Ang University; 2015.
36. Choi BB. Recognition and consumption of meal alone and processed food according to major of college students. Korean J Food Nutr 2016;29:911-22.
CROSSREF
37. Yates L, Warde A. Eating together and eating alone: meal arrangements in British households. Br J Sociol 2017;68:97-118.
PUBMED | CROSSREF
38. Choi J, Park H, Song K, Kwon S, Lee Y. Menu evaluation of meal boxes sold in Korean convenience stores.
J Food Nutr Res 2018;6:18-25.
CROSSREF