Effects of poly-γ-glutamic acid on serum and brain concentrations of glutamate and GABA in diet-induced obese rats
Hyesung Lee, Moon-Jeong Chang and Sun-Hee Kim§
Department of Foods and Nutrition, Kookmin University, 861-1 Jeongneung-dong, Seongbuk-gu, Seoul 136-702, Korea
Abstract
Poly-gamma-glutamic acid (γ-PGA) is a mucilaginous and biodegradable compound produced by Bacillus subtilis from fermented soybeans, and is found in the traditional Korean soy product, cheongkukjang. This study was carried out to evaluate the effects of γ-PGA from a food source on the concentration of the neurotransmitter GABA and its metabolic precursor glutamate in diet-induced obese rats. Eight-week old male Sprague-Dawley rats (n=60) were used. The rats were divided into two groups and obesity was induced by providing either a 10% control fat or 45% high fat diet for 5 weeks. The rats were then blocked into 6 groups and supplemented with a 0.1% γ-PGA diet for 4 weeks. After sacrifice, brain and serum GABA and glutamate concentrations were analyzed by high performance liquid chromatography with fluorometric detection. The rats fed the high fat diet had significantly increased body weights. γ-PGA supplementation significantly increased serum concentrations of glutamate and GABA in the control fat diet groups while this effect was not found in the high fat groups. In the brain, glutamate concentrations were significantly higher in the γ-PGA supplemented groups both in rats fed the normal and high fat diets than in the no γ-PGA controls. GABA concentrations showed the same tendency. The results indicated that γ-PGA intake increased GABA concentrations in the serum and brain. However, the effects were not shown in obese rats.
Key Words: Poly-gamma-glutamic acid (γ-PGA), glutamate, γ-aminobutyric acid (GABA)
Introduction4)
Glutamate is the principal excitatory neurotransmitter in the vertebrate nervous system [1] and gamma-aminobutyric acid (GABA) is the most abundant inhibitory neurotransmitter, meaning that when it finds its way to its receptor sites, it blocks the tendency of that neuron to fire [2,3]. Glutamate is irreversibly converted to GABA via the GABA shunt from GABAergic neurons by glutamate decarboxylase, which uses proximal 5’-phosphate as a cofactor [4,5].
GABA plays an important role in regulating neuronal excitability throughout the nervous system. As a neurotransmitter, GABA helps induce relaxation and sleep. It balances the brain by inhibiting over-excitation. It is involved in neurological and psychiatric disorders such as depression, fear, and anxiety [6].
GABA also stimulates the anterior pituitary, leading to higher levels of human growth hormone. Growth hormone contributes significantly to muscle growth and also prevents the creation of fat cells [7]. There have been several clinical studies on GABA neurotransmitters for elevating growth hormone levels, which has a positive effect on sleep cycles and fat burning capabilities [8].
In addition, GABA is responsible for regulating many physiological functions such as suppressing high blood pressure,
decreasing blood triglycerides and cholesterol, and preventing obesity, which are highly related to the cardiovascular disease [9-12]. Several studies showed that GABA functions in reducing an alarming increase in systolic blood pressure in spontaneously hypertensive rats [13]. Therefore, changes in levels of GABA and glutamate in the brain and serum are probably correlated with several neurological diseases as well as cardiovascular disease [3].
Gamma-PGA is an unusual anionic polypeptide in which D-and/or L- glutamic acid units are polymerized via γ-amide linkages between α-amino and γ–carboxylic groups [14]. γ-PGA is a compound of mucilage produced by Bacillus subtilis in fermented soybeans and is found in the traditional Korean soy product, cheongkukjang. Because γ-PGA is not a chemically synthesized product but exists naturally in foods, it is generally regarded as safe. Several studies have shown that γ-PGA is helpful in increasing intestinal Ca absorption as well as intensifying the strength and content of the femur [15], enhances immune-stimulating activity, and potentially improves antitumor activity [16].
During the past 20 years there has been a dramatic increase in obesity in developed countries. The national data of the Korean National Health and Nutrition Examination Survey revealed that
This work was supported by 2009 Seoul B & RD program.
§Corresponding Author: Sun-Hee Kim, Tel. 82-2-910-4773, Fax. 82-2-910-5249, Email. [email protected] Received: December 18, 2009, Revised: February 2, 2010, Accepted: February 5, 2010
ⓒ2010 The Korean Nutrition Society and the Korean Society of Community Nutrition
This is an Open Access article distributed under the terms of the Creative Commons Attribution Non-Commercial License (http://creativecommons.org/licenses/by-nc/3.0/) which permits unrestricted non-commercial use, distribution, and reproduction in any medium, provided the original work is properly cited.
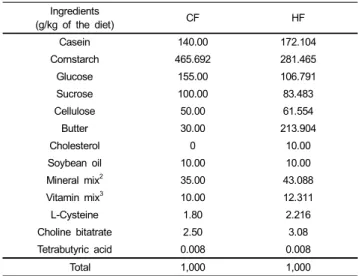
Table 1. Composition of experimental diets1 Ingredients
(g/kg of the diet) CF HF
Casein 140.00 172.104
Cornstarch 465.692 281.465
Glucose 155.00 106.791
Sucrose 100.00 83.483
Cellulose 50.00 61.554
Butter 30.00 213.904
Cholesterol 0 10.00
Soybean oil 10.00 10.00
Mineral mix2 35.00 43.088
Vitamin mix3 10.00 12.311
L-Cysteine 1.80 2.216
Choline bitatrate 2.50 3.08
Tetrabutyric acid 0.008 0.008
Total 1,000 1,000
1CF: 10% control fat diet, HF: 45% high fat diet
2Mineral mixture: AIN-93M [34]
3Vitamin mixture: AIN-93-Vx [34]
the rate of obese adults with a body mass index (BMI; kg/m2) of 25 or higher increased from 26% in 1998 to 31.7% in 2007.
Epidemiological studies indicate that obesity, insulin resistance, and diabetes lead to the development of cardiovascular disease and increase mortality. Obesity is associated with dyslipidemia, which leads to elevated triglycerides and compromised cardiac function [17]. Thakker et al. [18] reported that diet-induced obese mice developed hyperinsulinemia and insulin resistance. The brain has evolved mechanisms for sensing and regulating glucose levels in the plasma [19]. Diet influences sympathetic nervous system activity and dietary-induced changes in sympathetic activity contribute to changes in metabolic rate. Insulin-mediated glucose metabolism in the hypothalamus provides a link between dietary intake and sympathetic nervous system activity. Hyperin- sulinemia, a consequence of insulin resistance in obese indivi- duals, is associated with hypertension [20]. In addition, leptin may contribute to obesity-induced cardiovascular complications that are possibly associated with impaired leptin receptor signaling [11]. One of neurocognitive changes in obese people is insufficient sleep. Park et al. [21] reported a negative association between sleep duration and body mass index among Korean adults and Verona et al. [22] suggested a cause-and-effect relation- ship between insufficient sleep and obesity in the US population.
Therefore, this study was carried out to investigate the effects of γ-PGA on GABA and glutamate concentrations in the brain and serum and on obesity. A diet-induced obese rat model was produced by providing a diet incorporating 45% of kcal from fat.
Materials and Methods
Animals
The animals used in this study were 8-week old male Sprague-Dawley rats (n=60) weighing 250~330 g, and were acquired from Orient Bio Inc, Gyeonggi-do, Korea. Each rat was housed in an individual wire cage in a controlled environment at 22 ± 1℃, 65 ± 5% relative humidity, and a 12-hour light-dark cycle (lights on at 8 a.m.). The cages were cleaned every second day. After a week of acclimation, the animals were randomly divided into two groups and fed either a high fat diet to induce obesity or a normal fat diet as a control for 5 weeks. The animals were then divided into six groups of ten rats each using a randomized complete block design and provided with diets containing 0.1% γ-PGA for 4 weeks. The animals were allowed free access to the diets and to deionized water ad libitum. All aspects of this study were conducted according to the standards of the Animal Ethics Committee of the Institution.
Experimental diets
During the induction period of obesity, the animals were provided either a 10% control fat diet or a 45% high fat diet
(shown in Table 1). After 5 weeks of feeding, the rats were divided into the following six groups of ten rats each to investigate the effects of γ-PGA supplementation over 4 weeks:
control fat (control 10% fat with 0% γ-PGA; CC), control fat γ-PGA (10% control fat with 0.1% γ-PGA; CP), high fat control (45% fat with 0% γ-PGA; HC), high fat PGA (45% fat with 0.1% γ-PGA; HP), switched from high fat to control fat (45%
to 10% fat with 0% γ-PGA; HCC), and switched from high fat to control fat γ-PGA (45% to 10% fat with 0.1% γ-PGA; HCP).
The HCC and HCP groups were intended to know the effects of short-term feeding of high fat. The γ-PGA was kindly provided by Bioleaders, Daejeon, Korea, and its molecular weight was approximately 2,700 KDa in acid form. Food consumption was recorded every second day.
Animal sacrifice and tissue collection
The unanesthetized animals were sacrificed in random order by decapitation after 18-hours of fasting. The brain was rapidly removed from the cranium and dissected into the left and right brains on an ice-cold plate. The tissues were stored at -50℃
until analysis and were analyzed within 7 days of sacrifice. Blood samples were collected and centrifuged for 10 min at 3,000 rpm and 4℃, and then the supernatants were retained and stored at -50℃.
Glutamate and GABA analysis Brain assay
For the brain analysis, HPLC grade methanol and water were obtained from J.T Baker (Phillipsburg, NJ, USA). Citric acid, octane sulfonic acid, EDTA, sodium phosphate dibasic, sodium phosphate monobasic, potassium cyanide, GABA, L-glutamic
acid, and 2,3-naphthalene dicarboxaldehyde (NDA) were obtained from Sigma-Aldrich (St. Louis, MO, USA).
The brain GABA and glutamate concentrations were assayed by the method of Clarke et al. [23] with slight modifications.
On the day of the assay, the left brain was weighed and placed in a centrifuge tube, followed by the addition of 5 ml of chilled homogenization buffer [0.1 M citric acid, 0.1 M sodium phosphate monobasic, 5.6 mM octane sulfonic acid and 10 μM EDTA in 10% (v/v) methanol solution, pH 2.8 with 4 M NaOH].
After homogenization, each sample was centrifuged at 14,000 rpm for 15 min at 4℃ and the supernatant was stored at -50℃
until derivatisation for GABA and glutamate analysis. One mg/ml stock standards of GABA and L-glutamate were prepared in HPLC grade water and 1 M phosphoric acid, and working dilutions were prepared in the tissue homogenization buffer.
Then, 100 μl of either the standard mix or sample supernatant, 900 μl of borate buffer (0.1 M, pH 9.5), 200 μl of potassium cyanide (10 mM), and 200 μl of NDA (6 mM) were added to a microtube and vortex mixed. The reaction was then allowed to proceed at room temperature in the absence of light. Next, the sample was filtered through a LC 13 mm syringe filter with a 0.45 ㎛ PVDF membrane, and 10 μl of the derivative was injected onto the HPLC system. For the assay, borate buffer (0.1 M, pH 9.5 with or adjusted by 4 M NaOH) was stored at room temperature for 1 week. Potassium cyanide (10 mM) in HPLC grade water was stored at 4℃ for 1 month. 2,3-Naphthalene dicarboxaldehyde (6 mM) in HPLC grade methanol was stored at 4℃ in an amber bottle for a week. For the HPLC assay, the mobile phase was composed of a mixture of 0.1 M sodium phosphate dibasic containing 50 μM EDTA (pH 5.3 with 1 M phosphoric acid) and HPLC grade methanol (35:65 v/v). The mobile phase was filtered and degassed prior to use. The compounds were eluted for a 15 min run-time at a flow rate of 0.5 ml/min. The fluorescence detector was set at an excitation wavelength of 420 nm, an emission wavelength of 489 nm, and a PMT gain of 1.
The HPLC-FLD analysis system consisted of 515 dual pumps, a 717 autosampler, and a 2475 fluorescence detector (Waters, Milford, MA USA). All samples were injected and separated onto a symmetry (4.6 mm i.d. x 150 mm, 5.0 ㎛) reversed phase C18
column.
Serum assay
For the serum analysis, o –phtalaldehyde (OPA) was obtained from ICN Biomedicals, Inc. (Germany). For the serum GABA and glutamate analysis, the method was based on that of Vermeij and Edelbroek [24] with slight modifications. Briefly, 80 μl of serum was placed in 1.5 ml microcentrifuge tubes and 40 μl of 20% trichloroacetic acid was added to remove the protein.
The mixture was mixed for 15s and then centrifuged for 10 min at 5,800 rpm. The supernatant was used for analysis.
Borate buffer (0.1 M, pH 10 with NaOH) was stored at room temperature for 1 week. A stock solution of OPA was prepared
by dissolving 100 mg OPA into 3 ml of methanol in an amber bottle, and stored at 4℃. A working solution of OPA was prepared by adding 300 μl of stock solution and 20 μl of MPA to 4 ml of 0.1 M borate buffer (pH 10).
Fifty microliters of either the standard mix or sample supernatant, 500 μl of borate buffer (0.1 M, pH 10), and 50 μl of OPA working reagent were added to a microtube, vortex mixed, and then left for 1 min to react. The reaction was allowed to proceed at room temperature in the absence of light. Next, the sample was filtered through a LC 13 mm syringe filter with a 0.45 ㎛ PVDF membrane and 10 μl of the sample was injected onto the HPLC system. For the serum assay, the mobile phase consisted of a mixture of 20 mM potassium phosphate buffer (pH 7.0), HPLC grade acetonitrile, and HPLC grade methanol (74.5 : 17.5 : 8, v/v). The mobile phase was filtered and degassed prior to use. The final pH of the mobile phase was 7.55. The compounds were eluted for a 15 min run-time at a flow rate of 0.6 ml/min. The fluorescence detector was set at an excitation wavelength of 330 nm, an emission wavelength of 450 nm, and a PMT gain of 1.
GABA and glutamate were identified by their retention times as determined by standard injections. Sample peak heights were measured and compared with the standard curve in order to quantify the GABA and glutamate levels.
Statistical analysis
The data were expressed as means ± SEM in each Fig. or Table.
Analysis of variance was performed on the means to determine whether there were significant differences among the groups.
When analysis of variance indicated statistical significance, Duncan’s multiple range test was used to determine which means were significantly different. Student’s t-test was used to compare the control and γ-PGA supplemented groups. All significance levels were set at P < 0.05.
Results
Feed intakes and weight gains
Feed intakes and body weight gains are presented in Table 2. Feed intakes were not significantly different among the groups.
The amounts of weight gain of the high fat HC and HP groups were significantly higher than those of the normal fat CC and CP groups. In addition, the HCC and HCP groups gained significantly more weight than the CC and CP groups. The supplementation of 0.1% γ-PGA had no effect on weight gain even though the weight gains of the CC and HC groups were slightly more than those of the CP and HP groups. As shown in Fig. 1, the high fat diets, due to their high energy density, stimulated weight accumulation. From the third week, the weights of the high fat groups were significantly more than those
Table 2. Weight gain and feed intake1
Group Weight gain (g) Feed intake (g/wk)
CC 158.1 ± 14.7b 179.7 ± 4.5
CP 157.7 ± 16.2b 175.4 ± 4.1
HC 254.9 ± 15.8a 165.3 ± 4.9
HP 243.6 ± 14.3a 174.1 ± 9.9
HCC 210.8 ± 16.2a 174.6 ± 5.3
HCP 220.9 ± 15.4a 175.8 ± 3.9
1CC: 10% fat control, CP: 10% fat with γ-PGA, HC: High fat control, HP: High fat with γ-PGA, HCC: 45% to 10% fat control, HCP: 45% to 10% fat with γ-PGA. Feed intakes are shown the amounts during γ-PGA supplementation.
All data are expressed as means ± SEM.
Different letters in a column indicate significantly different values assessed by Duncan’s multiple range test (P< 0.05).
Fig. 1. Changes of body weight during the experimental period. CC: 10% fat control, CP: 10% fat with γ-PGA, HC: High fat control, HP: High fat with γ-PGA, HCC: 45% to 10% fat control, HCP: 45% to 10% fat with γ-PGA. All points represent means, n=10 rats per group. Different letters in the same week indicate significantly different values assessed by Duncan’s multiple range test (P< 0.05).
(A)
(B)
Fig. 2. Chromatograms of NDA derivatives of glutamate and GABA. (A) Standard solution, 10 ug of glutamate (retention time: 3.752 min) and GABA (retention time:
8.338 min) injected onto the column. Conditions as described in the text. (B) Example of a brain sample from a CP group rat showing glutamate (8.8 mg/g tissue) and GABA (1.6 mg/g tissue).
(A)
(B)
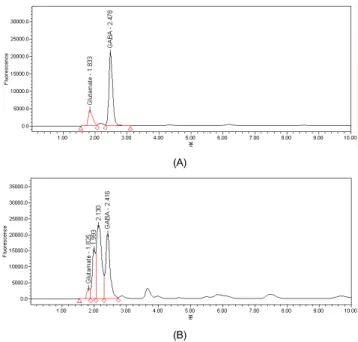
Fig. 3. Chromatograms of OPA derivatives of glutamate and GABA. (A) Standard solution, 10 ug of glutamate (retention time: 1.833 min) and GABA (retention time:
2.478 min) injected onto the column. Conditions as described in the text. (B) Example of a serum sample from a CP group rat showing glutamate (9.8 ug/ml) and GABA (60.4 ug/ml).
of the normal fat groups. When the diet composition was switched from 45% of kcal to 10% of kcal from fat at the 5th week in the HCC and HCP groups, weight gain was slowly increased. However, the weights of the HCC and HCP groups were significantly more than those of the CC and CP groups.
Total food consumption was lower in the high fat diet groups with or without γ-PGA supplementation than in the normal fat CC and CP groups and in a different manner to body weight.
The energy densitites of the experimental diets were different, such as 4.68 kcal/g in the high fat and 3.80 kcal/g in the normal fat diet. This indicates that the high fat diet group had higher energy intake than the control fat diet group, and the high fat diet contributed to a transition to obesity. However, the feed intakes of the groups supplemented with γ-PGA were not significantly different from those of the groups not supplemented with γ-PGA. Our results agree with a study where rats provided diets containing 1% γ-PGA showed no differences in feed intake [15], while Japanese natto mucilage containing γ-PGA significantly decreased feed intake [25].
Development and validation of analytical method
Fig. 2 illustrates the chromatograms of brain samples obtained using the HPLC-FLD system. The concentrations of glutamate and GABA in standard solutions and tissue samples were determined by calculating the peak heights. The detector linearity of responses to the standard solutions of glutamate and GABA were determined. Calibration curves were obtained from a blank
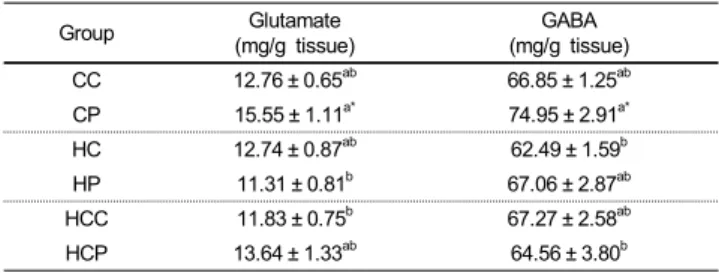
Table 3. Serum Glutamate and GABA concentraions1
Group Glutamate
(mg/g tissue)
GABA (mg/g tissue)
CC 12.76 ± 0.65ab 66.85 ± 1.25ab
CP 15.55 ± 1.11a* 74.95 ± 2.91a*
HC 12.74 ± 0.87ab 62.49 ± 1.59b
HP 11.31 ± 0.81b 67.06 ± 2.87ab
HCC 11.83 ± 0.75b 67.27 ± 2.58ab
HCP 13.64 ± 1.33ab 64.56 ± 3.80b
1CC: 10% fat control, CP: 10% fat with γ-PGA, HC: High fat control, HP: High fat with γ-PGA, HCC: 45% to 10% fat control, HCP: 45% to 10% fat with γ-PGA.
All data are expressed as means ± SEM, n=10 rats per group.
Different letters in a column indicate significantly different values assessed by Duncan’s multiple range test (P< 0.05).
Values with * represent significant differences between the control group and the γ-PGA supplemented group as assessed by student’s t-test (P< 0.05).
Table 4. Brain glutamate and GABA concentrations1
Group Glutamate
(mg/g tissue)
GABA (mg/g tissue)
CC 6.85 ± 0.37c 1.54 ± 0.07ab
CP 8.45 ± 0.36b* 1.62 ± 0.06ab
HC 8.46 ± 0.20b 1.54 ± 0.03ab
HP 9.19 ± 0.26ab* 1.66 ± 0.04a
HCC 8.96 ± 0.22ab 1.48 ± 0.03b
HCP 9.34 ± 0.20a 1.50 ± 0.04b
1CC: 10% fat control, CP: 10% fat with γ-PGA, HC: High fat control, HP: High fat with γ-PGA, HCC: 45% to 10% fat control, HCP: 45% to 10% fat with γ-PGA.
All data are expressed as means ± SEM, n=10 rats per group.
Different letters in a column indicate significantly different values assessed by Duncan’s multiple range test (P< 0.05).
Values with * represent significant differences between the control group and the γ-PGA supplemented group as assessed by student’s t-test (P< 0.05).
and 5 standard solutions of glutamate and GABA, and the correlation coefficients of the curves were not less than 0.98.
The total run time was 15 min using the assay conditions described above. Clarke et al. [23] successfully used NDA derivatisation with slight modifications of mobile phase pH in conjunction with either fluorescent or electrochemical detection systems. They found that a mobile phase pH of 5.6 was most suitable for an electrochemical detection system and a pH of 5.3 was optimum in a fluorescent detection system. The optimum reaction time was shown to be 15 min as per the fluorescent detection system, which is the same as our runtime. The mean elution times for glutamate and GABA were 3.75 min and 8.33 min, respectively, which are below 5.95 min and 11.45 min [23]
because our flow rate was faster.
The chromatogram profiles of the OPA derivatives of the standard solution and a serum sample are presented in Fig. 3.
One of the most commonly used derivatising agents is OPA, which reacts with primary amines in the presence of a thiol and generates fluorescent derivatives. However, we used NDA derivatives to analyze glutamate and GABA in the brain tissue because thiols have a pungent odor and show instability of the derivatives. When we applied the NDA derivatising method with the serum, it was difficult to achieve an optimum pH without acidic homogenizing buffer. Therefore, OPA was chosen as an alternative. HPLC methods using OPA derivatization have been widely used for the determination of primary amino acids in plasma because of their high sensitivity, simplicity, speed, and reliability [24,26]. The derivatives formed by the reaction of OPA with amino acids in the presence of 3-mercaptopropionic acid are fluorescent [27]. The mean elution times for glutamate and GABA were 1.833 and 2.478 min, respectively.
GABA and glutamate concentrations in serum
Table 3 shows the effects of γ-PGA on GABA and glutamate concentrations in serum. The glutamate and GABA concentra- tions of the CP group were significantly higher than those of the CC group. However, the other groups did not show the same tendency. The results suggest that supplementation with 0.1%
γ-PGA significantly elevated glutamate and GABA concentra- tions in the rats fed 10% of kcal from fat in the diet.
GABA and glutamate concentrations in brain tissue
Table 4 represents the effect of γ-PGA on GABA and glutamate concentrations in the brain. Supplementation with 0.1% γ-PGA resulted in a significant elevation of glutamate concentration in the normal fat and high fat groups. Glutamate concentrations were higher in the HCP group than in the HCC group, but a significant difference was not found. These results are similar to those of Wang et al. [28] where oral administration of L-glutamine, a precursor of glutamate and GABA, led to increased concentrations and release of brain glutamate and
GABA. The GABA concentrations exhibited the same elevated trend as the glutamate concentrations, which was not statistically significant.
Discussion
The purpose of this study was to investigate whether supplementation of γ-PGA would increase GABA and glutamate concentrations in the brain and serum of rats. It also intended to determine whether γ-PGA is effective for obese rats. Obesity, a rapidly increasing problem in Korea, was induced by providing a diet comprised of 45% of kcal from fat, which was compared to a 10% fat diet as the control.
There are numerous data showing that GABA functions in suppressing high blood pressure in humans and animals. Several studies have reported that GABA-enhanced food products such as GABA green tea [29], GABA-tempeh [30], and germinated brown rice [31] were effective against hypertension. GABA in foods may be absorbed through the intestinal membrane and increase the GABA level in serum. Therefore, the presence of GABA contributes to a hypotensive effect. This study revealed that γ-PGA intake significantly increased serum glutamate and
GABA concentrations in the CP group (15.55 ㎍/ml, 74.95 ㎍ /ml) compared to the CC group (12.76 ㎍/ml, 66.855 ㎍/ml), whereas γ-PGA intake in the high fat group did not reveal a tendency for elevation in the serum. The significant increase in GABA concentration by γ-PGA intake in this study might prove useful to help reduce risks of hypertension and cardiovascular disease. To confirm the effectiveness of γ-PGA as a functional food component, further experiments for its effects on lowering blood pressure in a hypertension model would be needed.
Diet influences sympathetic nervous system activity and dietary induced changes in sympathetic activity contribute to changes in metabolic rate that accompany changes in dietary intake [20].
Insulin-mediated glucose metabolism in the hypothalamus provides a link between dietary intake and sympathetic nervous system activity. Hyperinsulinemia, a consequence of insulin resistance in obese individuals, is associated with hypertension.
The effects of GABA administered orally might be related to its inhibition of noradrenaline release from sympathetic nerve fibers [32]. In addition, intracerebroventricular injection of GABA (20~200 ㎍) reduced sympathetic nervous activity by depressing hypothalamic function and blood pressure in spontaneously hypertensive rats [33]. One potential attributable mechanism is the fact that GABA hardly passes the blood-brain barrier, and this molecule acts not in the central nervous system but in the peripheral nervous system [13].
Since glutamate is a principal GABA precursor, an increment in glutamate level is expected to increase GABA level. Especially in the brain, GABA is mostly synthesized from brain glutamates because GABA hardly passes the blood-brain barrier [13]. This study showed that γ-PGA supplementation significantly increased brain glutamate levels in the normal and high fat groups, and GABA levels were also increased but not significantly. We can not exclude the possibility that higher doses and/or a longer duration of γ-PGA supplementation would result in significant alterations in brain GABA levels. It has been demonstrated that GABA can produce higher levels of human growth hormone, which stimulates to lose body fat. Also, GABA is known to promote blood circulation and accelerate cell metabolism in the brain. The diet-induced obesity in this study did not make any difference in brain GABA concentrations in spite of significantly elevated brain glutamate levels. Obesity may diminish the sensitivity to turn from the precursor glutamate to GABA in brain.
Relling et al. [17] reported that obesity resulted in impaired cardiomyocyte function. In obesity, levels of the obese gene product leptin are often elevated and may contribute to cardiovascular complications. High-fat diet-induced obesity leads to resistance to leptin-induced cardiomyocyte contractile response [11]. Cardiac leptin resistance in diet-induced obesity is possibly associated with impaired leptin receptor signaling. The brain has evolved mechanisms for sensing and regulating glucose levels in the plasma. Glucose infusions activate the sympathetic nervous system in rats. However, this activation is dependent upon the
underlying predisposition of rats to develop diet-induced obesity when exposed to a diet relatively high in energy and fat content [19]. However, this study confirmed that insensitivity by resistance might not be effective in GABA metabolism.
In summary, this study demonstrated that γ-PGA supplemen- tation significantly increased serum concentrations of glutamate and GABA in control fat diet groups while the effects were not shown in high-fat fed obese rats. In the brain, glutamate concentrations were significantly higher in the γ-PGA supplemented groups both in rats fed the normal and high fat diets than in the no γ-PGA controls. GABA concentration showed the same tendency.
References
1. Meldrum BS. Glutamate as a neurotransmitter in the brain: review of physiology and pathology. J Nutr 2000;130:1007S-1015S.
2. Hawkins RA. The blood-brain barrier and glutamate. Am J Clin Nutr 2009;90:867S-874S.
3. Wong CGT, Bottiglieri T, Snead III OC. GABA, γ-hydroxybutric acid, and neurological disease. Ann Neurol 2003;53:S3-12.
4. Bown AW, Shelp BJ. The metabolism and functions of [gamma]-aminobutyric acid. Plant Physiol 1997;155:1-5.
5. Shelp BJ, Bown AW, Mclean MD. Metabolism and functions of gamma-aminobutyric acid. Trends Plant Sci 1999;4:1360-85.
6. Petroff OAC. GABA and glutamate in the human brain.
Neuroscientist 2002;8:562-73.
7. Gavin JR, Saltman RJ, Tollefsen SE. Growth hormone receptors in isolated rat adipocytes. Endocrinology 1982;110:637-43.
8. Schneider HJ, Oertel H, Hurck M, Pollmächer T, Stalla GK, Steiger A. Night sleep EEG and daytime sleep propensity in adult hypopituitary patients with growth hormone deficiency before and after six months of growth hormone replacement. Psychoneuroen- docrinology 2005;30:29-37.
9. Li H, Cho JY, Gao TC, Choi CR, Lee KD, Cho JE, Cho GS, Ham K-S. Increment of physiologically active compounds in germinated brown rice treated with chitosan and its effect on obesity of rat fed a high fat diet. Journal of the Korean Society of Food Science and Nutrition 2008;37:985-91.
10. Oh SH, Kim HJ, Kim YH, Yu JJ, Park KB, Jeon JI. Changes in some physic-chemical properties and γ-aminobutyric acid content of kimchi during fermentation and storage. Int J Food Sci Nutr 2008;13:219-24.
11. Ren J, Zhu BH, Relling DP, Esberg LB, Ceylan-Isik AF. High-fat diet-induced obesity leads to resistance to leptin-induced cardio- myocyte contractile response. Obesity (Silver Spring) 2008;16:
241-23.
12. Schrauwen P, Westerterp KR. The role of high-fat diets and physical activity in the regulation of body weight. Br J Nutr 2000;84:417-27.
13. Inoue K, Shirai T, Ochiai H, Kasao M, Hayakawa K, Kimura M, Sansawa H. Blood-pressure-lowering effect of a novel fermented milk containing γ-aminobutyric acid (GABA) in mild hypertensives. Eur J Clin Nutr 2003;57:490-5.
14. Kang SE, Rhee JH, Park C, Sung MH, Lee IH. Distribution of poly-γ-glutamate (γ-PGA) producers in Korean fermented foods, Cheongkukjang, Doenjang, and Kochujang. Food Sci Biotechnol 2005;14:704-8.
15. Lee MS, Jang JI, Kim HS. Effect of γ-PGA (Poly-γ-glutamic acid) supplement on calcium absorption and bone metabolism in rats. Journal of the Korean Society of Food Science and Nutrition 2006;35:255-61.
16. Kim TW, Lee TY, Bae HC, Hahm JH, Kim YH, Park C, Kang TH, Kim CJ, Sung MH, Poo HY. Oral administration of high molecular mass poly-γ-glutamate induces NK cell-mediated antitumor immunity. J Immunol 2007;179:775-80.
17. Relling DP, Esberg LB, Cindy X, Johnson WT, Murphy EJ, Carlson EC, Saari JT, Ren J. High-fat-diet-induced juvenile obesity leads to cardiomyocyte dysfunction and upregulation of Foxo3a transcription factor independent of lipotoxicity and apoptosis. J Hypertens 2006;24:549-61.
18. Thakker GD, Frangogiannis NG, Bujak M, Zymek P, Gaubatz JW, Reddy AK, Taffet G, Michael LH, Entman ML, Ballantyne CM. Effects of diet-induced obesity on inflammation and remodeling after myocardial infarction. Am J Physiol Heart Circ Physiol 2006;291:H2504-14.
19. Levin BE, Govek EK, Dunn-Meynell AA. Reduced glucose- induced neuronal activation in the hypothalamus of diet-induced obese rats. Brain Res 1998;808:317-9.
20. Landerberg L. Obesity, metabolism and hypertension. Yale J Biol Med 1989;62:511-9.
21. Park YJ, Lee WC, Yim HW, Park YM. The association between sleep and obesity in Korean Adults. J Prev Med Public Health 2007;40:454-60.
22. Verona RD, Winn MP, Babineau TW, Eng BP, Feldman HR, Ware JC. Overweight and obese patients in a primary care population report less sleep than patients with a normal body mass index. Arch Intern Med 2005;165:25-30.
23. Clarke G, O’Mahony S, Malone G, Dinan TG. An isocratic high performance liquid chromatography method for the determination of GABA and glutamate in discrete regions of the rodent brain.
J Neurosci Methods 2007;160:223-30.
24. Vermeij TAC, Edelbroek PM. Simultaneous high-performance liquid chromatographic analysis of pregabalin, gabapectin and vigabatrin in human serum by precolumn derivatization with
o-phataldialdehyde and fluorescence detection. J Chromatogr 2004;810:297-303.
25. Tanimoto H, Mori M, Motoki M, Torii K, Kaeowaki M, Noguchi T. Natto mucilage containing poly-γ-glutamic acid increases soluble calcium in the rat small intestine. Biosci Biotechnol Biochem 2001;65:516-21.
26. Tcherkas YV, Denisenko AD. Simultaneous determination of several amino acids, including homocysteine, cysteine and glutamic acid, in human plasma by isocratic reversed-phase high performance liquid chromatography with fluorimetric detection.
J Chromatogr A 2001;913:309-13.
27. Terrlink T, van Leeuwen PA, Houdijk A. Plasma amino acids determined by liquid chromatography within 17 minutes. Clin Chem 1994;40:245-9.
28. Wang L, Maher TJ, Wurtman RJ. Oral L-glutamine increases GABA levels in striatal tissue and extracellular fluid. FASEB J 2007;21:1227-32.
29. Park JH, Han SH, Shin MK, Park KH, Li KC. Effect of hypertention falling of functional GABA green tea. Korean Journal of Medicinal Crop Science 2002;10:37-40.
30. Aoki H, Furuya Y, Endo Y, Fujimoto K. Effect of γ -aminobutyric acid-enriched tempeh-like fermented soybean (GABA-Tempeh) on the blood pressure of spontaneously hypertensive rats. Biosci Biotechnol Biochem 2003;67:1806-8.
31. Oh SH. Effects and applications of germinated brown rice with enhanced levels of GABA. Food Science and Industry 2007;40:41-6.
32. Hayakawa K, Kimura M, Kamata K. Mechanism underlying γ -aminobutyric acid-induced antihypertensive effect in spontan- eously hypertensive rats. Eur J Pharmacol 2002;438:104-13.
33. Sasaki K, Hatta S, Haga M, Oshika H. Effects of bilobalide on γ-aminobutyric acid levels and glutamic acid decarboxylase in mouse brain. Eur J Pharmcol 1999;367:165-73.
34. Reeves PG, Nielsen FH, Fahey GC. AIN-93 purified diets for laboratory rodents: Final report of the American Institute of Nutrition Ad Hoc Writing Committee on the reformulation of the AIN-76A rodent diet. J Nutr 1993;123:1939-51.