pISSN 1976-1457 eISSN 2005-6168
Impact of Korean pine nut oil on weight gain and immune responses in high-fat diet-induced obese mice
Soyoung Park
1, Yeseo Lim
1, Sunhye Shin
1and Sung Nim Han
1,2§1
Department of Food and Nutrition, College of Human Ecology, Seoul National University, 1 Gwanak-ro, Gwanak-gu, Seoul 151-742, Korea
2
Research Institute of Human Ecology, Seoul National University, Seoul 151-742, Korea
Abstract
Korean pine nut oil (PNO) has been reported to have favorable effects on lipid metabolism and appetite control. We investigated whether PNO consumption could influence weight gain, and whether the PNO-induced effect would result in an improvement of immune function in high-fat diet (HFD)-induced obese mice. C57BL/6 mice were fed control diets with 10% energy fat from either PNO or soybean oil (SBO), or HFDs with 45% energy fat from 10% PNO or SBO and 35% lard, 20% PNO or SBO and 25% lard, or 30% PNO or SBO and 15% lard for 12 weeks.
The proliferative responses of splenocytes upon stimulation with concanavalin A (Con A) or lipopolysaccharide (LPS), Con A-stimulated production of interleukin (IL)-2 and interferon (IFN)-γ, and LPS-stimulated production of IL-6, IL-1β, and prostaglandin E2 (PGE2) by splenocytes were determined.
Consumption of HFDs containing PNO resulted in significantly less weight gain (17% less, P < 0.001), and lower weight gain was mainly due to less white adipose tissue (18% less, P = 0.001). The reduction in weight gain did not result in the overall enhancement in splenocyte proliferation.
Overall, PNO consumption resulted in a higher production of IL-1β (P = 0.04). Replacement of SBO with PNO had no effect on the production of IL-2, IFN-γ, IL-6, or PGE2 in mice fed with either the control diets or HFDs. In conclusion, consumption of PNO reduced weight gain in mice fed with HFD, but this effect did not result in the overall improvement in immune responses.
Key Words: Pine nut oil, obesity, high-fat diet, immune response, inflammatory cytokine
Introduction
2)Pine nuts, which are oily seeds of the genus pinus, have been utilized for culinary purposes around the world for centuries.
Pinus koraiensis, a native plant of eastern Asia and commonly called the Korean pine nut, is one of the main types of commercial pine nuts. Lipid content of the Korean pine nut comprises 62% of the total weight of the nut [1]. Pine nuts contain fatty acids with an unusual structure, e.g., Δ5-unsaturated polymethylene-interrupted fatty acids (Δ5-UPIFAs). These fatty acids are the characteristic components of lipids obtained from conifer seeds and leaves [2]. Pinolenic acid (18:3, Δ5,9,12) is a major Δ5-UPIFA present in pine nuts. The Korean pine nut oil (PNO) contains 5% palmitic acid (16:0), 2% stearic acid (18:0), 27% oleic acid (18:1, Δ9), 45% linoleic acid (18:2, Δ 9,12), 1% eicosenoic acid (20:1, Δ11), 15% pinolenic acid, and 3% other Δ5-UPIFAs [2].
The health benefits of PNO have been investigated in several studies. Asset et al. [3,4] reported that PNO lowered the total cholesterol and triglyceride levels in animal models. In a study
by Sugano et al. [5], consumption of PNO (22% energy) alleviated high blood pressure in spontaneously hypertensive rats after five weeks of feeding. Hughes et al. [6] showed that providing a PNO capsule prior to an ad libitum buffet lunch resulted in reduced food intake in overweight female subjects.
Pasman et al. [7] observed that cholecystokinin and glucagon-like peptide-I secretion were higher in subjects who received a PNO capsule than in those who received a placebo, thereby supporting the findings by Hughes et al. [6].
Dietary fatty acids, especially polyunsaturated fatty acids (PUFAs), play a major role in regulating immune function by modulating the production of lipid mediators involved in a variety of signaling pathways. In general, n-6 PUFAs are known to promote hyperactive immune responses by providing substrates for proinflammatory lipid mediators; whereas consumption of n-3 PUFAs results in the alleviation of proinflammatory responses [8]. However, γ-linolenic acid (18:3, Δ6,9,12), which is an n-6 PUFA, was reported to suppress chronic inflammation by increasing the cellular levels of dihomo-γ-linolenic acid (20:3, Δ 8,11,14) [9]. Dihomo-γ-linolenic acid can compete with
This work was supported by a grant from the National Research Foundation (NRF) of Korea, funded by the Ministry of Education, Science and Technology (grant number 2010-0024878).
§Corresponding Author: Sung Nim Han, Tel. 82-2-880-6836, Fax. 82-2-884-0305, Email. [email protected] Received: March 29, 2013, Revised: May 17, 2013, Accepted: May 20, 2013
ⓒ2013 The Korean Nutrition Society and the Korean Society of Community Nutrition
This is an Open Access article distributed under the terms of the Creative Commons Attribution Non-Commercial License (http://creativecommons.org/licenses/by-nc/3.0/) which permits unrestricted non-commercial use, distribution, and reproduction in any medium, provided the original work is properly cited.
Control
(10% kcal Fat) High-fat
(45% kcal Fat) 10% Oil 10% Oil
+35% Lard
20% Oil +25% Lard
30% Oil +15% Lard
Casein 200 200 200 200
L-Cystine 3 3 3 3
Sucrose 350 172.8 172.8 172.8
Cornstarch 315 72.8 72.8 72.8
Dyetrose2) 35 100 100 100
PNO3) or SBO 45 45 90 135
Lard 0 157.5 112.5 67.5
t-Butylhydroquinone 0.009 0.009 0.018 0.027
Cellulose 50 50 50 50
Mineral mix4) 35 35 35 35
Vitamin mix5) 10 10 10 10
Choline bitartrate 2 2 2 2
Total 1,045 848.1 848.1 848.1
kcal/g diet 3.69 4.64 4.64 4.64
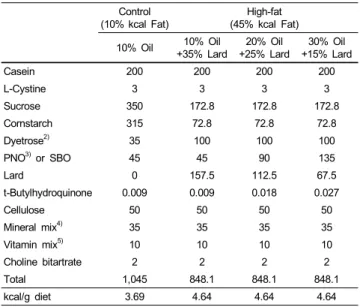
1)Resource: Dyets, Inc, Bethlehem, PA, USA.
2)Dyetrose (Dyets) is dextrinized cornstarch containing 90-94% tetrasaccharides.
3)PNO was a gift from Dubio Co., Ltd. (Gyeonggi-do, Korea).
4)Thirty-five grams of mineral mix (Dyets, #210099) provides 5.1 g calcium, 4 g phosphorus, 3.6 g potassium, 1 g sodium, 1.6 g chloride, 0.5 g magnesium, 0.3 g sulfur, 59 mg manganese, 46 mg iron, 25 mg zinc, 5 mg copper, 0.2 mg selenium, 0.2 mg iodine and 4.2 g sucrose.
5)Ten grams of vitamin mix (Dyets, #300050) provides 4,000 IU vitamin A, 1,000 IU vitamin D3, 50 IU vitamin E, 30 mg niacin, 16 mg pantothenic acid, 7 mg vitamin B6, 6 mg vitamin B1, 6 mg vitamin B2, 2 mg folic acid, 0.8 mg menadione, 0.2 mg biotin, 10 μg vitamin B12 and 9.8 g sucrose.
Table 1. Composition of experimental diets (g)1)
arachidonic acid (20:4, Δ5,8,11,14) as a substrate for cyclooxy- genase and lipoxygenase.
Pinolenic acid, which is the positional isomer of γ-linolenic acid, can also be taken up and elongated to form eicosatrienoic acid (20:3, Δ7,11,14) [10]. Chuang et al. [11] reported that pinolenic acid, taken up by cells, modified the fatty acid composition of cellular phospholipids, resulting in a decreased production of proinflammatory eicosanoids in the murine macrophage cell line. In contrast to the in vitro results, the production of proinflammatory lipid mediators was elevated in animals that were fed with PNO [5,12]. In a study that examined the effects of a five-week PNO diet (22% energy) on immune parameters [12], the relative proportion of splenic CD4
+T lymphocytes, the splenic production of immunoglobulin G and E, and the leukotriene B
4released from peritoneal exudate cells were higher in rats that were fed with PNO compared with those fed with safflower oil (a source of linoleic acid; n-6, 18:2, Δ9,12) or evening primrose oil (a source of γ-linolenic acid; n-6, 18:3, Δ 6,9,12). Therefore, pinolenic acid has the potential to modulate the immune response via a mechanism that may be different from that of other n-6 PUFAs in vivo. However, information regarding the effect of PNO on immune function is limited.
Obesity has been associated with impaired immune function.
It was reported that obese patients had an increased risk of infection [13] and poor antibody response to vaccination [14].
It was suggested that altered levels of circulating hormones and nutrients, such as glucose and lipids, might contribute to dysregulation of the immune cells [15]. Several studies showed that adequate weight reduction could correct the altered immune response [16,17], which suggests that immune response could be improved by weight reduction in obese subjects.
A study by Ferramosca et al. [18] showed that PNO consump- tion led to less weight gain in mice that were fed with a 29%
energy fat diet containing PNO (17% energy). Here, we investigated whether PNO reduced weight gain in high-fat diet (HFD)-induced obese mice and whether this effect led to an improvement in the immune function. To test a dose-dependent effect, 10%, 20%, and 30% of energy was provided by PNO in HFDs (45% energy fat). The effect of PNO replacement in the control diet (10%
energy fat) on immune responses was also investigated. To the best of our knowledge, this is the first study that examines the effect of PNO in both control diet and HFD on the immune function in an animal model.
Materials and Methods
Animals and diets
Five-week-old male C57BL/6 mice were purchased (Central Lab Animal Inc., Seoul, Korea) and randomly divided into 8 groups after 3 days of acclimation. Mice were fed with experi- mental diets for 12 weeks ad libitum. Control diets contained
10% kcal fat from PNO or soybean oil (SBO), e.g., 10% PNO or SBO (PC, SC). The following six different HFDs contained a total of 45% kcal from fat: 10% kcal from PNO or SBO + 35% kcal from lard (P10, S10), 20% kcal from PNO or SBO + 25% kcal from lard (P20, S20), and 30% kcal from PNO or SBO + 15% kcal from lard (P30, S30). PNO was a gift from Dubio Co., Ltd. (Gyeonggi-do, Korea). The composition of experimental diets is shown in Table 1. Mice were housed individually and maintained in an animal facility with controlled temperature (23 ± 3℃) and humidity (55 ± 10%), and a 12 h light/12 h dark cycle. SBO was chosen as the control oil because its fatty acid composition is similar to that of PNO, except for its pinolenic acid content. Antioxidant was added to the diet (0.2 μ g t-butlyhydroquinone/g oil) to prevent oxidation of polyunsa- turated fatty acids, and fresh diet was provided every other day.
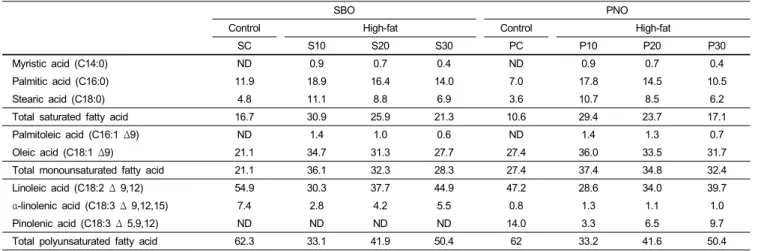
The fatty acid composition of experimental diets is shown in
Table 2. The body weight was recorded once a week, and food
intake was measured 4 times a week. At the end of the experi-
mental period, mice were fasted for 12 hours and euthanized
by asphyxiation with CO
2. Blood was collected via cardiac
puncture. Serum was separated and stored at -80℃ for later
analysis. Epididymal, subcutaneous and perirenal-retroperitoneal
fat pads were dissected and weighed. Spleens were aseptically
removed and placed in a sterile RPMI 1640 media (Lonza,
Walkersville, MD), supplemented with 100 kU/L penicillin
(Gibco, Carlsbad, CA), 100 mg/L streptomycin (Gibco), 2 mmol/L
SBO PNO
Control High-fat Control High-fat
SC S10 S20 S30 PC P10 P20 P30
Myristic acid (C14:0) ND 0.9 0.7 0.4 ND 0.9 0.7 0.4
Palmitic acid (C16:0) 11.9 18.9 16.4 14.0 7.0 17.8 14.5 10.5
Stearic acid (C18:0) 4.8 11.1 8.8 6.9 3.6 10.7 8.5 6.2
Total saturated fatty acid 16.7 30.9 25.9 21.3 10.6 29.4 23.7 17.1
Palmitoleic acid (C16:1 Δ9) ND 1.4 1.0 0.6 ND 1.4 1.3 0.7
Oleic acid (C18:1 Δ9) 21.1 34.7 31.3 27.7 27.4 36.0 33.5 31.7
Total monounsaturated fatty acid 21.1 36.1 32.3 28.3 27.4 37.4 34.8 32.4
Linoleic acid (C18:2 Δ9,12) 54.9 30.3 37.7 44.9 47.2 28.6 34.0 39.7
α-linolenic acid (C18:3 Δ9,12,15) 7.4 2.8 4.2 5.5 0.8 1.3 1.1 1.0
Pinolenic acid (C18:3 Δ5,9,12) ND ND ND ND 14.0 3.3 6.5 9.7
Total polyunsaturated fatty acid 62.3 33.1 41.9 50.4 62 33.2 41.6 50.4
ND, not detected.
1)Fatty acid composition was determined by gas chromatography method.
Table 2. Fatty acid composition of experimental diets (% of fatty acids)1)
L-glutamine (Gibco), and 25 mmol/L HEPES (Sigma Aldrich, St Louis, MO) (complete RPMI). This study was approved by the Animal Care and Use Committee at Seoul National University (approval no. SNU-101029-1).
Isolation of splenocytes
Spleens were minced with the frosted ends of the microscope slides (Fisher Scientific, Waltham, MA) in complete RPMI. After centrifugation, the red blood cells were lysed using Gey’s solution, and the remaining leukocytes were washed twice with complete RPMI. The viable cells were counted by trypan blue exclusion on a hemacytometer (Fisher Scientific). Isolated splenocytes were resuspended in complete RPMI containing 10%
heat-inactivated fetal bovine serum (Gibco) for culture.
Lymphocyte proliferation
Lymphocyte proliferation was determined using a [
3H] thymi- dine incorporation assay. Splenocytes (4 × 10
5cells/well) were cultured in triplicate with concanavalin A (Con A) (Sigma Aldrich) at 0.5 or 1.5 mg/L (final concentration) or lipopoly- saccharide (LPS) (Sigma Aldrich) at 5, 15, or 30 mg/L (final concentration) in a 96-well flat bottom plate (Becton Dickinson, Franklin Lakes, NJ) for 72 hours at 37℃ in the presence of 5%
CO
2. Each well was pulsed with 18.5 kBq of [
3H] thymidine (Perkin Elmer, Boston, MA) for the last 4 hours of incubation.
The cells were harvested on filter paper using a cell harvester (FilterMate; Perkin Elmer), and radioactivity was measured using a liquid scintillation counter (MicroBeta; Perkin Elmer). The results are reported as corrected disintegrations per minute (dpm), which is the average dpm of the mitogen-stimulated wells minus the average dpm of wells without mitogens.
Cytokine and prostaglandin E
2(PGE
2) production
Splenocytes (5 × 10
6cells/well) were stimulated with 5 mg/L of Con A for 48 hours or 10 mg/L of LPS for 24 hours in 24-well plates at 37℃ in a 5% CO
2atmosphere. The cell-free superna- tants were collected and stored at -80℃. Levels of interleukin (IL)-2, interferon (IFN)-γ, IL-6, and IL-1β were measured by ELISA (BD OptEIA set; BD Pharmingen, San Diego, CA) according to the manufacturer’s instructions. Levels of PGE
2were measured using a competitive ELISA kit (PGE
2EIA kit;
Cayman Chemicals, Ann Arbor, MI).
Serum leptin
Serum leptin levels were determined by ELISA (Quantikine
®ELISA kit; R&D Systems, Minneapolis, MN).
Statistical analysis
Statistical analysis was performed using PASW Statistics 18 (SPSS Inc., Chicago, IL). A two-way ANOVA was used to evaluate the overall effects of the fat amount and type of fat used in the diets, and the interaction between these parameters.
When the effects were significant, an LSD multiple-comparison post-hoc test was performed. A Pearson correlation was used to determine the association between the body weight, adipose tissue weight, and serum leptin level. The results from all the comparisons were considered significant at P < 0.05. Data were reported as the mean ± SE.
Results
Weight gain, white adipose tissue weight and energy intake
Weight gain, white adipose tissue weight, and energy intake
SBO PNO
Effect of fat amount,
P value
Effect of fat type, P value
Control High-fat Control High-fat
SC (n = 10)
S10 (n = 11)
S20 (n = 11)
S30 (n = 12)
PC (n = 11)
P10 (n = 11)
P20 (n = 10)
P30 (n = 12)
Body weight at 0 wk (g) 17.3 ± 0.5 17.0 ± 0.4 17.1 ± 0.3 16.8 ± 0.4 16.7 ± 0.4 17.0 ± 0.3 16.9 ± 0.4 16.7 ± 0.4 0.92 0.54 Body weight at 12 wk (g) 32.8 ± 1.0ab 38.5 ± 1.4de 39.4 ± 1.1e 38.0 ± 1.2de 30.5 ± 0.6a 34.6 ± 1.4bc 35.4 ± 1.1bcd 34.6 ± 1.2bc 0.00 0.00 Weight gain (g) 15.5 ± 0.8ab 21.5 ± 1.4cd 22.3 ± 1.0d 21.2 ± 0.9cd 13.8 ± 0.6a 17.5 ± 1.3b 18.5 ± 1.0bc 17.8 ± 1.1b 0.00 0.00 White adipose tissue
weight (g)1)
3.1 ± 0.2b 5.3 ± 0.4d 5.4 ± 0.3d 5.3 ± 0.3d 2.2 ± 0.2a 4.4 ± 0.4c 4.6 ± 0.4cd 4.2 ± 0.3c 0.00 0.00 Average daily Food
intake (g/d)
3.20 ± 0.06d 2.82 ± 0.05bc 2.86 ± 0.03bc 2.89 ± 0.05c 3.20 ± 0.03d 2.76 ± 0.04ab 2.77 ± 0.03abc 2.68 ± 0.05a 0.00 0.01 Average daily energy
intake (kcal/d)2) 11.8 ± 0.2a 13.1 ± 0.2cd 13.3 ± 0.1cd 13.4 ± 0.2d 11.8 ± 0.1a 12.8 ± 0.2bc 12.9 ± 0.2bcd 12.4 ± 0.2b 0.00 0.01 Values are presented as the mean ± SE. A two-way ANOVA was used to determine the effects of fat amount and type, followed by an LSD post-hoc test. Means in a row without a common superscript represent significant differences (P< 0.05).
1)White adipose tissue weight is the sum of the weights of epididymal, subcutaneous, and perirenal-retroperitoneal depots.
2)Average daily energy intake (kcal/d) = Average daily food intake (g/d) × Calories per g diet (kcal/g diet).
Table 3. Body weight, weight gain, white adipose tissue weight, food intake and energy intake of mice fed with control diets or HFDs containing PNO or SBO
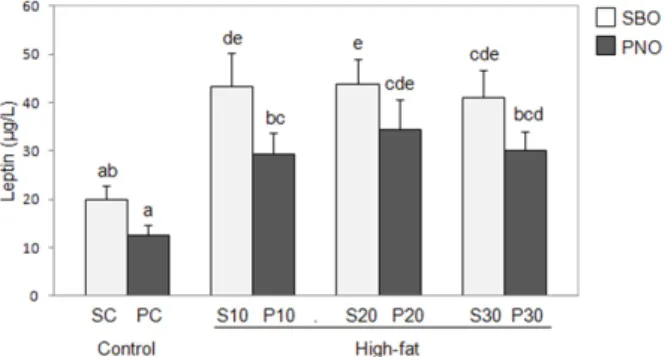
Fig. 1. Serum leptin levels of mice fed with control diets or HFDs containing PNO or SBO (SC, n = 10; PC, n = 11; S10, n = 11; P10, n = 11; S20, n = 11;
P20, n = 10; S30, n = 12; P30, n = 12). Values are presented as the mean ± SE.
A two-way ANOVA was used to determine the effects of fat amount and type, followed by an LSD post-hoc test. Labeled means without a common letter represent significant differences (P< 0.05). Serum leptin levels were determined by ELISA.
were significantly affected by the amount and type of fat used in the diets. No significant interaction was observed (Table 3).
Replacement of SBO with PNO resulted in less weight gain and less white adipose tissue in mice fed with HFDs. Mice in the P10 (P = 0.01), P20 (P = 0.01), and P30 (P = 0.02) groups gained less body weight than those in the S10, S20, and S30 groups, respectively, after 12 weeks on the diet. Mice in the P10 (P = 0.04), P20 (P = 0.07), and P30 (P = 0.02) groups had less white adipose tissue than those in the S10, S20, and S30 groups, respectively. PNO consumption also led to less white adipose tissue in mice fed with control diets (P = 0.05). A significantly positive correlation was observed between weight gain and white adipose tissue weight (r = 0.91, P < 0.001).
Inclusion of PNO in HFD resulted in less energy intake than the inclusion of SBO in HFD, and this was due to less food intake. Mice in the P30 group consumed significantly less energy than those in the S30 group (P < 0.001). In mice fed with control diets, there was no significant difference in energy intake between the PC and SC groups. These data indicate that the reduced weight gain in mice that were fed with PNO-containing HFDs was mainly due to a decrease in adiposity, and might be partly mediated by a reduction in food intake.
Serum leptin
Overall, serum leptin levels were higher in mice fed with HFDs than those fed with control diets (P < 0.001), and PNO replacement resulted in lower serum leptin levels (P < 0.001) (Fig. 1). Mice in the P10 group had significantly lower serum leptin levels than those in the S10 group (P = 0.04). The serum leptin level showed a significantly positive correlation with weight gain (r = 0.88, P < 0.001) and white adipose tissue weight (r = 0.90, P < 0.001), supporting the contention that PNO decreased adiposity.
Lymphocyte proliferation
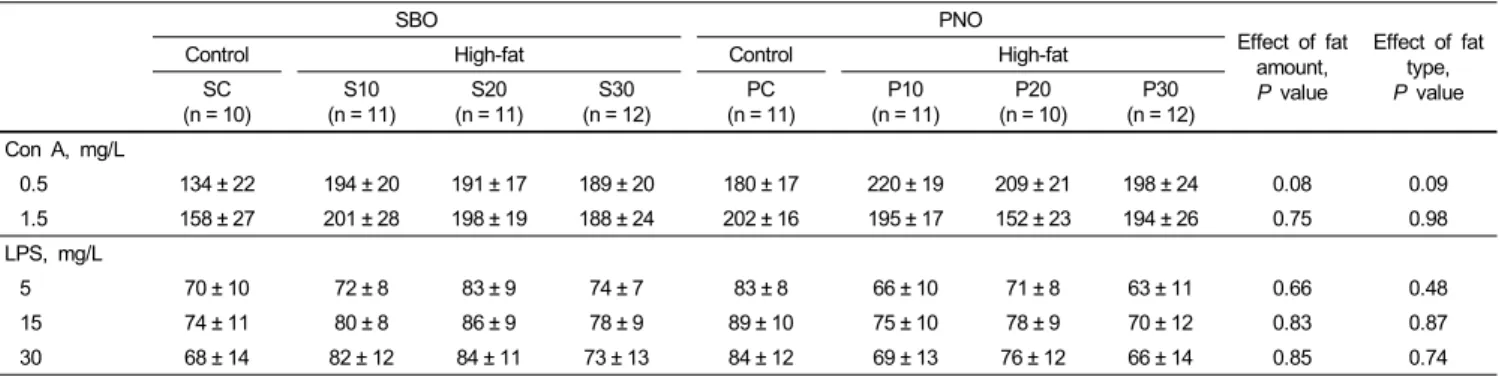
Overall, the proliferative response of splenocytes to Con A at 0.5 mg/L tended to be higher in mice fed with HFDs compared with those that were fed with control diets (P = 0.08), and consumption of PNO generally tended to result in higher proliferative responses of splenocytes to Con A at 0.5 mg/L (P = 0.09) (Table 4). The proliferative response of splenocytes to Con A at 1.5 mg/L or to LPS at 5, 15, and 30 mg/L was not signifi- cantly affected by the amount or type of fat used in the diets.
Cytokine and PGE
2production
Overall, the production of IL-1β by splenocytes, stimulated
with 10 mg/L of LPS, was significantly higher in mice fed with
PNO (P = 0.04); whereas, the amount of fat did not have a
significant effect (Table 5). There was no significant influence
of the amount or type of fat on the production of IL-2, IFN-γ,
IL-6, or PGE
2.
SBO PNO
Effect of fat amount, P value
Effect of fat type, P value
Control High-fat Control High-fat
SC (n = 10)
S10 (n = 11)
S20 (n = 11)
S30 (n = 12)
PC (n = 11)
P10 (n = 11)
P20 (n = 10)
P30 (n = 12) Con A, mg/L
0.5 134 ± 22 194 ± 20 191 ± 17 189 ± 20 180 ± 17 220 ± 19 209 ± 21 198 ± 24 0.08 0.09
1.5 158 ± 27 201 ± 28 198 ± 19 188 ± 24 202 ± 16 195 ± 17 152 ± 23 194 ± 26 0.75 0.98
LPS, mg/L
5 70 ± 10 72 ± 8 83 ± 9 74 ± 7 83 ± 8 66 ± 10 71 ± 8 63 ± 11 0.66 0.48
15 74 ± 11 80 ± 8 86 ± 9 78 ± 9 89 ± 10 75 ± 10 78 ± 9 70 ± 12 0.83 0.87
30 68 ± 14 82 ± 12 84 ± 11 73 ± 13 84 ± 12 69 ± 13 76 ± 12 66 ± 14 0.85 0.74
Values are presented as the mean ± SE. A two-way ANOVA was used to determine the effects of fat amount and type.
Splenocytes (4 × 10⁵ cells/well) were stimulated with Con A or LPS in 96-well flat bottomed plates for 72 hours at 37℃ in the presence of 5% CO2. Final concentrations of mitogens were 0.5 and 1.5 mg/L for Con A and 5, 15 and 30 mg/L for LPS. Lymphocyte proliferation was measured by assessing [3H] thymidine incorporation during the last 4 hours of incubation. The results are reported as dpm, which are the average dpm of mitogen-stimulated wells minus the average dpm of the wells without mitogens.
Table 4. The proliferative responses of splenocytes from mice fed with control diets or HFDs containing PNO or SBO (× 103 dpm)
SBO PNO
Effect of fat amount,
P value
Effect of fat type,
P value
Control High-fat Control High-fat
SC
(n = 10) S10
(n = 11) S20
(n = 11) S30
(n = 12) PC
(n = 11) P10
(n = 11) P20
(n = 10) P30
(n = 12) Con A, 5 mg/L
IL-2 (ng/L) 217 ± 37 292 ± 54 287 ± 59 237 ± 48 189 ± 26 223 ± 33 239 ± 60 199 ± 24 0.47 0.15
IFN-γ (μg/L) 1.9 ± 1.0 1.4 ± 0.6 1.6 ± 0.7 1.2 ± 0.4 1.7 ± 0.6 1.1 ± 0.4 2.9 ± 2.3 1.2 ± 0.4 0.66 0.76
LPS, 10 mg/L
IL-6 (μg/L) 1.7 ± 0.2 1.9 ± 0.2 2.2 ± 0.1 2.0 ± 0.1 2.0 ± 0.1 2.1 ± 0.2 2.1 ± 0.2 2.0 ± 0.2 0.36 0.43
IL-1β (ng/L) 38 ± 9a 52 ± 18ab 41 ± 11ab 53 ± 18ab 53 ± 13ab 71 ± 20ab 72 ± 16ab 82 ± 15b 0.55 0.04
PGE2 (ng/L) 683 ± 171 637 ± 81 644 ± 97 475 ± 81 451 ± 73 563 ± 66 864 ± 399 597 ± 159 0.57 0.94
Values are presented as the mean ± SE. A two-way ANOVA was used to determine the effects of fat amount and type, followed by an LSD post-hoc test. Means in a row without a common superscript represent significant differences (P< 0.05).
Splenocytes (5 × 10⁶ cells/well) were stimulated with Con A (5 mg/L, final concentration) for 48 hours or LPS (10 mg/L, final concentration) for 24 hours in 24-well plates at 37℃ in a 5% CO2 atmosphere. Cell-free supernatants were collected, and the levels of IL-2, IFN-γ, IL-6, IL-1β, and PGE2 were measured by ELISA.
Table 5. The production of cytokines and PGE2 by splenocytes from mice fed with control diets or HFDs containing PNO or SBO
Discussion
PNO has been reported to have favorable effects on lipid metabolism [10,19], blood pressure [5], appetite control [6,7], and eicosanoid production [11]. However, a few studies have been conducted to determine the effects of PNO on the immune function [12]. We focused on whether PNO consumption could influence weight gain, and whether the impact of PNO on reduced weight gain resulted in an improvement in the immune function in HFD-induced obese mice. We showed that mice fed with PNO-containing HFD gained less body weight and had less adipose tissue than those fed with SBO-containing HFD. However, dose-dependent effects of PNO on weight gain and white adipose tissue weight were not observed among the different doses of PNO tested in this study.
PNO consumption tended to increase lymphocyte proliferation when the cells were stimulated with Con A at 0.5 mg/L; however, it did not have any significant influence on lymphocyte prolifera- tion when the cells were stimulated with Con A at 1.5 mg/L or with LPS at 5, 15, or 30 mg/L. Thus, it is inconclusive whether consumption of PNO will result in improved lymphocyte prolife- ration. Additionally, we cannot conclude that higher lymphocyte
proliferation observed upon Con A stimulation at 0.5 mg/L in mice fed with PNO was due to less weight gain and lower adipose tissue weight because obese mice, compared with the control mice, tended to have higher lymphocyte proliferation upon treat- ment with Con A at 0.5 mg/L as well.
It has been reported that obesity could contribute to impaired immune response [20]. Sato Mito et al. [21] and Moriguchi et al. [22] reported that the proliferative response to T cell mitogens was significantly lower in obese animal models. However, we did not observe diminished proliferative responses in lymphocytes from obese mice. Instead, the lymphocyte proliferative response to Con A at 0.5 mg/L tended to be higher in obese mice compared with the lean control mice. Differences in the final body weight and age of animals could be the reasons for discrepancies between results by us and by Sato Mito et al. [21] or Moriguchi et al.
[22]. In our study, 5-week-old mice were fed with HFD with 45% energy fat for 12 weeks to induce obesity. The average final body weight of obese mice was 16% higher than that of control mice (36.8 g in obese mice vs. 31.6 g in control mice).
In the study by Sato Mito et al. [21], 4-week-old mice were
fed with HFD with 50% energy fat for 7 months, and obese
mice weighed about 2 times more than control mice (45.7 g in
obese mice vs. 23.3 g in control mice) at the end of the experiment. In the study by Moriguchi et al. [22], genetically obese 8-week-old Zucker rats were obtained and maintained for 10 months. Obese rats weighed about 3 times more than control rats at the end of the experiment (833 g in obese rats vs. 256 g in control rats). Mito et al. [23] reported that proliferation of splenocytes in response to T cell mitogens in diet-induced obese mice was higher, but not statistically significant compared to that of lean mice. In that study, 4-week-old mice were fed with HFD with 50% energy fat for 13 weeks and the average final body weight of obese mice was 31% higher than that of control mice (30.8 g in obese mice vs. 23.5 g in control mice), which is consistent with our results. In young (24- to 34-year-old) obese human subjects, who did not have metabolic disorders, peripheral blood mononuclear cell proliferation in response to T cell mitogens was not significantly different from that of normal weight subjects [24]. It seems that mild obesity does not significantly suppress the lymphocyte proliferative response, especially in early adulthood.
Ahmed et al. [16] reported that 7% and 10% weight reduction after 10% and 30% energy restriction, respectively, enhanced T cell-mediated immune responses in obese subjects. Tanaka et al.
[17] reported that the altered T cell function observed in obese subjects was corrected after 26% weight reduction. In the current study, mice fed with HFD with PNO consumed 4% less energy and weighed 10% less than those fed with HFD containing SBO.
However, reduced weight gain did not result in an overall improvement in lymphocyte proliferative responses to T cell mitogens. In most studies using animal models, beneficial effects of energy restriction on immune responses was observed when animals were fed 20% to 60% less food [25]. The magnitude of the reduction in energy intake and weight gain in this study seemed to be insufficient to have a significant influence on lymphocyte proliferation.
Overall, PNO did not affect the inflammatory markers measured in this study. IL-6 and PGE
2production by splenocyte was not significantly different between mice that were fed with PNO and those fed with SBO. However, splenocyte production of IL-1β was significantly higher in mice that were fed with PNO than in mice fed with SBO. IL-1β is a proinflammatory cytokine that facilitates T cell proliferation and activation [26,27]. In a study by Matsuo et al. [12], consumption of PNO (22% kcal) for five weeks resulted in higher leukotriene B
4release from rat peritoneal exudate cells when compared with other oil groups. These results suggest that PNO might have an immune-activating effect by facilitating the inflammatory response, which is a mandatory process for promoting appropriate immune responses; although the mechanism remains to be delineated. In this study, SBO used as control oil contains 7.4% α-linolenic acid, which is an n-3 PUFA. Consumption of n-3 PUFAs has been linked to an alleviation of inflammation [8]. It was reported that consumption of α-linolenic acid reduced eicosanoid synthesizing capacity in various tissues [28]. These raise a question that there is a
possibility that the levels of inflammatory markers measured in this study could be affected by α-linolenic acid in SBO diets.
However, in studies which showed that α-linolenic acid decreased eicosanoid production using a mouse model, the amount of α -linolenic acid included was 5.0-7.3 g/100 g diet [29-31]. In this study, the amount of α-linolenic acid included in SBO diets were 0.3 g/100 g diet in the SC group, 0.7 g/100 g diet in the S10 group, 1.0 g/100 g diet in the S20 group, and 1.3 g/100 g diet in the S30 group. Therefore, the amounts in SBO diets do not reach the levels that have been reported to have an anti- inflammatory influence. Except for IL-1β, significant differences were not observed in the inflammatory markers in this study.
In addition, PGE
2levels were also not significantly different between the two oil groups, and dose-dependent changes were not observed in mice fed with SBO diets. Thus, anti-inflam- matory effect of α-linolenic acid as an n-3 PUFA seemed to be minimal with the amount included in SBO diets.
In the current study, we showed that the consumption of HFD, partially substituted with PNO for 12 weeks, led to reduced weight gain, which was mainly due to less white adipose tissue in the mice. The effect of lower weight gain did not result in an overall enhancement of the proliferative responses of splenocytes.
As the production of IL-1β by splenocytes was higher in mice fed with PNO, there is a possibility that PNO has the effect of activating the immune response; however, further studies are needed to determine the mechanisms of the effect of PNO on IL-1β production, and whether PNO affects the production of other inflammatory markers.
References
1. Rural Development Administration, National Academy of Agricultural Science. Food Composition Table. 8th rev. ed.
Suwon: National Academy of Agricultural Science; 2011.
2. Wolff RL, Pédrono F, Pasquier E, Marpeau AM. General chara- cteristics of Pinus spp. seed fatty acid compositions, and impor- tance of delta5-olefinic acids in the taxonomy and phylogeny of the genus. Lipids 2000;35:1-22.
3. Asset G, Baugé E, Wolff RL, Fruchart JC, Dallongeville J. Pinus pinaster oil affects lipoprotein metabolism in apolipoprotein E-deficient mice. J Nutr 1999;129:1972-8.
4. Asset G, Staels B, Wolff RL, Baugé E, Madj Z, Fruchart JC, Dallongeville J. Effects of Pinus pinaster and Pinus koraiensis seed oil supplementation on lipoprotein metabolism in the rat.
Lipids 1999;34:39-44.
5. Sugano M, Ikeda I, Wakamatsu K, Oka T. Influence of Korean pine (Pinus koraiensis)-seed oil containing cis-5,cis-9,cis-12- octadecatrienoic acid on polyunsaturated fatty acid metabolism, eicosanoid production and blood pressure of rats. Br J Nutr 1994;72:775-83.
6. Hughes GM, Boyland EJ, Williams NJ, Mennen L, Scott C, Kirkham TC, Harrold JA, Keizer HG, Halford JC. The effect of Korean pine nut oil (PinnoThinTM) on food intake, feeding behaviour and appetite: a double-blind placebo-controlled trial.
Lipids Health Dis 2008;7:6.
7. Pasman WJ, Heimerikx J, Rubingh CM, van den Berg R, O'Shea M, Gambelli L, Hendriks HF, Einerhand AW, Scott C, Keizer HG, Mennen LI. The effect of Korean pine nut oil on in vitro CCK release, on appetite sensations and on gut hormones in post-menopausal overweight women. Lipids Health Dis 2008;7:10.
8. Galli C, Calder PC. Effects of fat and fatty acid intake on inflammatory and immune responses: a critical review. Ann Nutr Metab 2009;55:123-39.
9. Kapoor R, Huang YS. Gamma linolenic acid: an antiinflammatory omega-6 fatty acid. Curr Pharm Biotechnol 2006;7:531-4.
10. Tanaka T, Hattori T, Kouchi M, Hirano K, Satouchi K. Methylene- interrupted double bond in polyunsaturated fatty acid is an essential structure for metabolism by the fatty acid chain elonga- tion system of rat liver. Biochim Biophys Acta 1998;1393:
299-306.
11. Chuang LT, Tsai PJ, Lee CL, Huang YS. Uptake and incorpora- tion of pinolenic acid reduces n-6 polyunsaturated fatty acid and downstream prostaglandin formation in murine macrophage.
Lipids 2009;44:217-24.
12. Matsuo N, Osada K, Kodama T, Lim BO, Nakao A, Yamada K, Sugano M. Effects of gamma-linolenic acid and its positional isomer pinolenic acid on immune parameters of Brown-Norway rats. Prostaglandins Leukot Essent Fatty Acids 1996;55:223-9.
13. Milner JJ, Beck MA. The impact of obesity on the immune response to infection. Proc Nutr Soc 2012;71:298-306.
14. Weber DJ, Rutala WA, Samsa GP, Santimaw JE, Lemon SM.
Obesity as a predictor of poor antibody response to hepatitis B plasma vaccine. JAMA 1985;254:3187-9.
15. Nieman DC, Henson DA, Nehlsen-Cannarella SL, Ekkens M, Utter AC, Butterworth DE, Fagoaga OR. Influence of obesity on immune function. J Am Diet Assoc 1999;99:294-9.
16. Ahmed T, Das SK, Golden JK, Saltzman E, Roberts SB, Meydani SN. Calorie restriction enhances T-cell-mediated immune response in adult overweight men and women. J Gerontol A Biol Sci Med Sci 2009;64A:1107-13.
17. Tanaka S, Isoda F, Ishihara Y, Kimura M, Yamakawa T. T lymphopaenia in relation to body mass index and TNF-alpha in human obesity: adequate weight reduction can be corrective. Clin Endocrinol (Oxf) 2001;54:347-54.
18. Ferramosca A, Savy V, Einerhand AWC, Zara V. Pinus koraiensis seed oil (PinnoThinTM) supplementation reduces body weight gain and lipid concentration in liver and plasma of mice. J Anim Feed Sci 2008;17:621-30.
19. Tanaka T, Takimoto T, Morishige J, Kikuta Y, Sugiura T, Satouchi K. Non-methylene-interrupted polyunsaturated fatty acids: effective substitute for arachidonate of phosphatidylinositol. Biochem Biophys Res Commun 1999;264:683-8.
20. Lamas O, Marti A, Martínez JA. Obesity and immunocompetence.
Eur J Clin Nutr 2002;56 Suppl 3:S42-5.
21. Sato Mito N, Suzui M, Yoshino H, Kaburagi T, Sato K. Long term effects of high fat and sucrose diets on obesity and lymphocyte proliferation in mice. J Nutr Health Aging 2009;13:602-6.
22. Moriguchi S, Kato M, Sakai K, Yamamoto S, Shimizu E.
Decreased mitogen response of splenic lymphocytes in obese Zucker rats is associated with the decreased expression of glucose transporter 1 (GLUT-1). Am J Clin Nutr 1998;67:1124-9.
23. Mito N, Hosoda T, Kato C, Sato K. Change of cytokine balance in diet-induced obese mice. Metabolism 2000;49:1295-300.
24. Han SN, Jeon KJ, Kim MS, Kim HK, Lee AJ. Obesity with a body mass index under 30 does not significantly impair the immune response in young adults. Nutr Res 2011;31:362-9.
25. Jolly CA. Dietary restriction and immune function. J Nutr 2004;
134:1853-6.
26. Joseph SB, Miner KT, Croft M. Augmentation of naive, Th1 and Th2 effector CD4 responses by IL-6, IL-1 and TNF. Eur J Immunol 1998;28:277-89.
27. Ben-Sasson SZ, Hu-Li J, Quiel J, Cauchetaux S, Ratner M, Shapira I, Dinarello CA, Paul WE. IL-1 acts directly on CD4 T cells to enhance their antigen-driven expansion and differentiation.
Proc Natl Acad Sci U S A 2009;106:7119-24.
28. Marshall LA, Johnston PV. Modulation of tissue prostaglandin synthesizing capacity by increased ratios of dietary alpha-linolenic acid to linoleic acid. Lipids 1982;17:905-13.
29. Fritsche KL, Johnston PV. Modulation of eicosanoid production and cell-mediated cytotoxicity by dietary α-linolenic acid in BALB/c mice. Lipids 1989;24:305-11.
30. Fritsche KL, Johnston PV. Effect of dietary α-linolenic acid on growth, metastasis, fatty acid profile and prostaglandin production of two murine mammary adenocarcinomas. J Nutr 1990;120:
1601-9.
31. Winnik S, Lohmann C, Richter EK, Schäfer N, Song WL, Leiber F, Mocharla P, Hofmann J, Klingenberg R, Borén J, Becher B, Fitzgerald GA, Lüscher TF, Matter CM, Beer JH. Dietary α -linolenic acid diminishes experimental atherogenesis and restricts T cell-driven inflammation. Eur Heart J 2011;32:2573-84.