. iltfl
Pergamon~ 0360-1323/\ Prinlcd i
PU: S0361l-1323(97)00017-()
Influence of Ventilation on Indoor Radon Level
CHRISTOPHER Y. H. CHAO* (Received 16 January 1997; accep1ed25April1997) THOMAS C. W. TUNGt
JOHN BURNETTt
Detal'letl rado11111ea.mreme111s were co11d11c1ed al different residemial 1111its in Hong Kong i11 wli1ter lime when air·co11ditio11ers were off and also in summer lime when air-co11di1io11er~ were 011.
Ve11tilatio11 ra1es were 111eas11red co11c11rre111/y to i1westigllle the i11f/11e11ce of ventilation on indoor radon level. The ratio of indoor radon level to outdoor radon level was plotted agaimt ventilation ra1e, a11d it was formd that " critical ua/ue existed after whiclr the indoor radon leuel could be co11sidered identical to the outdoor level. This result is lmporta111 for use i11 vemilation design co reduce Indoor radon pollution.© 1997 Published by Elseoier Science Ltd.
ACH = q/V
c
C(oo)
M;
q
v
I ).NOMENCLATURE
surface area of building material j in the room [m2]
air excha.nge rate of the sampling room [h-1]
indoor radon concentration [Bq m -'l
equilibrium indoor radon concentration [Bqm-'l
initial indoor radon concentration [Bq m-31
outdoor radon concentration [Bqm-3]
radon emanation rate of building material j [Bqm-2h-1]
initial slope of the radon growth curve inside the sampling room [Bqm-'h-'l
leakage rate [m3 h- 'l time unit [hl
effective volume of the sampling room [m'l radon-222 decay constant (7 .553585 x 10-3) [h-'l
INTRODUCTION
Most buildings in Hong Kong are high rise structures and many residential units are located at high elevation from the ground; soil re-entry of radon gas is a relatively small contribution lo the indoor radon level. Granite and concrete are widely used as building materials in Hong
•Kong, and the radon emanation rate has been found to be high in these materials. The radon emanation rate of concrete has been found to be 21x10-6Bqkg-1 s-1, and that of brick is 13x10-6Bqkg-1 s-1 [l]. The radon emanation rates of these building materials in other coun- tries are much smaller [1]. The indoor radon build up comes mainly from radon emission from building materials, which is different from the situation in the United States and other European countries [2].
*Department of Mechanical Engineering, The Hong Kong University of Science & Technology, Clear Water Bay, Hong Kong.
tDepartment of Building Services Engineering, The Hong Kong Polytechnic University, Hung Hum, Hong Kong.
527
In Hong Kong, the winter period is from mid Nov- ember to the end of April of the following year. The average temperature is around 25°C in October and falls down to around l6°C in February. In summer time most residential units turn on their air-conditioning units, but in winter time the air-conditioners are usually off. Natural ventilation is thus the common mode for fresh air ex- change in winter time. Most people close the doors and windows of their homes in winter time for the purpose of thermal comfort and also for security. The ventilation rate is thus reduced. However, it also depends on how tight the building is and how high the wind speed is around the building. For those buildings with low fresh air exchange, indoor radon can easily accumulate to a high level.
A series of measurement has been conducted to inves- tigate how the fresh air exchange affects the indoor radon level. Particular attention has been paid to the difference between the indoor radon level and the outdoor radon level in different areas.
In this study, 12 residential premises were visited during the period 12 January 1996 to 15 August 1996.
The geological composition of the selected sites covered granite, volcanic rocks and reclamation. Three of the sites were located at three outlying islands of Hong Kong.
Their geological composition was composed of mainly volcanic rocks. The other sampling sites sat mainly on granite substrates, except for one site which sat on a reclamation substrate composed of granite, rocks and sand. The outdoor radon level was affected by meteoro- logical, topographical and geological conditions.
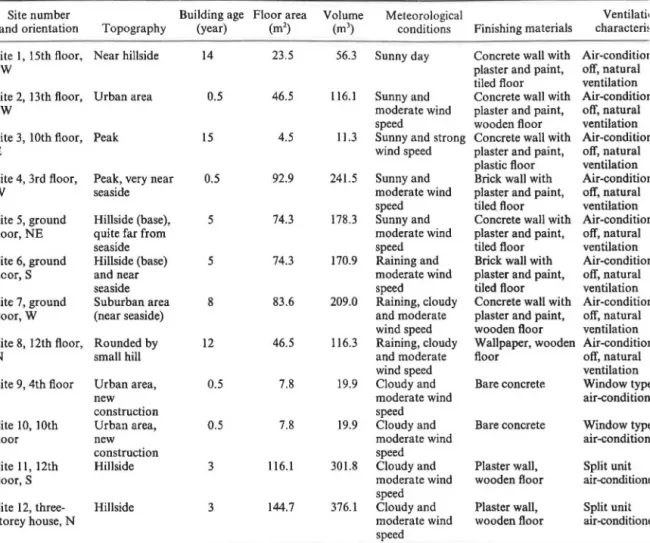
Volumes of the sites varied from 11.3 to 376.l m3 and the total radon emitting surface areas varied from 30.5 to 571.4m2• Ratios of the radon emitting surface area to volume of the site varied from 2 to 3m2m-3• Table I summarizes the location, topography, ofientation, meteorological condition and types of building materials and finishing in the sites. The smallest site (with volume 11.3 m3) was part of a refurnished apartment with wall
Table I. Information on the sites
Site number Building age Floor area
and orientation Topography (year) (m2) Site I, 15th floor, Near hillside 14 23.5 SW
Site 2, 13th floor, Urban area 0.5 46.5 SW
Site 3, 10th floor, Peak 15 4.5
E
Site 4, 3rd floor, Peak, very near 0.5 92.9
w
seasideSite 5, ground Hillside (base), 5 74.3 floor, NE quite far from
seaside
Site 6, ground Hillside (base) 5 74.3 flcor, S and near
seaside
Site 7, ground Suburban area 8 83.6 floor, W (near seaside)
Site 8, 12th floor, Rounded by 12 46.5
N small hill
Site 9, 4th floor Urban area, 0.5 7.8 new
construction
Site 10, 10th Urban area, 0.5 7.8
floor new
construction
Site 11, 12th Hillside 3 116.1
floor, S
Site 12, three- Hillside 3 144.7
storey house, N
partitions separating it from the rest of the unit. It could be treated as separate premises in our test.
EXPERIMENTAL METHOD
A solid state radon detector, Niton Rad7, was used in this study. The Rad7 detector pulls samples of air through a fine inlet filter into a chamber for analysis. The filtered air decays inside the chamber producing detectable alpha emitting progeny, particularly the polonium isotopes.
The solid state detector converts ex radiation directly to an electrical signal using the alpha spectrometry technique which is able to distinguish radon from thoron and signal from noise [3]. The detector is sent back to the manu- facturer for calibration twice every year. The calibration procedure is carried out in a well-controlled environ- mental chamber and the reading is compared to a master instrument. Overall calibration accuracy of the detector is 5% based on a sensitivity of0.4countsmin-1 pci-11-1• The range of the monitor is from 0.1 to 5000pCi1-1•
For sites 1-10, two Rad7 detectors were used for con- tinuous monitoring of both the indoor and outdoor radon levels. One detector was located in either the living room or the bedroom depending on which room was closer to the center of the unit. The sampling inlet was
Volume Meteorological Ventilati•
(ml) 56.3
116.1
11.3
241.5
178.3
170.9
209.0
116.3
19.9
19.9
301.8
376.l
conditions Finishing materials characterfr Sunny day Concrete wall with Air-conditior plaster and paint, off, natural tiled floor ventilation Sunny and Concrete wall with Air-conditior moderate wind plaster and paint, off, natural
speed wooden floor ventilation
Sunny and strong Concrete wall with Air-conditior.
wind speed plaster and paint, off, natural plastic floor ventilation Sunny and Brick wall with Air-conditior moderate wind plaster and paint, off, natural
speed tiled. floor ventilation
Sunny and Concrete wall with Air-conditior moderate wind plaster and paint, off, natural
speed tiled floor ventilation
Raining and Brick wall with Air-conditior moderate wind plaster and paint, off, natural
speed tiled floor ventilation
Raining, cloudy Concrete wall with Air-condition and moderate plaster and paint, off, natural wind speed wooden floor ventilation Raining, cloudy Wallpaper, wooden Air-condition
and moderate floor off, natural
wind speed ventilation
Cloudy and Bare concretr. Window type
moderate wind air-conditiom
speed
Cloudy and Bare concrete Window type
moderate wind air-condition<
speed
Cloudy and Plaster wall, Split unit moderate wind wooden floor air-conditione speed
Cloudy and Plaster wall, Split unit moderate wind wooden floor air-conditione speed
located at breathing zone level. The other detecto1 connected with a flexible sampling tube to collec outdoor fresh air for background measurement. Thf door radon level was measured simultaneously wit indoor level. The sampling flow rates of the dete were preset at 11 min -1• The measurement in each lasted for about 3 days (72 h). For sites 1-8 the tests conducted in winter and all the air-conditioners switched off. For sites 9 and 10 the tests were do summer and the window air-conditioner units were Site 11 had a larger area and three tests were cond1 at the site. There was a living room, a dining roorr.
four bedrooms in the premises. Split unit air-conditi<
were used in the premises. Radon measurements conducted in the living room and the four bedn simultaneously. The outdoor radon level was also n tored concurrently.
Site 12 was a three-storey house and three tests conducted on this site. The house had one living 1
together with two to three bedrooms on each floe basement was attached to the underground car I Split unit air-conditioners were provided on each except for the basement. In test 1 all the internal ci were open and all the air-Conditioning units in the h were turned on. Radon measurements were conduct·
the basement area, ground floor living room and se•
L
lloor living room. The measurement also lasted for 72h.
The outdoor radon level was monitored by one dete.ctor concurrently. In test 2 all the internal doors were open
;ind all the air-conditioning units were turned off. Radon measurements were conducted at the ground floor (jving room, first floor living room and second floor living room, also for 72 h. The outdoor radon level was also monitored continuously. In test 3 all the doors and win- dows of the house were opened for 1 h and then all the openings were closed. No air-conditioning was on during this period of measurement.
The air exchange rate of each site was determined by the tracer gas decay method. C02 was used as the tracer gas in the study and a Telaire-1050 monitor was used.
The Telaire 1050 model uses non-dispersive infrared (NDIR) for C02 measurement in diffusion gas sampling mode. The accuracy is 5% of the reading or 50ppm depending on which is larger. The maximum C02 level that can be detected is 2000 ppm. The initial C02 con- centration was built up to around 2000 ppm and was allowed to decay freely to the background level. The ambient C02 level was also measured and found to be between 400 and 500 ppm depending on the location of the site. Calibration of the monitor was done regularly in the laboratory using a low pressure gas bottle con- taining 171 of calibrated C02 gas in nitrogen. The dosing level at 2000 ppm at each site has been found to be accept- able within our testing condition since the decay took about I h and a fairly clear straight line was found in the logarithm plot. The fresh air exchange rate was calculated from the C02 decay curve. During the C02 measurement period no occupant was staying inside the unit. One day time ventilation rate and one night time ventilation rate were measured for sites 1-8. For sites 9-12 only the day time ventilation rates were measured. Other than the radon and air exchange rate measurements, parameters like temperature, size of the residential units, building materials used, site orientation, topographic and meteorological conditions were also recorded in the experiment.
RESULTS AND DISCUSSION Measurement results at sites 1-10
The mean indoor and outdoor radon concentrations during the 72 h period are summarized in Table 2. Exam-
pies of some of the radon measurements are shown in Figs 1-4.
The highest mean indoor radon level recorded was 424Bqm-3 at site 6 on the ground floor. During the experiment, the occupant was not present. The doors and windows were closed. Under low air exchange rate condition, radon could accumulate up to a very high level within 1 day. The radon growth curve is shown in Fig. 3.
At this site the indoor radon level was six times higher than the outdoor radon concentration (71 Bq m-3). It was also two times higher than the guideline set by the Hong Kong Environmental Protection Department (200 Bq m-3). The outdoor radon level was found to be very high due to the geological nature of the soil in that area. The house sits on a granitic area where the radium content has been found to be high. In addition, the wind movement was quite stagnant on the date of measure- ment and the convective effect in removing ground floor pollutant was poor. This explained why the outdoor level was high on that day (similarly for sites 9 and 10). Site 6 was not equipped with an air-conditioning unit and the windows were all closed during the measurement which followed the living pattern as indicated by the occupants.
High outdoor radon level and low ventilation rate led to a very high indoor radon accumulation at the site.
The minimum indoor radon level was observed at site 2 on the 13th floor. The indoor radon level was 15 Bq m-3 which was almost identical with the outdoor radon level {14Bqm-3).
For those measurements conducted in winter time (sites 1-8), all the windows were closed except one which was left partially closed. For the measurements con- ducted in summer time (sites 9 and 10), all the windows were closed and the air-conditioning units were turned on. The average air exchange rates in each site are also summarized in Table 2. The air exchange rate varied from o.20h-1 at site 6 to 7.2h-1 at site 3. In winter when the air-conditioners were off, outdoor air exchanges with indoor air by two mechanisms. One is diffusion and the other is convection. In general, diffusion is negligible when compared with convection. The air exchange rate depends on the tightness of the building, the window opening condition and also the outside wind condition.
If the outside wind speed is high, a higher pressure differ- ential is established across the outside and inside. In this case, a higher air exchange rate is expected. From Tables 1 and 2, it is observed that those sites located at a higher
Table 2. Average indoor and outdoor radon levels and ACH at sites 1-10 DaytimeACH Night time ACH Indoor R0 Outdoor R0
Location (h-') (h-') (Bq m-3) (Bqm-3) (R.);./(Rn)oul
Site 1 4.0 2.9 20 16 1.25
Site 2 2.9 3.6 15 14 1.07
Site 3 5.4 9.0 28 20 1.40
Site 4 1.4 1.4 31 13 2.38
Site 5 0.4 0.2 108 20 5.40
Site 6 0.2 0.2 424 71 5.97
Site 7 0.5 0.3 137 14 9.79
Site 8 2.2 I.I 62 27 2.30
Site 9 1.2 179 59 3.03
Site 10 0.4 219 45 4.87
100
~i 80
e -~
60.
.,,
<
j
4020
0
"'
"'M M
0 ,;.;
<'I <'I
-+-Rn-Cone. ( In ) --- Rn-Cone.(Out)
"' "' "'
"' "'"' "'
M M M <:"! M M M
.:..i .;.; 00
- - -
~-
r..: 0 <'I"' "'
M ,;.; <'I M .:..i "' "' "' "' "' "' "' M .;.; M 00 Time- -
<:"! M ~-
M r..:-
M 0 <'I <:"! M <'I"'
r.i M "' <:"!"'
Fig. 1. Indoor and outdoor radon level in the residential sit~I
200
~-;
a-150
e ·~
. .,,
< =
~
10050
0
"' "'
"'"'
'!"!"'
00
-
0-
<'I"' "' "'
'!"!.... "' "' "'
"'"' "' "' "'
'°
o; ~ .;.;- -
cici-+-Rn-Cone. (In) --- Rn-Cone. (Out)
"' "'
"'"' "' "' "' "' "' "' "' "' "'
'!"!
"'
'!"!"' "' "'
'!"!"'
'!"!"' "'
"' "'c::i 0
....
'°
o; ~- - "'
00 r::l 0 ,;.;'°
o;Time
Fig. 2. Indoor and outdoor radon level in the residential site 5.
elevation have in general higher air exchange rates (from 3.25 to 7.20h-1). In summer the fresh air was supplied mainly by mechanical ventilation and the amount depended on the capacity of the air-conditioning unit.
The high air exchange at some sites was probably due to wind condition. It was noticed that very strong wind movement was observed at site 3 since it was located on top of a hill and the unit was on the 10th floor. The ratios of indoor to outdoor radon levels were close to unity at site l, site 2 and site 3 where high air exchange rates were found. The strong mixing of outdoor air with indoor air has made the indoor radon level very close to the outdoor
radon level. The two sites having median air ex rates (l.40h-1 at site 4 and l.65h-1 at site 8) hr of indoor to outdoor radon levels around 2.4. Th sites with very low air exchange rates (0.20 to 0.
had been found to have very high ratio of irn outdoor radon levels (5 to 10).
From Table 2 it is noticed that outdoor rado varied from 13 to 27 Bq m-3 at seven sites and o 6 showed a very 'liigh outdoor radon level. Tl probably due to the geographical composition area. Since the indoor radon accumulates to a ve level if the air exchange rate is low, a higher rad
: ) )
~
1ge tio 1er -1) to
'els
;ite vas the :gh isk
L
600
500
~
ers
400-:~ ~
< 300
~ =
200
100
0 ....
.,..
o;
....
....
.,..
i'i N
- - Rn-Cone. (In) --- Rn-Cone. (Out)
....
....
........ ....
co co co co~
.,.. .,..
"' "' "' "' .,..
~;,; ,:..: 0
....
ti ..0 o;.... ....
i'i Nco co co co co co co co co co co co co co co co co co
.,.. .,.. .,.. .,..
"' "' .,..
~"' "' .,..
"' .,..
"' "'
~.,.. "'
;,; ,:..: ~
ti
..0 .... ~ N i'i ;,; ,:..: 0.... ti
~ o;....
i'i N ;,; ,:..:Time
Fig. 3. Indoor and outdoor radon level in the residential site 6.
300
250
100
50
0
co co DO co co co DO
""
~""
~""
~""
~
°' - ~ ;,; .... ~
All windows and doors were opened.
co DO
~
""
...
- '° ....
Time
DO
""
~ i'i DO""
N co ~ co""
;,; DO""
,:..:Fig. 4. Indoor radon level in the residential site 12.
can be expected in those tight buildings in winter when most windows are closed. The same situation can be found in some suburban areas with the residential units located close to the ground floor since most of the win- dows are closed in order to keep mosquitos or other insects away from the house.
Diurnal variations of both outdoor and indoor radon concentrations have been observed at some sites. The results obtained at site 3 and site 5 (shown in Fig. I and 2, respectively) are used to illustrate this point. The outdoor radon level peaked at dawn or early in the morn-
ing and dropped to the lowest level in the afternoon.
Diurnal variations are believed to be directly associated with atmospheric stability [4]. The atmosphere is usually very stable early in the morning due to the temperature inversion effect [S]. Outdoor radon comes mainly from soil and high radon concentration is expected at ground level. The very stable atmospheric layer in the morning hinders the radon gas from moving away into the upper layer. As sunlight heats up the ground, the actual tem- perature lapse rate in the air is larger than the dry adia- batic lapse rate of an air parcel, and thus the temperature
Table 3. Measurement result at site 11
Test Air exchange rate Indoor R. Outdoor Rn
number Test conditions
Test I All internal doors open/air-conditioning on Test 2 All internal doors open/air-conditioning off Test 3 All internal doors closed/air-conditioning on
inversion layer is destroyed. The atmospheric layer becomes unstable and the near-ground radon gas is diluted to the upper atmosphere. The outdoor radon level will decline until the radiant cooling of the surface stabilizes the atmosphere and afterwards the temperature inversion will be established.
In Fig. 2, the indoor radon level followed the outdoor trend. A time lag of about I h was noticed, and it has been· seen in other site measurements that the time Jag was reduced when the air exchange rate was higher. The measurement is similar to tests conducted by other researchers [ 6].
Measurement results at site 11
Three tests were conducted at site 11 and the results are presented in Table 3. The purpose of the tests was to investigate how the ventilation and internal door opening affected the indoor radon level. The air exchange rates were relatively low since split air-conditioning units were used in the premises. All the windows were closed in the experiment, which simulated real life practice in the premises. There was no fresh air supply in the split units and the fresh air exchange was by means of infiltration through the building fabric and gaps underneath the main door.
It was observed that with the air-conditioners on or off the ventilation rates were almost the same (comparing test I and 2) despite a small difference which might come from experimental error. The result showed that internal circulation had no influence on the ventilation rate. The result in test 3 is interesting since it was observed that with all the internal doors closed the mean air exchange rate was much lower than that in the other cases.
Meteorological conditions during the two tests were observed to be quite similar, even when no measurement was conducted. Circulation of internal air basically shows no influence on the fresh air supply rate due to mechanical ventilation, but it will affect the infiltration component.
(h-') (Bqm-3) (Bqm-3) (R.);./(J.
Q.41 193 5.3 36.5
0.49 176 5.3 33.2
0.22 246 5.3 46.5
Closing of internal doors may block the infiltn movement from one side of the premises to th1 depending on the layout and wind charact However, detailed measurement of meteorologi<
ditions was required since influences of indoor a door temperature difference, wind speed, etc. Wl important.
The ratio of the indoor radon to outdoor radl was found to be very high in all cases, from 33.2 1
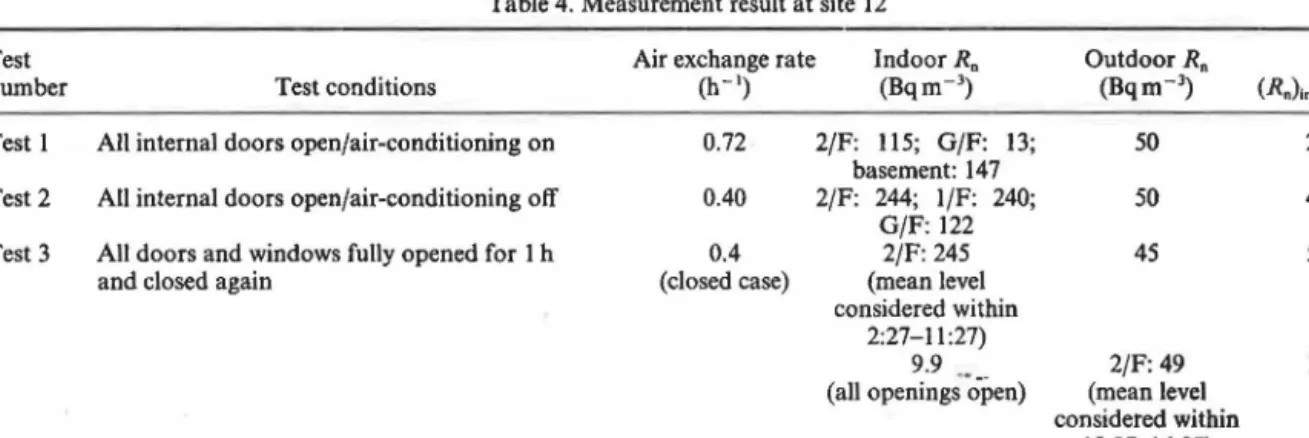
Measurement results at site 12
Three tests were conducted at site 12 to illustr change of indoor radon level with elevation and t•
how the indoor radon level was reduced when th1 and windows were fully open. The results are sh Table 4. In tests 1 and 2, all windows were closed the experiments, which again simulated the living of the occupants. Similar to the results at site ventilation rates were low since split unit air-condi were used.
In test 3, all doors and windows were closed beginning and then all fully opened for 1 h. At th time, a trace gas experiment was performed to m the air exchange rate at the moment. In extrem tilation conditions, the radon accumulation pheno1 and purging effect are shown in Fig. 4. The indoor level could be reduced to the outdoor level under ventilation conditions. However, the indoor radon also easily accumulate to a very high level in poc tilation conditions, just as at site 6.
Entirely opposite results for the indoor rador were observed in test 1 when air-conditioning unit on and in test 2 when all air-conditioning units w.
(see Table 4). In test I the indoor radon level dee with elevation, while in test 2 it increased with ele\
In test I the radon level was the highest in the bas since there was no air-conditioning unit installed and the radon emanation was strong from the co
Table 4. Measurement result at site 12
Test Air exchange rate Indoor R. Outdoor R.
number Test conditions (h-') (Bqm-3) (Bqm-3) (R.)1.1
Test l All internal doors open/air-conditioning on 0.72 2/F: 115; G/F: 13; 50 2 basement: 147
Test 2 All internal doors open/air-conditioning off 0.40 2/F: 244; l/F: 240; 50 4 G/F: 122
Test 3 All doors and windows fully opened for 1 h 0.4 2/F: 245 45 5
and closed again (closed case) (mean level
considered within 2:27-11 :27)
9.9 2/F: 49 I.
(all openings-open) (mean level considered within
12:27-14:27)
air 1er, ics.
)n- ut-
!so
vel .. 5.
he dy irs in ng its he
!rS
he ne re n- m m ig ld
11-
el
.1.
it .e
50 45
•
"ii
~ 40
= •
] 0
..
35•
~
s
0 30]
25=
] 0
..
20~
.!3 15....
0'+:! 0
~ 10
•
5
• ••
• ••• •• • •
0
0 2 3 4 5 6 7 8 9 10
Air Exchange Rate (hr"1)
Fig. 5. Variation of indoor radon/outdoor radon level ratio with air exchange rate.
base. The air circulation was better at higher floors since air-conditioning units were on. In test 2 the indoor tem- perature (32.3°C) on the day was slightly higher than the outdoor temperature (31.3°C) and the stack effect brought radon accumulation to the top floor.
Critical ventilation rate for radon mitigation
The ratio of indoor to outdoor radon level from Tables 1-4 was plotted against the air exchange rate and the result is presented in Fig. 5. A very clear curve is observed and the ratio decreased with air exchange rate. At all the sites the effect of radon emanation from building materials varied, but the difference might be small when compared with the effect of ventilation. The variation of radon level with air exchange rate can be illustrated by the following equation:
dC L,EjAj q(Co-C)
dt=
-J.C+-v-+ V ' (l)Since J. « q/V, the steady state solution becomes L,EjAj
C(oo) = C0
+--.
q
(2)
(3) In equation (3) it can be seen that if a building is under strong ventilation condition, the indoor radon level is approximately the same as the outdoor radon level. The cn:ii.ssion term L,Ej~ can be shown to be related to the
1111tial radon growth curve at the premises if C; is assumed
lo be close to C0•
Differentiating equation (2) with respect to time and taking t to approach zero, the following equation is found:
Then
equation (5) was substituted into equation (3):
or
C(oo) = C0
+-'
MVq
C(oo) M;
-C:-
= l+
C0(ACH)"(4)
(5)
(6) This equation is only valid when the change of ACH over time is small. If the ACH is large enough, the ratio is close to unity as observed in Fig. 5. The problem is that we need to know how large the ACH is in order to satisfy this unity ratio condition. For the sites inves- tigated, M; varied from 11to18 Bqm-3h-1 and C0 varied from 13 to 71 Bqm-3• M; was estimated in separate tests where the windows were opened at the beginning to allow thorough mixing of indoor air and outdoor air so that C0 = C;, and then the windows were closed to allow for radon growth inside the room. The purpose of these separate tests was to find the radon emanation rates of the materials in the rooms. M; represents the initial slope of the radon growth curve at each site in the separate tests. The graphs for the radon growth are not shown in this paper. Based on these conditions, if ACH is larger than 3h-1, and taking the mean values of ACH and M;
in the ranges given, the indoor radon to outdoor radon ratio is only 10% higher than unity.
In Fig. 5 it is observed that a critical ventilation rate exists after which the indoor radon level is close to the outdoor radon level. The observation agrees with equa- tion (6). The critical ventilation rate for this group of buildings was found to be around 3 h-1• The exact value depends on the building envelope design and building materials used in the interior, as well as other corridor flow patterns, etc. However, the concept seems to be useful as the building services engineer may develop a rule of thumb based on the result by picking up a certain ventilation limit so that radon mitigation can be carried out effectively. The ventilation rate has been shown to be an important factor in reducing indoor radon level, not only from the result of this study, but also from other research work [7]. As the outdoor radon level indicates the minimum indoor radon level that the premises can sustain, the critical ventilation rate shown in this study provides a preliminary guideline so that the minimum indoor radon level can be achieved if the ventilation rate is kept above the critical value. Future research work is being conducted to expand the database so that a more accurate critical ventilation rate can be defined.
CONCLUSION
This paper reports indoor and outdoor radon J, 12 residential sites in Hong Kong. Large variation exchange rate have been observed at these sites. Tt of indoor to outdoor radon level has been found t high as 46.5 when the air exchange rate is around ( The indoor radon level was close to the outdoor level when the air exchange rate was higher thafl Diurnal variation caused by the temperature in' effect has been observed in some sites where the level peaked at dawn and reached its lowest valm afternoon. It has been found that the ventilati<
plays a very important role in controlling indoor concentration. However, the result is incomplete v information on how much the building materia tribute to the indoor radon level. Recently, a small her has been built in our laboratory and a comprd study on the radon emanation rates of different b.
materials used in Hong Kong is being carried out
Acknowledgement-This project is funded by the Hon:
Polytechnic University, Research Grant No. 340/855.
REFERENCES
I. Tso, M. W., Ng, C. Y. and Leung, J. K. C., Radon release from building materials in Hong Kong.
Health Physics, 1994, 67(4), 378-384.
2. Lao K. Q., Co11tro/ling !11door Radon, Measurement, Mitigation, and Prevention. Van Nostrand Reinhold, 1990.
3. Niton Corporation Electronics Division, Rad7 Radon Detector, Owner's Manual, Version 2.1, 1992.
4. Lloyd, L. L., Evaluatio11 of Radon Resources and Phosphate Slog i11 Butte, Montana. Montana Depart- ment of Health and Environmental Sciences, U.S. EPA Contract No. 68·01-6100, 1983.
5. Seinfeld, J. H., Atmospheric Chemistry and Physics of Air Pollution. Wiley Interscience, 1986.
6. Toohey, R. E., Essling, M. A., Rundo, J. and Hcngde, W., Some measurements of the equilibrium factor for Rn-222 daughters in houses. Hea/1/J Physics, 1987, 53(1), 89-91.
7. lkeda, K., Yoshizawa, S., Komine, H., Kaminaka, S. and Abe, S., Experimental studies on the indoor radon and radon daughter concentrations build-up in Japanese houses. In Proceedings of 4th International Conference on Indoor Air Quality and Climate, Vol. 2, 1987, pp. 403-408 .