Copyright © 2018 The Korean Society for Bone and Mineral Research
This is an Open Access article distributed under the terms of the Creative Commons Attribution Non-Commercial Li- cense (http://creativecommons.org/licenses/by-nc/4.0/) which permits unrestricted non-commercial use, distribu- tion, and reproduction in any medium, provided the original work is properly cited.
Agreement between the Turkey Guidelines and the Fracture Risk Assessment Tool®-based Intervention Threshold
Ahmet Imerci, Nevres Hurriyet Aydogan, Kursad Tosun
Department of Orthopaedics and Traumatology, Muğla Sıtkı Koçman University, Faculty of Medicine, Muğla, Turkey
Background: The aim of this study was to evaluate the agreement between the frac- ture-risk assessment tool (FRAX®)-based intervention strategy in Turkey and the recom- mendations published in the Healthcare Practices Statement (HPS). Methods: This de- scriptive cross-sectional study included individuals aged 40 to 90 years who were previ- ously diagnosed as having osteoporosis but had not received any treatment. The inter- vention thresholds recommended by the National Osteoporosis Foundation for treat- ment were used. The criteria necessary for the start of administration of pharmacological agents in osteoporosis treatment were evaluated on the basis of the HPS guidelines. Re- sults: Of the 1,255 patients evaluated, 161 (12.8%) were male and 1,094 (87.2%) were female. In the evaluation, according to HPS, treatment was recommended for 783 pa- tients (62.4%; HPS+) and not recommended for 472 (37.6%; HPS-). Of the 783 HPS+ pa- tients, 391 (49.9%) were FRAX+, and of the 472 HPS- patients, 449 (95.1%) were FRAX−.
A statistically significant difference was observed between the treatment recommenda- tions of HPS and FRAX® (P<0.001). In the age group of 75 to 90 years, excellent agree- ment was found between the two strategies (Gwet’s agreement coefficient 1=0.94). As age increased, the agreement between the two treatment strategies also increased.
Conclusions: The FRAX® model has different treatment recommendation rates from the HPS. The agreement between the two is at a minimal level. However, as age increased, so did the agreement between the FRAX® and the HPS treatment recommendations. In the recommendation to start pharmacological treatment primarily based on age, non- medical interventions that preserve bone density should be evaluated.
Key Words: Bone density, Osteoporosis, Osteoporotic fractures, Risk assessment, Turkey
INTRODUCTION
Osteoporosis is a skeletal disorder characterized by bone strength with a predis- position to fracture risk. The property of being able to accurately measure the risk of fracture is of critical importance in determining the appropriate cost thresholds for intervention.[1] Different guidelines have been developed in different coun- tries to identify treatment thresholds.[2-8] However, there are noticeable differ- ences between the approaches recommended by these guidelines.[9,10]
The fracture-risk assessment tool (FRAX®) system was introduced by the World Health Organization (WHO) Collaboration Centre in Sheffield, United Kingdom, to Corresponding author
Ahmet Imerci
Department of Orthopaedics and
Traumatology, Muğla Sıtkı Koçman University, Faculty of Medicine, Kötekli Mahallesi, 48000 Kötekli/Muğla, Turkey
Tel: +90-506-893-5276 Fax: +90-506-893-5276
E-mail: [email protected] Received: December 28, 2017 Revised: March 21, 2018 Accepted: April 16, 2018
No potential conflict of interest relevant to this article was reported.
estimate the 10-year hip and major osteoporotic fracture risk (hip, clinical spine, distal forearm, and proximal humer- us).[11] The FRAX® tool calculates the 10-year fracture risk with and without femoral neck (FN) bone mineral density (BMD) by combining 7 clinical risk factors (pre-fracture fra- gility, hip fracture of a parent, cigarette smoking, use of systemic glucocorticoids, excessive alcohol intake, body mass index (BMI), rheumatoid arthritis (RA) and other sec- ondary causes) added to age and gender.[11,12] To stan- dardize FRAX® scores, the National Osteoporosis Founda- tion (NOF) defined intervention threshold values by stating that pharmacological treatment should be started for ma- jor osteoporotic fractures at ≥20% and for hip fractures at
≥3%.[12]
According to the most recent Healthcare Practices State- ment (HPS) guidelines published in 2013 by the Turkish Ministry of Health, the criteria for starting pharmacological agent treatment for osteoporosis are stated as follows:[13]
These agents are prescribed (together with a health re- port indicating primary disease):
1) In patients with an osteoporotic fracture when any 1 of the T-values is ≤-1 in the FN or the total hip or the lumbar total (L1-4) in the posteroanterior (PA) BMD measurements taken from the lumbar region,
2) In patients without osteoporotic fractures aged ≥65 years when any 1 of the T-values is ≤-2.5 in the FN or the total hip or the lumbar total (L1-4) in the PA BMD measurements taken from the lumbar region,
3) In patients without osteoporotic fractures aged <65 years when any 1 of the T-values is ≤-3 in the FN or the total hip or the lumbar total (L1-4) in the PA BMD measurements taken from the lumbar region,
4) In patients with RA, celiac disease, chronic inflamma- tory intestinal disease (Crohn’s disease or ulcerative colitis), ankylosing spondylitis, hyperthyroidism, hy- pogonadism, hypopituitarism, anorexia nervosa, chro- nic obstructive pulmonary disease, type 1 diabetes, Cushing syndrome, and in those using long-term (>3 months) systemic corticosteroids of >5 mg/day for hyperparathyroidism, those receiving cancer treatment and patients who have undergone organ transplanta- tion, and in secondary developing osteoporosis, when any 1 of the T-values is ≤-1 in the FN or the total hip or the lumbar total (L1-4) in the PA BMD measurements taken from the lumbar region.
In patients aged ≥75 years, it is not necessary to mea- sure BMD when osteoporotic hip fracture is reported.[13]
The aim of the current study was to evaluate the agree- ment between the FRAX® treatment recommendations and those in the HPS treatment guidelines for osteoporosis in Turkey and to determine the factors affecting agree- ment. It was investigated whether the HPS evaluation had better predictive value than FRAX® in the identification of patients to be referred for treatment. The study also aimed to determine the optimal treatment by comparing two dif- ferent criteria.
METHODS
Approval for the study was granted by the Ethics Com- mittee of Ataturk University. Informed consent was ob- tained from all the study participants. The study sample comprised 1,255 patients aged over 40 years who under- went dual energy X-ray absorptiometry (DXA) at Erzurum Palandoken State Hospital in 2013 and had not previously received osteoporosis treatment. The BMD measurements were taken with a DXA (QDR 2000; Hologic Inc., Bedford, MA, USA) machine. PA lumbar spine (L1-4), total hip and FN measurements were taken. Calibration of the machine, the tests, controls and phantom measurements were rou- tinely made by certified technicians. The height of each patient was measured, and they were weighed without outer clothing and then the DXA scans were taken. BMD values were evaluated with T-scores determined according to the peak young adult density value. According to the WHO classification, patients with a T-score of ≤-2.5 were accepted as osteoporotic, those with scores of -1 to -2.5 as osteopenic and those with a score of >-1 as normal.[14]
Patients were excluded if they had previously received phar- macological treatment for osteoporosis.
1. Fracture risk evaluation tool
In 2008, WHO Scientific Group [11] conducted a study to determine the 10-year fracture risk. Taking the FN T-score and clinical risk factors into consideration, it is possible to calculate the 10-year femur fracture and any major osteo- porotic fracture risk with FRAX®. The 10-year fracture risk can be automatically calculated using FRAX® scoring. There- fore, for the evaluation of fracture risk according to FRAX®, the required data was recorded on a questionnaire admin-
istered face-to face. These data included age, gender, height, weight, previous fracture, hip fracture of a parent, cigarette smoking, glucocorticoid treatment, RA, secondary osteo- porosis, alcohol intake and related clinical data. The web- based algorithm at http://www.shef.ac.uk/FRAX® was ap- plied as the FRAX® algorithm (version 3.6) adapted for Tur- key. In this way, by entering and not entering the FN-T-score value, 4 different scores were obtained for major osteopo- rotic fracture risk and hip fracture risk.
According to the NOF criteria, a patient with FRAX® score of ≥20% for major osteoporotic fracture or ≥3% for hip fracture is defined as high risk and these values are accept- ed as the its.[12]
According to the most recent HPS revised in 2013 by the Turkish Healthcare Organization, the treatment threshold in osteoporosis treatment is defined according to the T-scores, pathological fracture, secondary osteoporosis causes and age (Fig. 1).
2. Statistical analysis
The values used in the study were summarized as statis- tics of the bone mass indexes of the patients and were stat- ed as mean±standard deviation. In the comparison of the patients recommended and not recommended for treat-
ment according to the Turkish HPS guidelines, the Welch t- test was applied. To determine whether or not there was a statistically significant difference between HPS and FRAX®, the χ2 test and the Fisher’s exact test were applied. The lev- el of agreement between the HPS and FRAX® was calculat- ed with Gwet’s agreement coefficient 1 (AC1) statistic.[15]
A confidence interval of 95% was given. The relationship between the AC1 statistic and the level of agreement is ex- plained as <0 "none"; 0 to 0.2, "minimal"; 0.2 to 0.4,
"weak"; 0.4 to 0.6, "moderate"; 0.6 to 0.8, "strong "; and 0.8 to 1.0, "almost perfect" agreement. R program (The R Foundation for Statistical Computing, Vienna, Austria) was used in all the statistical analyses. All P-values of less than 0.05 were considered to indicate statistical significance.
RESULTS
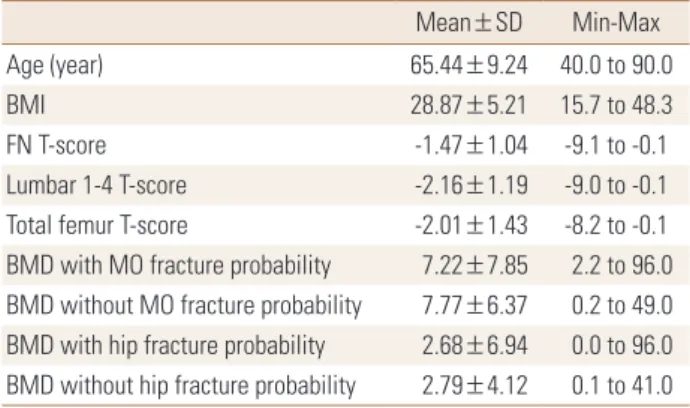
A total of 1,255 patients were included in the study, com- prising 161 (12.8%) males and 1,094 (87.2%) females. The mean age of the patients was 65.44±9.24 years, and mean BMI was 28.87±5.21 (Table 1).
In FRAX®, treatment was recommended for 414 patients (33.0%; FRAX+), and not recommended for 841 (67.0%;
FRAX-). In the evaluation according to HPS, treatment was Fig. 1. Defining the need for initiation of treatment according to the Turkish Healthcare Practices Statement guidelines for osteoporosis. BMD, bone mineral density.
Age
≥75 years
TREAT
With an osteoporotic fracture at baseline Without an osteoporotic fracture at baseline
∙ BMD T-score ≤-1 (total hip,
femoral neck, lumbar spine) ∙ ≥65 years
∙ BMD T-score ≤-2.5 (total hip, femoral neck, lumbar spine)
∙ <65 years
∙ BMD T-score ≤-3 (total hip, femoral neck, lumbar spine)
∙ Rheumatoid arthritis, celiac disease, chronic inflammatory bowel disease (crohn’s disease or ulcerative colitis), ankylosing spondylitis, hy- perthyroidism, hypogonadism, hypopituitarism, anorexia nervosa, chronic obstructive pulmonary disease, type I diabetes, cushing’s syndrome and primary hyperparathyroidism, patients who re- ceived long-term (at least 3 months) and >5 mg/
day systemic corticosteroids, received cancer treatment or organ transplants
∙ BMD T-score ≤-1 (total hip, femoral neck, lum- bar spine)
<75 years BMD Clinical evaluation
recommended for 783 (62.4%; HPS+), and not recommend- ed for 472 (37.6%; HPS-). Of the 783 HPS+ patients, 391 (49.9%) were FRAX+ and of the 472 HPS- patients, 449 (95.1%) were FRAX-. A statistically significant difference was determined between the treatment recommendations of HPS and FRAX® for all age groups (P<0.001; χ2 test).
This can also be stated as, of the 414 FRAX+ patients, 391 (94.4%) were HPS+, and of the 841 FRAX- patients, 449 (53.4%) were HPS- (Table 2). Thus 94% of the patients rec- ommended for treatment in FRAX® were also recommend- ed for treatment in HPS. Of the patients not recommended for treatment in FRAX®, only 53% were not recommended
for treatment in HPS.
When the patients were evaluated as a whole, disregard- ing age groups, the level of agreement between HPS and FRAX® was weak (Gwet’s AC1=0.34; 95% confidence inter- val [CI], 0.29-0.39). In the 75 to 90 years age group, there was seen to be almost perfect agreement between HPS and FRAX® (Gwet’s AC1=0.94; 95% CI, 0.90-0.97). There were 220 patients in this age group and all were HPS+. Of these 220 patients, 207 (94.1%) were FRAX+. The 13 pa- tients who were not recommended for treatment were all males and the mean FN T-score was -0.98. In the 65 to 74 years age group, there was seen to be minimal agreement between HPS and FRAX® (Gwet’s AC1=0.21; 95% CI, 0.11- 0.30) (Table 3).
The major osteoporotic fracture risk value was mean Table 1. Study population baseline characteristics during bone min-
eral density measurement
Mean±SD Min-Max
Age (year) 65.44±9.24 40.0 to 90.0
BMI 28.87±5.21 15.7 to 48.3
FN T-score -1.47±1.04 -9.1 to -0.1
Lumbar 1-4 T-score -2.16±1.19 -9.0 to -0.1
Total femur T-score -2.01±1.43 -8.2 to -0.1 BMD with MO fracture probability 7.22±7.85 2.2 to 96.0 BMD without MO fracture probability 7.77±6.37 0.2 to 49.0 BMD with hip fracture probability 2.68±6.94 0.0 to 96.0 BMD without hip fracture probability 2.79±4.12 0.1 to 41.0 BMI, body mass index; FN, femoral neck; BMD, bone mineral density;
MO, major osteoporotic; SD, standard deviation.
Table 2. Distribution of patients according to treatment recommen- dations calculated using fracture-risk assessment tool® and Turkey Healthcare Practices Statement guideline
FRAX score Total
Treatment (+) Treatment (-) HPS criteria
Treatment (+) 391 (94.4%) 392 (46.6%) 783 (62.4%) Treatment (-) 23 (5.6%) 449 (53.4%) 472 (37.6%)
Total 414 (33.0%) 841 (67.0%) 1,255
FRAX, fracture-risk assessment tool; HPS, Healthcare Practices State- ment.
Table 3. Differences and agreement between Healthcare Practices Statement and fracture-risk assessment tool according to age groups
Age (year) HPS + HPS − P-value Gwet’s AC1 (95% CI)
40-54 (n=154) <0.001 0.59 (0.46-0.72)
FRAX + 10 (6.5%) 2 (1.3%)
FRAX − 41 (26.6%) 101 (65.6%)
55-64 (n=448) <0.001 0.29 (0.20-0.39)
FRAX + 35 (7.8%) 4 (0.9%)
FRAX − 183 (40.8%) 226 (50.4%)
65-74 (n=433) <0.001 0.21 (0.11-0.30)
FRAX + 139 (32.1%) 17 (3.9%)
FRAX − 155 (35.8%) 122 (28.2%)
75-90 (n=220) <0.001 0.94 (0.90-0.97)
FRAX + 207 (94.1%) 0 (0.0%)
FRAX − 13 (5.9%) 0 (0.0%)
Total (n=1,225) <0.001 0.34 (0.29-0.39)
FRAX + 391 (31.9%) 23 (1.9%)
FRAX − 392 (32.0%) 449 (36.7%)
The data is presented as number (%).
FRAX, fracture-risk assessment tool; HPS, Healthcare Practices Statement; AC1, agreement coefficient 1; CI, confidence interval.
7.22±7.85 with DXA, and 7.77±6.37 without DXA. The hip fracture risk was mean 2.68±6.94 with DXA, and 2.79±
4.12 without DXA (Table 1). The mean BMI of the HPS+ group (28.33±5.30) was lower than that of the HPS- group (29.76
±4.95) (P<0.001; Welch t-test). Of the 783 HPS+ patients, 697 (89.0%) were female, and of the 472 HPS- patients, 397 (84.1%) were female. No statistically significant differ- ence was determined between the HPS+ and HPS- groups in respect of gender (P=0.012; χ2 test).
DISCUSSION
According to the results of this community-based study, the agreement between the HPS treatment guidelines for osteoporosis and the FRAX® scores calculated with and without BMD was at a moderate level. The agreement be- tween HPS and FRAX® according to the treatment thresh- old was 94.4%. The agreement between the two systems in patients not recommended for treatment was 53.3%.
According to the NOF guideline values, osteoporosis thera- py is not recommended for a significant proportion of the population, whether FRAX® is calculated with or without BMD. However, the recommendation rates for osteoporo- sis treatment in the elderly (≥75 years) is very high. These rates are lower compared to the HPS criteria.
When compared with the decision-making strategy based on the current application of HPS, FRAX® was seen to have lowered the intervention threshold in the cohort to 34%.
The NOF overall fracture risk thresholds in patients aged
≥75 years old (3%/20%) were exceeded in most patients regardless of risk factors other than age, and almost per- fect agreement was seen between the two strategies in this elderly age group (Gwet’s AC1=0.94; 95% CI, 0.90-0.97).
There were 220 patients in this age group, all were HPS+
and 207 (94.1%) were FRAX+. The 13 patients who were not recommended treatment were all males with a mean FN T-score of -0.98. This difference can be considered to be due to the high FN T-score. The FRAX® approach requires BMD measurement for the majority of elderly females and is recommended to be applied to a greater population than HPS. This renders FRAX® implementation more expensive than HPS. However, there is the possibility of reducing the societal burden of fractures. These analyses could help cli- nicians and policymakers make more knowledgeable deci- sions.
Similar to the current study, Goldshtein et al. [9] deter- mined that the application of the NOF guidelines in females aged ≥75 years required particular care and the absolute fracture risk was exceeded by almost all the females on the basis of age without consideration of other risk factors.
Changes in the treatment strategies of males aged >75 years and postmenopausal females could increase the cur- rent agreement. One of the weaknesses of the Turkish gui- delines is the recommendation to start treatment for all patients over the age of 75 years.
In the 55 to 64 years and 65 to 74 years age groups, there was minimal agreement. The disagreement was generally that while HPS recommended treatment for patients with a T-score ≤-3 in the 55 to 64 years age group and for pa- tients with a T-score ≤-2.5 in the 65 to 74 years age group, these patients were not recommended for treatment in FRAX® (Gwet’s AC1=0.29 and 0.21, respectively). The rea- son for this was that only 10 (6.5%) of the 155 HPS+ FRAX- patients in the 65 to 74 years age group had a FN T-score
≤-2.5. Moreover, in this age group, there were 103 (66.5%) patients with L1-4 T-score ≤-2.5, and 98 (63.2%) patients with a total hip T-score ≤-2.5. This could be related to only using the FN T-score in the FRAX® calculation or that the threshold of the Turkish FRAX® model has not been ana- lyzed.
In the 40 to 54 years age group, agreement was relative- ly higher (Gwet’s AC1=0.59). This can be associated with the high percentage (65.6%) of patients not recommend- ed for treatment in this age group in both strategies. When all the age groups were examined, the treatment recom- mendations of the HPS criteria were found to be higher. In the comparison of different treatment strategies in litera- ture, differences between treatment recommendations have been determined according to age groups and gen- der.[9,10,16] Similarly in the current study, a statistically sig- nificant difference was found between the HPS and FRAX®
criteria in all age groups (P<0.001; χ2 test).
Leslie et al.[17] reported that both the major osteopo- rotic fracture risk and the hip fracture risk was greater in females than males, which was similar to the results of the current study. Of the 783 HPS+ patients, 697 (89.0%) were female and of the 472 HPS- patients, 397 (84.1%) were fe- male. A statistically significant difference was determined between HPS+ and HPS- in respect of gender (P=0.012; χ2 test). As expected, probability was higher in females than
in males.
Järvinen et al.[18] stated that the pharmacotherapy indi- cations of the FRAX®-based guidelines had been expanded in an inappropriate way and this caused concerns of over- treatment. While the findings of the current study do not confirm this expansion, when compared with current agree- ment, it could be an indication for revision of the FRAX® cal- culation according to the country. That the value of FRAX®
in therapeutic intervention in Turkish settings is thought to be cost-effective can be associated with it not yet having been adapted according to the repayment and healthcare application perspective. It has been reported that osteo- porosis treatment in Greece became cost-effective when the absolute 10-year probability of hip and major osteopo- rotic fractures in both genders aged <75 years reached 2.5% and 10% respectively and the intervention thresh- olds recommended in older cases increased to a probabili- ty level of 5% for hip fractures and 15% for major osteopo- rotic fractures.[19] According to a cost-effective analysis in Switzerland, this rate has been reported as 15% for both males and females (lower than NOF).[20] In a 2008 study in Japan by Fujiwara et al.[21], intervention thresholds were published specific to Japan, based on the FRAX® model.
The age-specific major osteoporotic fracture risk treatment threshold varied from 5% at age 50 years to 20% at age 80 years. In a study in Korea, fracture probabilities in study participants aged 70 years or older were remarkably lower with the Korean FRAX® model than when the Japanese FRAX model was applied.[22] Tuzun et al.[23] reported that a cost- effective analysis for intervention thresholds was necessary in Turkey.
The guidelines in Hong Kong, Japan and Taiwan have in- cluded FRAX in the treatments and these recommend treat- ment for subjects without other indications for treatment (such as prior fractures or BMD below a cut-off) if their FRAX value is above a fixed value regardless of age.[24] While the Korea guidelines offer criteria for treatment of patients aged over 50 years, who have had a prior fracture and/or have a BMD value of -2.5, FRAX was not taken into consid- eration.[24,25] Min et al.[22] found a 50% lower 10-year fracture possibility in the FRAX Korean model than in the Japanese model and determined the difference to be sta- tistically significant. Taiwanese guidelines do not differen- tiate between osteoporosis and osteopenia but rely on the FRAX treatment threshold, which resulted in a lower per-
centage of subjects being treated. Nonetheless, the per- centage of fracture subjects who would be indicated for treatment and the percentage of non-fractured subjects offered reassurance were similar.[16] Cheung et al.[16] re- ported that the treatment strategies of the NOF and Tai- wan guidelines for the protection against fracture in Chi- nese postmenopausal women showed a poor clinical utili- ty index.
The presence of only clinical risk factors in the Turkish guidelines as evaluation for treatment indication could ex- plain the over-treatment.[13] As in the Korean guidelines, not considering the clinical risk factors or treatment strate- gies depending only on T-scores could cause treatment to be overlooked.[24] These points can be evaluated as a weak- ness of the guidelines.
One of the osteoporosis risk factors is the body structure.
[26] Pınar et al.[27] found no significant correlation between BMI and osteoporosis in a study of females aged >45 years.
Similarly, Kutlu et al.[28] also reported no statistically sig- nificant relationship between osteoporosis and BMI. In the current study, there was no statistically significant relation- ship between BMI and the treatment recommendations of HPS criteria (P<0.001). However, in a study by Robitaille et al.[29], osteoporosis was determined in 11% of those with BMI <18.5 and in 7.5% of those with ≥30. Burger et al.[30]
showed a strong relationship between increased BMI and high bone density in a prospective study of males aged
>50 years.
This study has several limitations. First, there are some limitations associated with the FRAX® model, such as the absence of some important fracture risk factors (falls, bone cycle, mode of dressing, and lifestyle), the limitation of the BMD entry to FN BMD, that the fracture risk could be over or under-estimated, and it is not used in patients who have been treated. A further limitation was that although there is a higher incidence of osteoporosis in female patients, the number of male patients was low.
The FRAX® model has different treatment recommenda- tion rates from HPS. The agreement between them is at a minimal level. The integration and interpretation of FRAX®- based risk evaluation in this condition is reflected in rou- tine clinical systems and may help physicians in prediction.
The potential effect of the current HPS treatment guide- lines in Turkey is significantly high in patients aged ≥75 years. In the recommendation to start pharmacological
treatment which is primarily based on age, there should be evaluation of non-medical interventions for males with preserved bone density and these should be taken into consideration. Therefore, it must not be forgotten that pro- tective and therapeutic algorithms based on age alone can be misleading and patient selection should be applied care- fully.
REFERENCES
1. El-Hajj Fuleihan G, Chakhtoura M, Cauley JA, et al. World- wide fracture prediction. J Clin Densitom 2017;20:397-424.
2. Cosman F, de Beur SJ, LeBoff MS, et al. Clinician’s guide to prevention and treatment of osteoporosis. Osteoporos Int 2014;25:2359-81.
3. Compston J, Cooper A, Cooper C, et al. UK clinical guide- line for the prevention and treatment of osteoporosis. Arch Osteoporos 2017;12:43.
4. Kanis JA, McCloskey EV, Johansson H, et al. European guid- ance for the diagnosis and management of osteoporosis in postmenopausal women. Osteoporos Int 2013;24:23- 57.
5. Lekamwasam S. Sri Lankan FRAX model and country-spe- cific intervention thresholds. Arch Osteoporos 2013;8:148.
6. Papaioannou A, Morin S, Cheung AM, et al. 2010 clinical practice guidelines for the diagnosis and management of osteoporosis in Canada: summary. CMAJ 2010;182:1864- 73.
7. Orimo H, Nakamura T, Hosoi T, et al. Japanese 2011 guide- lines for prevention and treatment of osteoporosis-execu- tive summary. Arch Osteoporos 2012;7:3-20.
8. Body JJ, Bergmann P, Boonen S, et al. Evidence-based gui- delines for the pharmacological treatment of postmeno- pausal osteoporosis: a consensus document by the Bel- gian Bone Club. Osteoporos Int 2010;21:1657-80.
9. Goldshtein I, Ish-Shalom S, Leshno M. Impact of FRAX- based osteoporosis intervention using real world data.
Bone 2017;103:318-24.
10. Bolland MJ, Grey A. Disparate outcomes from applying U.K.
and U.S. osteoporosis treatment guidelines. J Clin Endo- crinol Metab 2010;95:1856-60.
11. WHO Scientific Group. Assessment of osteoporosis at the primary health-care level. Technical report. Sheffield, UK:
WHO Collaborating Centre, University of Sheffield; 2008.
12. Kanis JA, Harvey NC, Johansson H, et al. FRAX update. J
Clin Densitom 2017;20:360-7.
13. Healthcare Practices Statement. Turkey Guidelines for Os- teoporosis Treatment. 2013 [cited by 2018 Jan 3]. Available from: http://www.resmigazete.gov.tr/default.aspx 14. Jain RK, Vokes T. Dual-energy X-ray absorptiometry. J Clin
Densitom 2017;20:291-303.
15. Gwet KL. Computing inter-rater reliability and its variance in the presence of high agreement. Br J Math Stat Psychol 2008;61:29-48.
16. Cheung E, Kung AW, Tan KC. Outcomes of applying the NOF, NOGG and Taiwanese guidelines to a cohort of Chi- nese early postmenopausal women. Clin Endocrinol (Oxf) 2014;80:200-7.
17. Leslie WD, Morin S, Lix LM, et al. Fracture risk assessment without bone density measurement in routine clinical prac- tice. Osteoporos Int 2012;23:75-85.
18. Järvinen TL, Jokihaara J, Guy P, et al. Conflicts at the heart of the FRAX tool. CMAJ 2014;186:165-7.
19. Makras P, Athanasakis K, Boubouchairopoulou N, et al. Cost- effective osteoporosis treatment thresholds in Greece. Os- teoporos Int 2015;26:1949-57.
20. Lippuner K, Johansson H, Borgström F, et al. Cost-effective intervention thresholds against osteoporotic fractures based on FRAX(R) in Switzerland. Osteoporos Int 2012;23:
2579-89.
21. Fujiwara S, Nakamura T, Orimo H, et al. Development and application of a Japanese model of the WHO fracture risk assessment tool (FRAX). Osteoporos Int 2008;19:429-35.
22. Min YK, Lee DY, Park YS, et al. A FRAX experience in Korea:
fracture risk probabilities with a country-specific versus a surrogate model. J Bone Metab 2015;22:113-8.
23. Tuzun S, Eskiyurt N, Akarirmak U, et al. The impact of a FRAX-based intervention threshold in Turkey: the FRAX- TURK study. Arch Osteoporos 2012;7:229-35.
24. Cheung EYN, Tan KCB, Cheung CL, et al. Osteoporosis in East Asia: Current issues in assessment and management.
Osteoporos Sarcopenia 2016;2:118-33.
25. Korean Health Insurance Review Agency. General guide- line of pharmacologic intervention for osteoporosis. 2010 [cited by 2018 Feb 26]. Available from: http://www.hira.
or.kr/eng/index.html
26. Demir A, Kutlu R, Çivi S. Assessment of 10-year major os- teoporotic and femur fracture risk of postmenopausal wom- en using FRAX®. Turk J Phys Med Rehabil 2014;60:S11-8.
27. Pınar G, Pınar T, Doğan N, et al. Osteoporosis risk factors in
the women over 45-years old. Dicle Med J 2009;36:258-66.
28. Kutlu R, Çivi S, Pamuk G. Frequency of osteoporosis and calculation of 10-years fracture probability by using FRAXTM tool in postmenopausal women. Turk J Phys Med Rehabil 2012;58:126-35.
29. Robitaille J, Yoon PW, Moore CA, et al. Prevalence, family
history, and prevention of reported osteoporosis in U.S.
women. Am J Prev Med 2008;35:47-54.
30. Burger H, de Laet CE, van Daele PL, et al. Risk factors for increased bone loss in an elderly population: the Rotter- dam Study. Am J Epidemiol 1998;147:871-9.