ABSTRACT
Currently, neoadjuvant chemotherapy is a standard therapeutic strategy for breast cancer, as it can provide timely and individualized chemo-sensitivity information and is beneficial for custom-designing subsequent treatment strategies. To accurately select candidates for neoadjuvant chemotherapy, the association between various immunohistochemical biomarkers of primary disease and tumor response to neoadjuvant chemotherapy has been investigated, and results have shown that certain pathological indicators evaluated after neoadjuvant chemotherapy are associated with long-term prognosis. The Food and Drug Administration (FDA) has recommended that complete pathological response can be used as a surrogate endpoint for neoadjuvant chemotherapy, which is related to better prognosis.
Considering that residual tumor persists in the majority of patients after neoadjuvant chemotherapy, the value of various pathological indicators of residual disease in predicting the long-term outcomes is being extensively investigated. This review summarizes and compares various predictive and prognostic indicators for patients who have received neoadjuvant chemotherapy, and analyzes their efficacy in different breast cancer subtypes.
Keywords: Biomarkers; Breast neoplasms; Neoadjuvant therapy; Pathology; Survival
INTRODUCTION
Breast cancer (BC) is one of the most common diagnosed malignant diseases that severely threatens women's life worldwide [1]. Neoadjuvant chemotherapy (NACT) has been accepted as a standard therapeutic strategy for patients with locally advanced BC and inflammatory BC, as it reduces tumor burden prior to surgery, and improves the success rates of operation and the chances of breast conservation surgery [2,3]. Currently, pathological assessment of breast tissue and metastatic lymph nodes after surgery is the main approach for evaluating the treatment response of patients to NACT, which is considered the gold standard.
Considering the large number of studies showing that achievement of pathological complete response (pCR) was clearly predictive of improved outcome with a lower probability of recurrence and death [4,5], the Food and Drug Administration (FDA) suggested pCR as
Review Article
Received: May 25, 2019 Accepted: Oct 11, 2019 Correspondence to Yingying Xu
Department of Breast Surgery, the First Affiliated Hospital of China Medical University, 155 North Nanjing Street, Shenyang, Liaoning Province 110001, China.
E-mail: [email protected]
*Xinyan Li and Mozhi Wang contributed equally to this work.
© 2019 Korean Breast Cancer Society This is an Open Access article distributed under the terms of the Creative Commons Attribution Non-Commercial License (https://
creativecommons.org/licenses/by-nc/4.0/) which permits unrestricted non-commercial use, distribution, and reproduction in any medium, provided the original work is properly cited.
ORCID iDs Xinyan Li
https://orcid.org/0000-0003-0710-0293 Mozhi Wang
https://orcid.org/0000-0002-0297-2052 Mengshen Wang
https://orcid.org/0000-0002-3190-6062 Xueting Yu
https://orcid.org/0000-0002-1463-7630 Jingyi Guo
https://orcid.org/0000-0001-8857-2254 Tie Sun
https://orcid.org/0000-0002-7234-9100
Xinyan Li
1,*, Mozhi Wang
1,*, Mengshen Wang
1, Xueting Yu
1, Jingyi Guo
1, Tie Sun
1, Litong Yao
1, Qiang Zhang
2, Yingying Xu
11 Department of Breast Surgery, the First Affiliated Hospital of China Medical University, Shenyang, Liaoning Province, China
2 Department of Breast Surgery, Cancer Hospital of China Medical University, Liaoning Cancer Hospital &
Institute, Shenyang, Liaoning Province, China
Predictive and Prognostic Roles of
Pathological Indicators for Patients
with Breast Cancer on Neoadjuvant
Chemotherapy
Litong Yao
https://orcid.org/0000-0001-9233-5331 Qiang Zhang
https://orcid.org/0000-0002-7518-3097 Yingying Xu
https://orcid.org/0000-0003-4924-9379 Funding
This work was supported by National Natural Science Foundation of China (81773083, 81702881, 81702593 and 81773163) and Liaoning Science and Technology Project (2013225585).
Conflict of Interest
The authors declare that they have no competing interests.
Author Contributions
Conceptualization: Wang M2, Guo J;
Supervision: Zhang Q, Xu Y; Writing - original draft: Li X, Wang M1; Writing - review & editing:
Wang M2, Yu X, Guo J, Sun T, Yao L.
Wang M1, Mozhi Wang; Wang M2, Mengshen Wang
a surrogate endpoint for accelerated appraisal of new drugs for NACT in patients with BC. However, some patients still relapse or die even after achieving pCR, whereas some patients without pCR have favorable outcomes; thus, pCR cannot be considered the single standard for predicting long-term survival. Furthermore, all patients do not benefit from NACT, as some patients develop drug resistance and present with stable disease or even disease progression during NACT, thereby missing the best surgical opportunity. Therefore, identification of more biomarkers is important for improving response evaluation and risk stratification before and after NACT, selecting appropriate candidates of NACT, and avoiding unnecessary chemotherapy-related toxicity for patients who respond less to NACT.
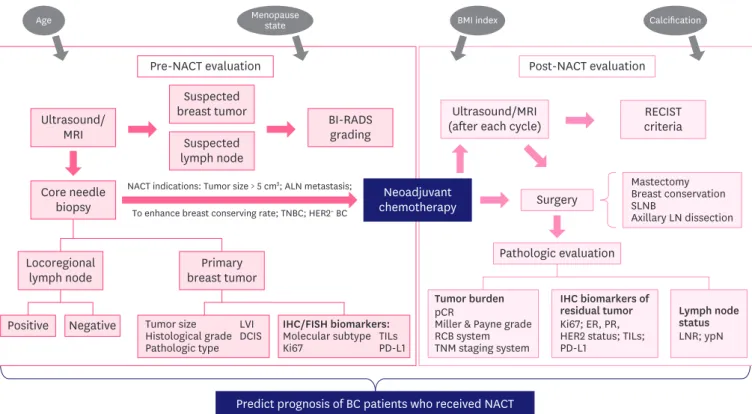
Furthermore, as a large number of patients with BC who do not achieve pCR usually suffer from higher risk of recurrence and death, it is important to identify more pathological response assessment approaches for evaluating morphological changes and cancer cell regression of tumors in patients with residual disease after NACT. Various approaches have been reported, among which post-treatment pathological grading of Ki-67, hormone receptor (HR) and human epidermal growth factor receptor 2 (HER2) status, and lymph node status after treatment have been shown to provide prognostic information for patients treated with NACT. In addition, assessment of pretreatment biomarkers, including Ki-67 level, histological grade, and molecular subtype of BC, can also predict the response of patients to NACT (Figure 1).
Predict prognosis of BC patients who received NACT Pre-NACT evaluation
Ultrasound/
MRI BI-RADS
grading
NACT indications: Tumor size > 5 cm2; ALN metastasis;
To enhance breast conserving rate; TNBC; HER2+ BC
Suspected breast tumor
Suspected lymph node Core needle
biopsy
Locoregional
lymph node Primary
breast tumor
Ultrasound/MRI
(after each cycle) RECIST
criteria
Mastectomy Breast conservation SLNBAxillary LN dissection
Tumor burden pCRMiller & Payne grade RCB system TNM staging system Tumor size
Histological grade Pathologic type
LVIDCIS
IHC biomarkers of residual tumor Ki67; ER, PR, HER2 status; TILs;
PD-L1
Lymph node status LNR; ypN Surgery
Pathologic evaluation
Positive Negative
Post-NACT evaluation
Neoadjuvant chemotherapy
IHC/FISH biomarkers:
Molecular subtype
Ki67 TILs
PD-L1
Age Menopause
state BMI index Calcification
Figure 1. The general clinical evaluating process of BC patients before and after NACT. Some evaluating results might provide additional prognostic information for patients received NACT (TILs and PD-L1 examination have not been routinely used in current clinical practice).
BC = breast cancer; NACT = neoadjuvant chemotherapy; TILs = tumor-infiltrating lymphocytes; PD-L1 = programmed death ligand 1; MRI = magnetic resonance imaging; BI-RADS = Breast Imaging, Reporting and Data System; LVI = lymphovascular invasion; DCIS = ductal carcinoma in situ; IHC = immunohistochemistry;
FISH = fluorescence in situ hybridization; RECIST = Response Evaluation Criteria in Solid Tumors; SLNB = sentinel lymph node biopsy; LN = lymph node; pCR = pathological complete response; RCB = residual cancer burden; TNM = tumor-node-metastasis; ER = estrogen receptor; PR = progesterone receptor; HER2 = human epidermal growth factor receptor 2; LNR = lymph node ratio.
Nevertheless, the results of the previous studies are discordant, indicating that these biomarkers within different study populations might reveal diverse predictive and prognostic efficacy. The discordance might be explained by the heterogeneity of biological features and diversity in the chemo-sensitivity of different BC intrinsic subtypes. Indeed, rational investigation of the predictive and prognostic factors and their analysis in different patient subgroups are beneficial for identifying patients with high risk of relapse or death and require further adjuvant treatment. Therefore, the objective of this review is to systematically overview the predictive and prognostic value of a series of pathological indicators for patients who have received NACT. Apart from the baseline level and post-treatment level of these biomarkers, alterations in the expression of these indicators during NACT and the long-term prognosis have also been reviewed.
PCR
Evaluating the criteria for pCR
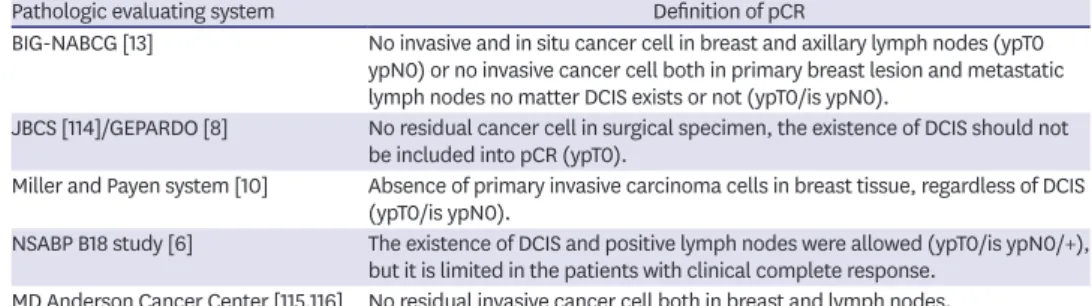
Based on the principles of various classification systems, pCR has been defined unanimously as the complete disappearance of invasive cancer cells in primary breast tumor [6,7]. However, whether the ductal carcinoma in situ (DCIS) and residual cancer cells present in axillary lymph nodes should be considered when defining pCR is still debated (Table 1) [6,8-10]. Mazouni and colleges [11] from the MD Anderson Cancer Center conducted a retrospective analysis including 2,302 patients treated with NACT and observed similar 5- and 10-year overall survival (OS) and disease-free survival (DFS) between the pCR group (patients achieved pCR both in breast and lymph nodes) and DCIS group (patients without residual disease in primary tumor and lymph nodes, but contained DCIS) after 250 months of follow-up [11]. Concordantly, a meta-analysis of 12 clinical trials conducted by Collaborative Trials in Neoadjuvant Breast Cancer (CTNeoBC) demonstrated similar event-free survival (EFS) and OS rates irrespective of DCIS [5]. Although several studies have suggested that DCIS is not important for defining pCR, other researchers argue that DCIS might lead to higher local recurrence risk for patients after NACT [12]. Indeed, the individual characteristics of patients must be considered when analyzing the effect of DCIS on survival; thus, patients with DCIS should be evaluated and treated individually. In contrast, CTNeoBC conducted a pooled analysis and demonstrated that it was inappropriate to define patients with isolated cells in axillary lymph nodes as pCR [5]. Therefore, researchers of the Breast International Group-North American Breast Cancer Group (BIG-NABCG) defined pCR as the absence of invasive cancer cells in primary tumor and metastatic lymph nodes, while the presence of DCIS has not been explicitly concluded [13].
Table 1. Definition of pCR
Pathologic evaluating system Definition of pCR
BIG-NABCG [13] No invasive and in situ cancer cell in breast and axillary lymph nodes (ypT0 ypN0) or no invasive cancer cell both in primary breast lesion and metastatic lymph nodes no matter DCIS exists or not (ypT0/is ypN0).
JBCS [114]/GEPARDO [8] No residual cancer cell in surgical specimen, the existence of DCIS should not be included into pCR (ypT0).
Miller and Payen system [10] Absence of primary invasive carcinoma cells in breast tissue, regardless of DCIS (ypT0/is ypN0).
NSABP B18 study [6] The existence of DCIS and positive lymph nodes were allowed (ypT0/is ypN0/+), but it is limited in the patients with clinical complete response.
MD Anderson Cancer Center [115,116] No residual invasive cancer cell both in breast and lymph nodes.
pCR = pathologic complete response; DCIS = ductal carcinoma in situ; BIG-NABCG = Breast International Group- North American Breast Cancer Group; JBCS = Japanese Breast Cancer Society; GEPARDO = German Preoperative Adriamycin-Docetaxel; NSABP = National Surgical Adjuvant Breast and Bowel Project.
Concordantly, Morrow [14] indicated that the presence of residual tumor in axillary lymph nodes definitely increased the risk of relapse and death. Thus, the medical community has accepted that the assessment of axillary lymph node status following NACT is indispensable, as it improves the prognostic efficacy of pCR. A comprehensive review of the results of previous clinical studies showed that pCR can be defined as no residual invasive cancer in the breast and lymph nodes but allows for DCIS (ypT0/isypN0). Patients with residual invasive cancer cells in lymph nodes could not be supposed as achieving pCR, while those who remaining DCIS should be analyzed separately.
Prognostic efficacy of pCR
pCR represents a satisfying treatment response to NACT. Furthermore, ever since studies of the National Surgical Adjuvant Breast and Bowel Project (NSABP) B-18 and B-27 showed significant prolongation of DFS and OS in patients who achieved pCR compared to those who retained residual disease after NACT [15], an increasing number of studies have investigated the prognostic value of pCR. Although BC of young women tend to be more aggressive with a relatively unfavorable prognosis [16], reports show that patients aged ≤ 40 years can also obtain significant survival benefit by achieving pCR after NACT [17]. As a prognostic indicator, pCR has the advantage of reflecting chemo-sensitivity in short time after NACT, which underscores the necessity of subsequent adjuvant treatment following surgery.
However, evidence showing that the increase in pCR rate may translate into corresponding improvement in EFS and OS is lacking, and not all patients who achieved pCR had better survival and lower recurrence rates. The limitation of pCR might be because of the following:
1) some other risk factors of patients might weaken the prognostic benefit of pCR. Although several studies have suggested correlation between pCR and better prognosis, a small group of people show disease relapse and metastasis in the short term, even after achieving pCR after NACT. According to previous studies, factors such as HER2-positivity, axillary lymph nodes metastases, identified lymph nodes < 10, premenopausal status, and clinical stage IIIB–C might enhance the recurrence or metastasis rates for patients who have achieved pCR [18-20]; 2) the rates of pCR are discordant among different subtypes and the prognostic effects of pCR do not apply to all molecular subtypes of BC. Studies have shown that pCR rate is higher in patients with triple-negative breast cancer (TNBC) and HER2-positivity than in HR-positive/HER2-negative patients [21,22]. According to the results of CTNeoBC meta-analysis, patients with highly aggressive subtype (such as TNBC or HER2-positive) who achieved pCR showed more prominent improved outcomes than patients with luminal A subtype [5]. von Minckwitz et al. [12] observed a significant association between improved DFS and pCR in luminal B/HER2
−, HER2
+, and TNBC tumors, but not in the luminal A and luminal B/HER2
+subset [12]. Concordantly, studies have suggested that failure to achieve pCR is related to unfavorable prognosis in TNBC and HER2
+tumors, but not in most of HR-positive patients with BC [12]. Indeed, studies have indicated that HR-positive patients tend to show favorable prognosis although they were less responsive to chemotherapy with relatively lower chances of achieving pCR [5], thereby reflecting the uncertain correlation between pCR and long-term outcomes in patients with HR-positive tumors.
Although the estimated rates of pCR have increased after the addition of new drugs in the
routine chemotherapy, a large number of patients fail to achieve pCR following NACT, and
not all the patients with pCR show good prognosis. pCR is far from a rationale prognostic
factor for HR-positive BC. Therefore, the use of pCR as a replacement of DFS and OS to
reflect the long-term prognosis still lacks credibility. The general characteristics of patients
should also be considered to comprehensively determine the correlation of pCR with prognosis, thereby facilitating the practice of precision medication.
RESIDUAL CANCER BURDEN (RCB)
Definition of RCB
pCR is related to improved prognosis; however, different degrees of residual disease after NACT persisted in some patients, which prompted the use of other indicators to assess the residual tumor and provide prognostic information. RCB is a pathological assessing system for evaluating residual disease following NACT, which has appealed to an increasing number of researchers in recent years. Compared to pCR, the RCB system can easily quantify post-treatment pathological response and can accurately predict long-term prognosis [23].
Furthermore, the RCB index is a highly reproducible tool for effectively predicting distant recurrence free survival (DRFS) and OS [24]; thus, RCB has the potential to act as a widely- used prognostic indicator in clinical practice. The RCB evaluation system considers both the primary tumor in breast tissue (size, cellularity, and in situ disease) and metastatic lymph nodes (number and size) [25], which can be calculated using a web-based calculator of the MD Anderson Cancer Center. The RCB index is calculated both as a continuous score and a category based on the extent of the residual tumor. RCB-0 is equal to pathological complete response, while the residual disease is divided into RCB-I (minimal residual tumor), RCB-II (moderate residual tumor), and RCB-III (extensive residual tumor) with the cut-off values of 1.36 and 3.28 [24].
Prognostic value of RCB
Several researchers have realized the value of RCB index as an indicator of long-term survival for patients with BC after NACT (Table 2). It is noteworthy that the RCB system has been reported to be a primary or secondary endpoint for NACT due to the prognostic correlation of residual tumors in prospective trials of the Austrian Breast and Colorectal Cancer Study Group (ABCSG) [26]. Peintinger et al. [24] divided RCB into good response class (RCB 0/I) and bad response class (RCBII/III) in terms of the corresponding long-term outcomes. In addition, patients with RCB-I were confirmed to have similar 5-year distant relapse rate as RCB-0 (5.4% and 2.4%, respectively), while patients with RCB-III showed poor prognosis with 5-year distant relapse rate of 53.6% [25]. Symmans et al. [27] conducted a study including five cohorts and reported that RCB index was significantly associated with long- term prognosis in all the molecular subtypes and neoadjuvant treatment regimen cohorts of this study. Furthermore, the RCB index can be integrated with other prognostic biomarkers, which might provide more credible prognostic information for patients with BC. Studies have shown that the prognostic efficacy of tumor-infiltrating lymphocytes (TILs) was limited in patients with TNBC and HER2
+subtypes of BC, but not in those with luminal–HER2 BC [28]. Asano et al. [29] concluded that the integrated indicator ‘TILs-RCB’ is also capable of predicting recurrence rates in HR-positive patients and the prognostic efficacy of ‘TILs-RCB’
is higher than that of TILs or RCB alone. A concordant conclusion was obtained by Luen et al. [30], who showed that residual disease (RD) TILs level can further divide RCB-II patients into relatively higher and lower recurrence-free survival (RFS) groups, reflecting that addition of RD TILs into RCB class improved prognostic efficacy. In addition, RCB was also combined with Ki-67 index to form a prognostic indicator called ‘residual proliferative cancer burden’
(RPCB) to predict long-term prognosis after NACT, and the prognostic value of RPCB was
confirmed to be more than that of Ki-67 or RCB alone. Furthermore, the predictive value may
be further improved when post-treatment tumor grade and estrogen receptor (ER) status are considered [31].
Although several studies have proved the prognostic effect of RCB in neoadjuvant
chemotherapy, its ability to accurately identify high-risk patients is still conflicting [27,32].
The reliability of the RCB evaluation system might be challenged, as it places importance on
Table 2. Selected studies assessing the prognostic value of RCBStudy
(year) Ref. Study design Sample size
and NACT regimens BC subtypes Biomarker Prognostic value
Symmans
et al. (2017) [27] Prospective
cohort study Total (n = 1,158) All RCB0 (pCR) vs. RCB1 vs.
RCB2 vs. RCB3 Combined T/FAC cohort:
- CT only: n = 955 In combined T/FAC cohort: TNBC:
- CT + H (H + T/FEC ohort):
n = 203
HER2+ (n = 103) RFS (10-year): 86% vs. 81% vs. 55% vs. 23%, p < 0.01
TNBC (n = 219) HR-positive/HER2-negative:
HR+/HER2− (n = 501) RFS (10-year): 83% vs. 97% vs. 74% vs. 52%, p < 0.01
In H+T/FEC cohort: H + T/FEC cohort:
HR+/HER2+ (n = 108) RFS (10-year): 95% vs. 77% vs. 47% vs. 21%, p < 0.01 HR−/HER2+ (n = 95) Prognostic value were similar for both 5-year RFS and 5/10-
year OS (RCB0/1 were significantly better than RCB2 or RCB3 in all treatment cohorts and breast cancer subtypes).
Campbell
et al. (2017) [32] Prospective
cohort study Total (n = 162) All Continuous RCB score TNBC: RFS: p < 0.0001
- CT only HR+/HER2−: RFS: p = 0.0053
HER2+: RFS: p = 0.0091 Categorical RCB score pCR vs. RCB1 vs. RCB2 vs. RCB3:
RFS (5-year): 86% vs. 85% vs. 75% vs. 41%, p < 0.0001 RCB 3 vs. RCB 0/1/2:
Hazard ratio, 3.37; 95% CI, 1.96–5.80; p < 0.0001 Asano et al.
(2017) [29] Retrospective
analysis Total (n = 177) All RCB-TILs-positive (RCB-I and positive for TILs) versus RCB-TILs-negative
RCB-TILs-positive is better for recurrence in all patients - CT only
- CT + H TNBC (n = 61)
HER2+ (n = 36) HRBC (n = 80)
DFS: 51% vs. 22%, hazard ratio, 0.048; 95% CI, 0.012–
0.188; p < 0.001 OS: 51% vs. 25%, p = 0.005 Sharma et al.
(2018) [117] Prospective
cohorts study Total (n = 183) - CT only
TNBC RCB classes RCB0 vs. RCB1: Similar 3-year RFS (90% vs. 93%) and 3-year OS (94% vs. 100%)
RCB2 vs. RCB3: RCB2 better
RFS: hazard ratio, 4.70 (95% CI, 1.97–11.20), p < 0.0001 OS: hazard ratio, 4.34 (95% CI, 1.59–11.84), p = 0.002 RCB0/1 vs. RCB2/3: RCB0/1 better
RFS (3-year): 91% vs. 59%, p < 0.0001 OS (3-year): 95% vs. 75%, p < 0.0001 Luen et al.
(2019) [30] Prospective
study Total (n = 375) - CT only
TNBC with residual disease
after NACT RCB index Increasing RCB index was significantly associated with worse RFS (p < 0.001) and worse OS (p < 0.001) RCB1 vs. RCB2 vs. RCB3 RFS (3-year): 86% vs. 67% vs. 26%, p < 0.001 Sheri et al.
(2014) [31] Retrospective
analysis Total (n = 220)
- CT only All Residual proliferative
cancer burden (RPCB): Tertile 1 vs. Tertile 3:
Tertile 1 (score 0–2.8) vs.
Tertile 2 (score 2.8–3.72) vs. Tertile 3 (score > 3.72)
RFS: 83% vs. 34%
OS: 93% vs. 46%
RPCB was significantly more prognostic than either RCB or Ki-67 alone, p < 0.001
Addition of post-treatment grade and ER further improved the prediction of outcomes
Romero et al.
(2013) [118] Independent prospective cohort study
Total (n = 151) All RCB classes and RCB
index RCB0 vs. RCB1 vs. RCB2 vs. RCB3:
- CT only: n = 105 OS(5-year): 100% vs. 86.7% vs. 86.7% vs. 54.7%
- CT + H: n = 46 RFS(5-year): 78.1% vs. 66% vs. 77.5% vs. 32.2%
RCB3 vs. RCB0-2: RCB0-2 better OS: hazard ratio, 4.240, p < 0.0001 RFS: hazard ratio, 3.859, p < 0.0001
RCB = residual cancer burden; NACT = neoadjuvant chemotherapy; BC = breast cancer; CT = chemotherapy; H = trastuzumab; T = taxanes; F = 5-fluorouracil; E = epirubicin; C = cyclophosphamide; A= adriamycin; HER2 = human epidermal growth factor receptor 2; TNBC = triple negative breast cancer; HR = hormone receptor;
RFS = recurrence free survival; OS = overall survival; CI = confidence interval; HRBC = hormone receptor-positive breast cancer; TILs = tumor infiltrating lymphocytes;
ER = estrogen receptor; PR = progesterone receptor.
the presence of residual tumor in post-treatment pathological specimens without considering the baseline data. The crucial problem in the clinical decision-making for patients with RCB-I is the similarity in their prognosis with those who have achieved RCB-0. Furthermore, the reliability of RCB as a surrogate endpoint following NACT should be investigated.
KI-67 INDEX
Predictive value of pre-treatment Ki-67
Ki-67 is a nuclear antigen present in all phase of the cell cycle except in the G0 phase. It is a tumor proliferation marker and is mainly assessed using immunohistochemistry (IHC).
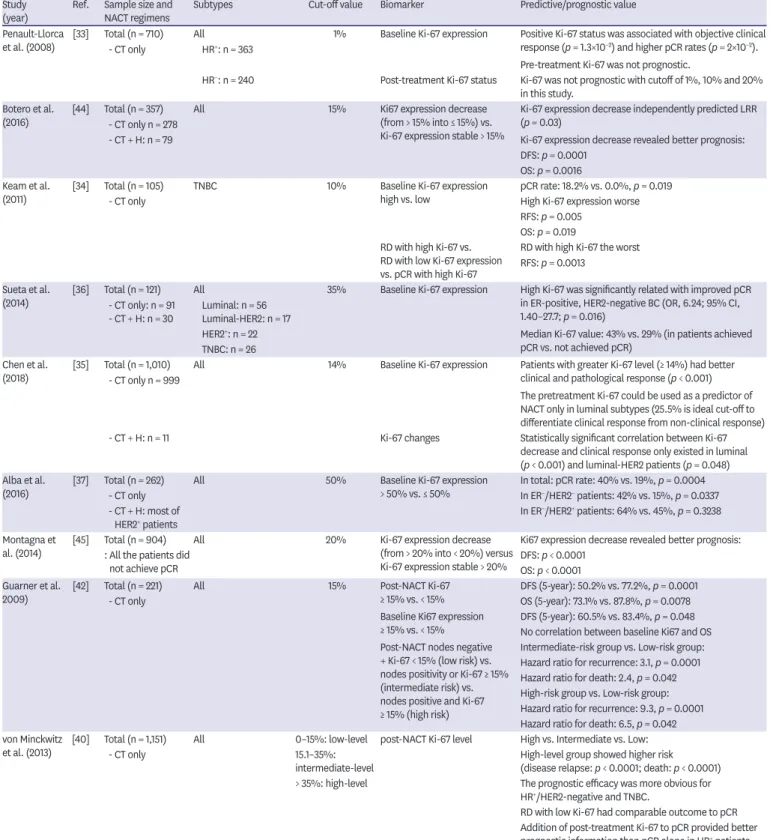
Based on the theory that highly proliferative tumors are highly sensitive to chemotherapy even in HR-positive patients, the pre-treatment Ki-67 level may be a potentially positive predictive factor of NACT response. Indeed, several studies have investigated the function of pre-treatment Ki-67 expression in predicting NACT response of patients across various BC subtypes (Table 3). Results obtained from various patient groups have confirmed that higher baseline Ki-67 expression was significantly associated with better treatment response and improved pCR rate [33-35]. Compared to patients with HER2
+and TNBC BC, ER-positive patients with higher pretreatment Ki-67 expression are more likely to show clinical response to NACT [36]. Chen et al. [35] concluded that higher baseline Ki-67 level can be considered a predictive indicator for pCR following NACT only in patients with the luminal subtype, and showed that 25.5% was ideal as the cut-off value for Ki-67 level using receptor operator characteristics (ROC) curve analysis. On the contrary, Alba et al. [37] analyzed the data from four clinical trials and concluded that baseline Ki-67 level > 50% was associated with higher pCR rate, especially in patients with ER
−/HER2
−and ER
−/HER2
+subtypes [37]. In contrast, Kim et al. [38] showed that pretreatment Ki-67 index > 25% was as an independent predictor of pCR, especially in HER2
+/ER
−patients.
In general, the predictive significance of Ki-67 index varies with studies, which might be because of lack of statistical verification in the cut-off values used in each study. Furthermore, as the ER
+patient groups usually have lower pCR rate irrespective of the baseline level of Ki- 67, significant discrepancy in the pCR rate between high and low Ki-67 level patient groups is not easily observed. Nevertheless, it is indubitable that the combination of baseline Ki-67 level based on core needle biopsy with other pre-NACT evaluating biomarkers can provide additional predictive information for treatment response, which can assist in identifying patients who may benefit from NACT.
Prognostic value of Ki-67
Evidently, both changes in Ki-67 level during NACT and post-treatment Ki-67 level in residual disease are effective predictors of long-term survival [31,39]. Previous studies (Table 3) showed that the latter generally tends to have a stronger prognostic impact than the former [40,41]. Keam et al. [34] investigated post-NACT Ki-67 level in 105 patients with TNBC and residual disease, and indicated that > 10% Ki-67 expression in residual disease was significantly associated with poor RFS (p = 0.0013) [34]. Guarneri et al. [42] built a prognostic model based on post-NACT node status, as well as Ki-67 expression level, and concluded that compared to low-risk (nodes negative and Ki-67 < 15%) and intermediate- risk (nodes positivity or Ki-67 ≥ 15%) patients, high-risk patients (nodes positive and Ki-67
≥ 15%) show significantly higher probability of recurrence and death. It is noteworthy that
the prognostic efficacy of the Ki-67 index might differ in various BC subtypes. von Minckwitz
Table 3. Predictive and prognostic value of Ki-67 with different cut-off values Study
(year) Ref. Sample size and
NACT regimens Subtypes Cut-off value Biomarker Predictive/prognostic value
Penault-Llorca
et al. (2008) [33] Total (n = 710) - CT only All
HR+: n = 363 1% Baseline Ki-67 expression Positive Ki-67 status was associated with objective clinical response (p = 1.3×10⁻²) and higher pCR rates (p = 2×10⁻²).
Pre-treatment Ki-67 was not prognostic.
HR−: n = 240 Post-treatment Ki-67 status Ki-67 was not prognostic with cutoff of 1%, 10% and 20%
in this study.
Botero et al.
(2016) [44] Total (n = 357) - CT only n = 278
All 15% Ki67 expression decrease
(from > 15% into ≤ 15%) vs.
Ki-67 expression stable > 15%
Ki-67 expression decrease independently predicted LRR (p = 0.03)
- CT + H: n = 79 Ki-67 expression decrease revealed better prognosis:
DFS: p = 0.0001 OS: p = 0.0016 Keam et al.
(2011) [34] Total (n = 105) TNBC 10% Baseline Ki-67 expression
high vs. low pCR rate: 18.2% vs. 0.0%, p = 0.019
- CT only High Ki-67 expression worse
RFS: p = 0.005 OS: p = 0.019 RD with high Ki-67 vs.
RD with low Ki-67 expression vs. pCR with high Ki-67
RD with high Ki-67 the worst RFS: p = 0.0013
Sueta et al.
(2014) [36] Total (n = 121) - CT only: n = 91 - CT + H: n = 30
All
Luminal: n = 56 Luminal-HER2: n = 17
35% Baseline Ki-67 expression High Ki-67 was significantly related with improved pCR in ER-positive, HER2-negative BC (OR, 6.24; 95% CI, 1.40–27.7; p = 0.016)
HER2+: n = 22 Median Ki-67 value: 43% vs. 29% (in patients achieved
pCR vs. not achieved pCR) TNBC: n = 26
Chen et al.
(2018) [35] Total (n = 1,010) - CT only n = 999
All 14% Baseline Ki-67 expression Patients with greater Ki-67 level (≥ 14%) had better clinical and pathological response (p < 0.001) The pretreatment Ki-67 could be used as a predictor of NACT only in luminal subtypes (25.5% is ideal cut-off to differentiate clinical response from non-clinical response)
- CT + H: n = 11 Ki-67 changes Statistically significant correlation between Ki-67
decrease and clinical response only existed in luminal (p < 0.001) and luminal-HER2 patients (p = 0.048) Alba et al.
(2016) [37] Total (n = 262) All 50% Baseline Ki-67 expression
> 50% vs. ≤ 50% In total: pCR rate: 40% vs. 19%, p = 0.0004
- CT only In ER−/HER2− patients: 42% vs. 15%, p = 0.0337
- CT + H: most of
HER2+ patients In ER−/HER2+ patients: 64% vs. 45%, p = 0.3238
Montagna et
al. (2014) [45] Total (n = 904) All 20% Ki-67 expression decrease
(from > 20% into < 20%) versus Ki-67 expression stable > 20%
Ki67 expression decrease revealed better prognosis:
: All the patients did
not achieve pCR DFS: p < 0.0001
OS: p < 0.0001 Guarner et al.
2009) [42] Total (n = 221) All 15% Post-NACT Ki-67
≥ 15% vs. < 15% DFS (5-year): 50.2% vs. 77.2%, p = 0.0001
- CT only OS (5-year): 73.1% vs. 87.8%, p = 0.0078
Baseline Ki67 expression
≥ 15% vs. < 15% DFS (5-year): 60.5% vs. 83.4%, p = 0.048 No correlation between baseline Ki67 and OS Post-NACT nodes negative
+ Ki-67 < 15% (low risk) vs.
nodes positivity or Ki-67 ≥ 15%
(intermediate risk) vs.
nodes positive and Ki-67
≥ 15% (high risk)
Intermediate-risk group vs. Low-risk group:
Hazard ratio for recurrence: 3.1, p = 0.0001 Hazard ratio for death: 2.4, p = 0.042 High-risk group vs. Low-risk group:
Hazard ratio for recurrence: 9.3, p = 0.0001 Hazard ratio for death: 6.5, p = 0.042 von Minckwitz
et al. (2013) [40] Total (n = 1,151) All 0–15%: low-level post-NACT Ki-67 level High vs. Intermediate vs. Low:
- CT only 15.1–35%:
intermediate-level High-level group showed higher risk (disease relapse: p < 0.0001; death: p < 0.0001)
> 35%: high-level The prognostic efficacy was more obvious for HR+/HER2-negative and TNBC.
RD with low Ki-67 had comparable outcome to pCR Addition of post-treatment Ki-67 to pCR provided better prognostic information than pCR alone in HR+ patients.
NACT = neoadjuvant chemotherapy; CT = chemotherapy (chemotherapy in these studies were based on trastuzumab, taxanes, 5-fluorouracil, epirubicin, cyclophosphamide and adriamycin); HR = hormone receptor; pCR = pathological complete response; H = trastuzumab; LRR = locoregional recurrence; DFS = disease free survival; OS = overall survival; RFS = recurrence-free survival; TNBC = triple-negative breast cancer; RD = residual disease; OR = odds ratio; CI = confidence interval; HER2 = human epidermal growth factor receptor 2; ER = estrogen receptor.
et al. [12] concluded that the evaluation of post-treatment Ki-67 provided more prognostic information than evaluation of pCR alone for ER
+patients. The DFS of ER
+patients who had low Ki-67 level (0%–15%) in residual disease was comparable to that of patients who achieved pCR, while post-NACT Ki-67 level > 35% was usually accompanied by higher risk of relapse and required subsequent adjuvant chemotherapy [40]. Furthermore, post-NACT Ki-67 expression has also been confirmed to be an independent prognostic indicator for DFS in HR-negative BC [43]. Similarly, Diaz-Botero et al. [44] and Montagna et al. [45] concluded that Ki-67 expression decreased during NACT correlated statistically with more favorable prognosis than high Ki-67 level retained before and after treatment, although the cut-off values for Ki-67 expression level were different (15% and 20%, respectively).
In conclusion, monitoring of Ki-67 expression level both at pre-treatment and post- treatment stages is necessary to guide subsequent treatment. However, the accuracy of previous conclusions might be affected by errors present in the process of pre-surgical coarse needle biopsy (CNB) and post-surgical pathological specimen slicing [46]; therefore, the pathological evaluation procedure must be further standardized, such that Ki-67 can be used as an effective prognostic indicator more reliably.
Value of Ki-67 in neoadjuvant endocrine therapy (NET)
The Ki-67 expression level reflects the cell proliferative status, while the mechanism of endocrine therapy involves induction of stasis in the cell cycle; therefore Ki-67 analysis has the potential to predict treatment benefits of NET. In a study containing 158 patients who received pre-surgical antiestrogen treatment, Dowsett et al. [47] demonstrated that patients with high Ki-67 level after two weeks of NET revealed an obviously lower RFS than those with low Ki-67 level (p = 0.004), while pre-treatment Ki-67 did not show any prognostic effect.
This suggested that short-term change in Ki-67 expression is a valid prognostic indicator of NET. Preoperative endocrine prognostic index (PEPI) score has been accepted as an effective prognostic model that incorporates post-treatment Ki-67 index, tumor histological stage, ER status, post-treatment residual disease size, and metastatic nodal status [48]. PEPI has been shown to be a prognostic marker that can better predict RFS for patients receiving NET, as a result of which some patients can avoid the post-surgical adjuvant treatment [49].
The relevance of PEPI in the context of RFSs has been investigated in a study of 203 patients enrolled in the IMPACT trial. The results showed that patients with pathological stage 1 or 0 and PEPI score 0 had the lowest recurrence rate of 10%, while patients with pathologic stage > 3 and PEPI score 3 showed the highest recurrence rate of 48% [50]. According to the results of The American College of Surgeons Oncology Group (ACOSOG) Z1031A trial (n = 236, ER-positive), patients with PEPI = 0 showed a significantly lower recurrence rate than the patients in the PEPI > 0 group (3.7% vs. 14.4%, p = 0.014). However, 35 patients (2- to 4-week NET, Ki-67 > 10%) who were changed to receive NACT showed lower pCR rate (5.7%) than expected; therefore, this group of patients should urgently follow a new effective alternative treatment strategy [51].
Currently, the Ki-67 index is not being applied in routine clinical practice, as the consensus
of rationale cut-off values for defining high versus low Ki-67 level has not been reached. A
meta-analysis including 23 studies showed that the pooled HR for OS was significantly higher
in the subgroup in which cut-off value of Ki-67 was > 25% than that in which the cut-off
value was < 25%, which suggested that selecting a cut-off value > 25% might improve the
prognostic prediction ability of Ki-67 [52]. The other disadvantage of using the Ki-67 index
might be the lack of standardized measurement technique and the limited reproducibility
of the study results. In conclusion, the usefulness of Ki-67 with discordant cut-off values in predicting the prognosis of patients in various molecular subtypes is still uncertain. To address this, more studies should be conducted to determine a standard method of accurately estimating the Ki-67 level.
TILS
Relationship between TILs and treatment response
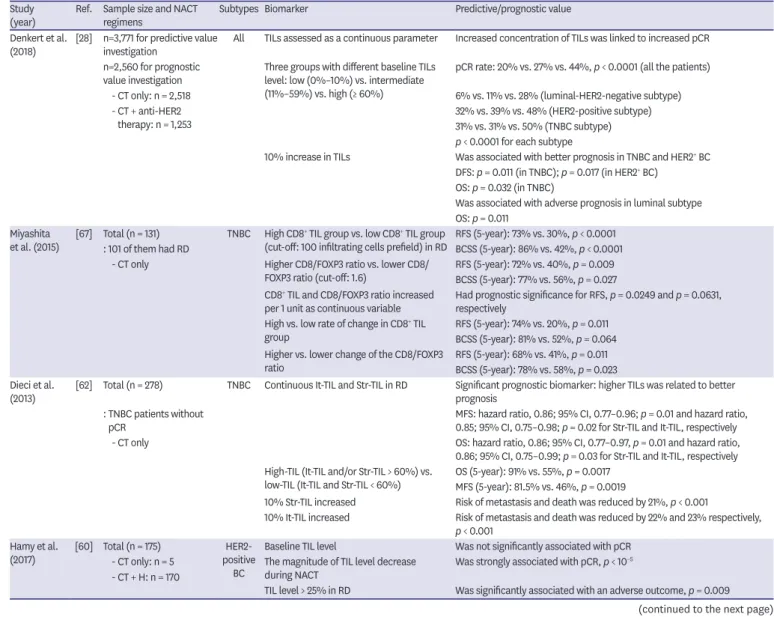
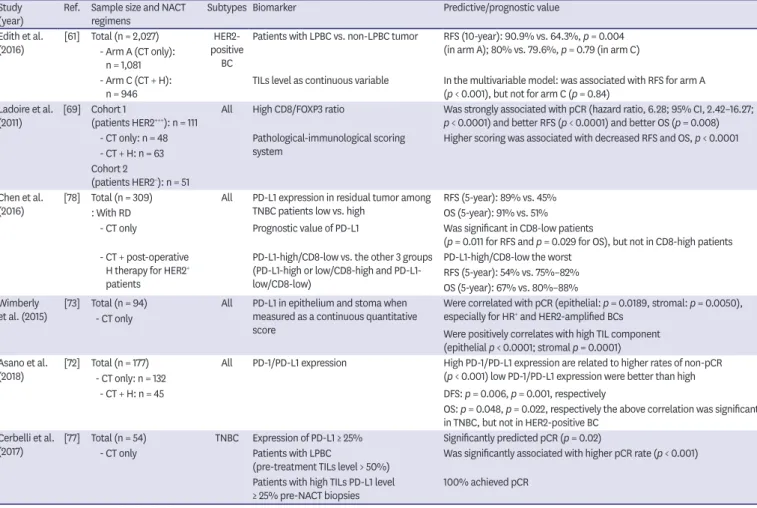
It is well known that lymphocytes infiltrating tumors modulate the cancer cell killing effect of chemotherapy, and an increasing body of evidence supports the correlation between pre-treatment TIL level and pathological response to NACT (Table 4). High levels of T cells, especially of the CD8
+subtype, have been demonstrated to be predictive of higher pCR rates [53-56]. A meta-analysis involving 3,251 patients reported that higher pre-treatment TILs correlated well with higher pCR rate in TNBC and HER2
+BC, but not in ER tumors [57]. Tumors that contain more than 50% TILs are defined as lymphocyte-predominant breast cancer (LPBC).
Table 4. Selected studies assessing TILs and PD-L1 expression for patients achieved NACT Study
(year) Ref. Sample size and NACT
regimens Subtypes Biomarker Predictive/prognostic value
Denkert et al.
(2018) [28] n=3,771 for predictive value
investigation All TILs assessed as a continuous parameter Increased concentration of TILs was linked to increased pCR n=2,560 for prognostic
value investigation Three groups with different baseline TILs level: low (0%–10%) vs. intermediate (11%–59%) vs. high (≥ 60%)
pCR rate: 20% vs. 27% vs. 44%, p < 0.0001 (all the patients)
- CT only: n = 2,518 6% vs. 11% vs. 28% (luminal-HER2-negative subtype)
- CT + anti-HER2
therapy: n = 1,253 32% vs. 39% vs. 48% (HER2-positive subtype)
31% vs. 31% vs. 50% (TNBC subtype) p < 0.0001 for each subtype
10% increase in TILs Was associated with better prognosis in TNBC and HER2+ BC DFS: p = 0.011 (in TNBC); p = 0.017 (in HER2+ BC)
OS: p = 0.032 (in TNBC)
Was associated with adverse prognosis in luminal subtype OS: p = 0.011
Miyashita
et al. (2015) [67] Total (n = 131) TNBC High CD8+ TIL group vs. low CD8+ TIL group
(cut-off: 100 infiltrating cells prefield) in RD RFS (5-year): 73% vs. 30%, p < 0.0001
: 101 of them had RD BCSS (5-year): 86% vs. 42%, p < 0.0001
- CT only Higher CD8/FOXP3 ratio vs. lower CD8/
FOXP3 ratio (cut-off: 1.6) RFS (5-year): 72% vs. 40%, p = 0.009 BCSS (5-year): 77% vs. 56%, p = 0.027 CD8+ TIL and CD8/FOXP3 ratio increased
per 1 unit as continuous variable Had prognostic significance for RFS, p = 0.0249 and p = 0.0631, respectively
High vs. low rate of change in CD8+ TIL
group RFS (5-year): 74% vs. 20%, p = 0.011
BCSS (5-year): 81% vs. 52%, p = 0.064 Higher vs. lower change of the CD8/FOXP3
ratio RFS (5-year): 68% vs. 41%, p = 0.011
BCSS (5-year): 78% vs. 58%, p = 0.023 Dieci et al.
(2013) [62] Total (n = 278) TNBC Continuous It-TIL and Str-TIL in RD Significant prognostic biomarker: higher TILs was related to better prognosis
: TNBC patients without
pCR MFS: hazard ratio, 0.86; 95% CI, 0.77–0.96; p = 0.01 and hazard ratio,
0.85; 95% CI, 0.75–0.98; p = 0.02 for Str-TIL and It-TIL, respectively
- CT only OS: hazard ratio, 0.86; 95% CI, 0.77–0.97, p = 0.01 and hazard ratio,
0.86; 95% CI, 0.75–0.99; p = 0.03 for Str-TIL and It-TIL, respectively High-TIL (It-TIL and/or Str-TIL > 60%) vs.
low-TIL (It-TIL and Str-TIL < 60%) OS (5-year): 91% vs. 55%, p = 0.0017 MFS (5-year): 81.5% vs. 46%, p = 0.0019
10% Str-TIL increased Risk of metastasis and death was reduced by 21%, p < 0.001
10% It-TIL increased Risk of metastasis and death was reduced by 22% and 23% respectively, p < 0.001
Hamy et al.
(2017) [60] Total (n = 175) HER2-
positive BC
Baseline TIL level Was not significantly associated with pCR - CT only: n = 5
- CT + H: n = 170
The magnitude of TIL level decrease
during NACT Was strongly associated with pCR, p < 10−5
TIL level > 25% in RD Was significantly associated with an adverse outcome, p = 0.009 (continued to the next page)
Patients with LPBC were confirmed to have higher chance of achieving pCR (p < 0.001) and usually yielded lower RCB class following NACT than non-LPBC patients (p < 0.001) [58].
Furthermore, the extent of elevation in TIL level in the process of NACT can be an indicator of tumor microenvironment response and may influence post-treatment tumor reduction [59].
Prognostic value of TILs
With the exception of baseline TIL level, the presence of post-NACT TILs in residual disease can also reflect the response of the tumor immune microenvironment to chemotherapy, which can provide additional prognostic information. A study investigated the prognostic value of TIL level before, during, and after NAC in HER2
+BC; results suggested that stromal TIL level > 25% in residual disease had an adverse prognostic efficacy. However, no association between baseline TIL levels and long-term survival was observed [60]. For HER2-positive patients who received trastuzumab, the prognostic role of TILs has not been definitely ascertained, and further studies should be conducted to determine whether HER2- positive patients with higher TIL level can obtain survival benefit from trastuzumab therapy [56,61]. Dieci et al. [62] observed that the higher post-treatment TIL subgroup showed significantly elevated 5-year metastasis-free survival (MFS) and OS rates for patients with
Study(year) Ref. Sample size and NACT
regimens Subtypes Biomarker Predictive/prognostic value
Edith et al.
(2016) [61] Total (n = 2,027) HER2- positive
BC
Patients with LPBC vs. non-LPBC tumor RFS (10-year): 90.9% vs. 64.3%, p = 0.004 (in arm A); 80% vs. 79.6%, p = 0.79 (in arm C) - Arm A (CT only):
n = 1,081 - Arm C (CT + H):
n = 946 TILs level as continuous variable In the multivariable model: was associated with RFS for arm A (p < 0.001), but not for arm C (p = 0.84)
Ladoire et al.
(2011) [69] Cohort 1
(patients HER2+++): n = 111 All High CD8/FOXP3 ratio Was strongly associated with pCR (hazard ratio, 6.28; 95% CI, 2.42–16.27;
p < 0.0001) and better RFS (p < 0.0001) and better OS (p = 0.008) - CT only: n = 48 Pathological-immunological scoring
system Higher scoring was associated with decreased RFS and OS, p < 0.0001 - CT + H: n = 63
Cohort 2
(patients HER2−): n = 51 Chen et al.
(2016) [78] Total (n = 309) All PD-L1 expression in residual tumor among
TNBC patients low vs. high RFS (5-year): 89% vs. 45%
: With RD OS (5-year): 91% vs. 51%
- CT only Prognostic value of PD-L1 Was significant in CD8-low patients
(p = 0.011 for RFS and p = 0.029 for OS), but not in CD8-high patients - CT + post-operative
H therapy for HER2+ patients
PD-L1-high/CD8-low vs. the other 3 groups (PD-L1-high or low/CD8-high and PD-L1- low/CD8-low)
PD-L1-high/CD8-low the worst RFS (5-year): 54% vs. 75%–82%
OS (5-year): 67% vs. 80%–88%
Wimberly
et al. (2015) [73] Total (n = 94) - CT only
All PD-L1 in epithelium and stoma when measured as a continuous quantitative score
Were correlated with pCR (epithelial: p = 0.0189, stromal: p = 0.0050), especially for HR+ and HER2-amplified BCs
Were positively correlates with high TIL component (epithelial p < 0.0001; stromal p = 0.0001) Asano et al.
(2018) [72] Total (n = 177) - CT only: n = 132
All PD-1/PD-L1 expression High PD-1/PD-L1 expression are related to higher rates of non-pCR (p < 0.001) low PD-1/PD-L1 expression were better than high
- CT + H: n = 45 DFS: p = 0.006, p = 0.001, respectively
OS: p = 0.048, p = 0.022, respectively the above correlation was significant in TNBC, but not in HER2-positive BC
Cerbelli et al.
(2017) [77] Total (n = 54) TNBC Expression of PD-L1 ≥ 25% Significantly predicted pCR (p = 0.02)
- CT only Patients with LPBC
(pre-treatment TILs level > 50%) Was significantly associated with higher pCR rate (p < 0.001) Patients with high TILs PD-L1 level
≥ 25% pre-NACT biopsies 100% achieved pCR
TILs = tumor-infiltrating lymphocytes; PD-L1 = programmed death ligand 1; NACT = neoadjuvant chemotherapy; CT = chemotherapy (chemotherapy in these studies were based on trastuzumab, taxanes, 5-fluorouracil, epirubicin, cyclophosphamide and adriamycin); HER2 = human epidermal growth factor receptor 2;
pCR = pathological complete response; TNBC = triple-negative breast cancer; BC = breast cancer; DFS = disease-free survival; OS = overall survival; RD = residual disease; RFS = recurrence-free survival; BCSS = breast cancer-specific survival; It = intratumoral; Str = stomal; MFS = metastasis-free survival; CI = confidence interval; HR = hormone receptor; LPBC = lymphocyte-predominant breast cancer.
Table 4. (Continued) Selected studies assessing TILs and PD-L1 expression for patients achieved NACT
TNBC. Pruneri et al. [63] showed that each 10% increase in TILs correlated significantly with better survival. Denkert et al. [28] confirmed that the predictive value of enhanced TIL level for NACT response was potent across all molecular subtypes. However, patients with luminal subtype BC and increased TIL infiltration showed poor prognosis, whereas patients with HER2 enrichment and TNBC tumor gained survival benefit from the high level of TILs. This supported the hypothesis that the cellular composition of immune infiltration in tumors is different among each molecular subtypes, which determines different clinical outcomes and NACT response [64]. On the other hand, the predictive efficacy of TILs on OS for patients with luminal subtype is opposite for TNBC and HER2
+BC, which may be explained by the resistance of luminal patients to adjuvant endocrine therapy induced by TILs, while TNBC and HER2
+BC patients with higher post-treatment TILs level have more chances of obtaining survival benefit from NACT. Furthermore, infiltrated T cells contain various subpopulations, such as CD8 and Foxp3 cells [65]; the presence of CD8
+T cells was associated with improved outcome, while the presence of Foxp3
+T cells limited anti-tumor immunity [66-68]. Ladoire et al. [69] investigated the prognostic role of intratumoral CD8
+/FOXP3
+ratio and observed significant association between CD8
+/FOXP3
+ratio and RFS/OS, especially in the HER2- positive group. In conclusion, T cells in tumors can modulate the pathological response to NACT and have the potential to act as a surrogate endpoint for long-term outcomes.
Therefore, evaluation of detailed tumor immune response will be important for improving prognostic prediction and screening immunotherapy candidates.
PROGRAMMED DEATH LIGAND 1 (PD-L1)
PD-L1 has now been accepted as an immune regulatory molecule that can induce apoptosis and clearance of T-cells. It can weaken the immune response of human cells by combining with the programmed cell death-1 (PD-1) on immune cells. Therefore, PD-L1 plays an important role in the immune evasion mechanism of tumors, facilitating the progression of BC [70]. In addition, studies have reported that PD-L1 was prominently enriched in TNBC, although the clinical significance of PD-L1 for patients with TNBC is still controversial [71-73]. Tomioka et al. [74] reported that PD-L1 expression on tumors was significantly associated with the level of stromal TILs infiltrating surgical specimens in TNBC, which was associated with better outcomes. Indeed, many studies have reported the association between PD-L1 expression and TIL level, although the mechanism is still unclear [71,75,76].
The association between PD-L1 expression level and NACT therapeutic response has also been reported (Table 4). Wimberly et al. [73] reported that TILs and PD-L1 expressed in the epithelium or stroma acted as predictive indicators of pCR for patients receiving NACT in univariate and multivariate analysis. Owing to the aggressive features and poor prognosis of TNBC, identification of a predictive biomarker for treatment response is critical for fostering correct therapeutic decisions. Asano et al. [72] demonstrated that high expression of PD-1/
PD-L1 was associated with higher non-pCR percentage, and patients with lower PD-1/PD-L1
expression have longer DFS and OS, especially for patients with TNBC. Conversely, Cerbelli
et al. [77] concluded that PD-L1 was not able to act as an independent prognostic index in
patients with TNBC. The discrepancy might be the result of different cut-off values used and
discordant PD-L1 evaluating methods. Chen et al. [78] demonstrated that high expression of
PD-L1 in residual disease was an adverse prognostic indicator for RFS and OS, the effect of
which was most significant in patients with TNBC. The prognostic role of PD-L1 for RFS and
OS was only significant in CD8-low patients (RFS: p = 0.011, OS: p = 0.029), which suggested
the necessity of check-point inhibitor therapy for chemo-resistant patients. Recent studies have shown that high PD-L1 expression can attenuate the survival benefit derived from high TIL level following NACT in patients with TNBC [79]. Thus, the combination of the assessment of PD-L1 expression and TIL level might improve the prediction of prognosis for patients with TNBC and assist in guiding TNBC treatment.
PD-L1 evaluation can provide prognostic information and assist in selecting appropriate chemotherapy regimens. The PD-1/PD-L1 pathway in BC is potentially a new target of molecule-based treatments. Thus, it is important to determine the correlation between PD- L1 expression and survival rates of patients in different molecular subtypes to obtain reliable evidence for immune check-point treatment.
HR, HER2, AND INTRINSIC MOLECULAR SUBTYPES
Relationship between molecular subtype and treatment response of NACT In current clinical practice, BC is divided into diverse intrinsic molecular subtypes using immunohistochemical analysis, including HR-positive subtype (luminal A and luminal B), TNBC, and HER2-positive subtype (HER2-enriched and luminal B/HER2
+) [80]. The intrinsic subtype analysis has been demonstrated to significantly affect the prognosis of patients after NACT. Parker et al. [81] established a risk of relapse model combining intrinsic subtype and tumor size, which provides more prognostic and predictive information than other standard parameters. As has been reported previously, the survival benefit derived from NACT varied among different BC molecular subtypes. HR-positive patients have relatively more favorable outcome, although they are less responsive to NACT than TNBC and HER2
+tumors [82].
Indeed, it is widely accepted that patients with TNBC and HER2-enriched tumor showed higher pCR rates than luminal subtype [83-86]. Prat et al. [83] evaluated the recurrence risk based on BC subtype and confirmed the independent predictive and prognostic value of intrinsic subtype at diagnosis for patients after NACT. The correlation between pCR and survival is significant in partial patients based on molecular subtypes. Díaz-Casas et al. [84]
reported longer EFS and OS in patients who achieved pCR, which was statistically significant only in patients with TNBC. In a study involving 13,939 patients, pCR was demonstrated to be significantly associated with 5-year OS in patients with luminal B, HER2
+, and TNBC (93.0%, 94.2%, and 90.6%, respectively, HER2
+vs. TNBC, p = 0.016) [87]. Meyers et al. [88] reported high locoregional recurrence (LRR) rate in basal-like subtype patients on NACT, who should be offered stronger local therapy to improve prognosis. Similarly, Yoo et al. [85] and Haque et al. [87] separately concluded that the TNBC subgroup showed poorer survival than other subgroups after NACT, although pCR rate was highest in the group of patients with TNBC.
The molecular subtype of breast tumor is an important biomarker in clinical practice for selecting NACT candidates who may benefit more from the treatment.
Receptor conversion HER2 status conversion
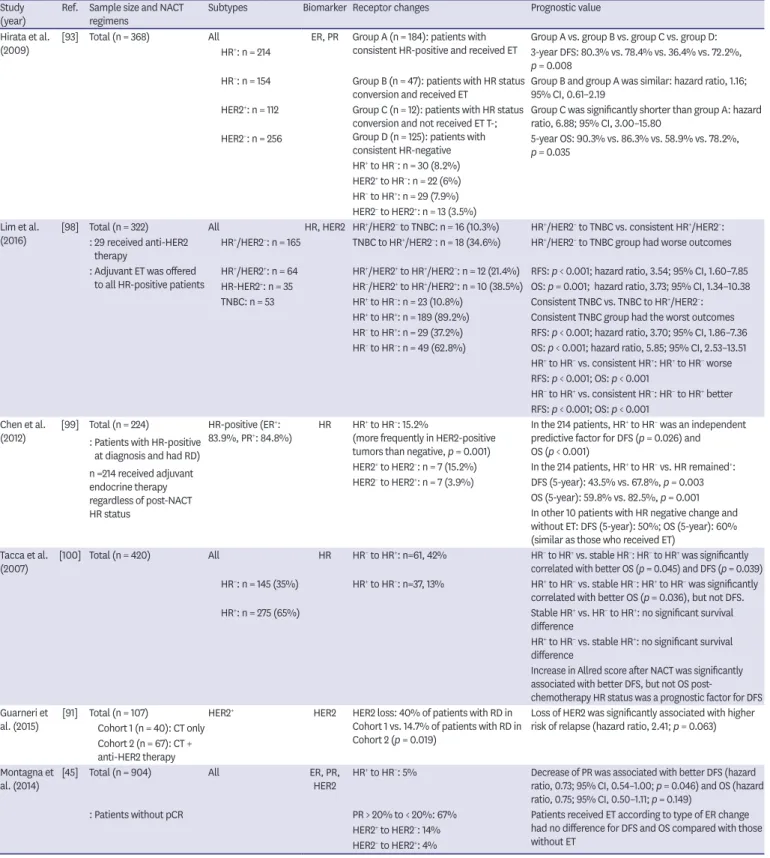
Several studies have investigated the switches in HER2 status induced by NACT, and some
researchers have confirmed the association between changes in HER2 status and long-
term prognosis (Table 5). According to a meta-analysis including 14 studies, the frequency
of HER2 receptor conversion was lower than that of ER and progesterone receptor (PR)
[89]. The rate of HER2 change has been found to be 10%–30% after receiving cytotoxic
chemotherapy alone. However, after combining with the neoadjuvant anti-HER2 target
treatment, the frequency of HER2 amplification loss may increase up to 43% [90]. Currently, whether changes in HER2 status affect prognosis is still not clear. Guarneri et al. [91]
reported that the loss of HER2 amplification during NACT is related to a tendency toward higher risk of recurrence and death. Furthermore, the cohort that received chemotherapy plus anti-HER2 therapy showed lower rate of HER2 loss (p = 0.019). Nevertheless, other studies have confirmed that the rate of HER2 loss was higher for patients received NACT, while application of trastuzumab did not affect the HER2 loss rate. The discordance might arise from the heterogeneity of agents used and differences in the assessment methods used in different studies. On the contrary, the frequency of change in HER2 status and their effect on survival were investigated by Yoshida et al. [92]. They showed that the incidence of changes in HER2 expression was higher in patients with HER2-positivity before NACT, and that there was no discordance in DFS induced by HER2 status change, irrespective of HER2 status prior to treatment. Thus, HER2 expression might change relatively less during NACT, although the prognostic value of HER2 alteration is not yet clear.
HR conversion
A retrospective clinical trial involving 368 cases reported that 16%–23% patients showed HR status change (either positive to negative or negative to positive) following NACT [93].
A review reported that the rates of HR status alteration after NACT ranged between 8% and 33% [94].
Several studies have investigated the effect of receptor changes on long-term prognosis of patients (Table 5). Parinyanitikul et al. [95] observed that receptor changes after NACT were associated with better prognosis. They used 20% as the cut-off value to identify ER and PR expression changes and concluded that patients with absolute ER percentage changes ≥ 20%
revealed high 5-year RFS and OS. However, there was no significant difference in the survival rate between patients with ≥ 20% PR changes and those with < 20% PR changes [95]. Montagna and colleagues [45] analyzed the quantitative changes in biological features before and after NACT in 904 patients and concluded that only 5% patients with ER changed from positive to negative, while 67% patients changed from PR > 20% to PR< 20%. Multivariate analysis showed that the decrease in PR correlated significantly with better outcome in terms of DFS than PR < 20% both in biopsy and surgical specimens, although the DFS and OS in patients with ER changes did not differ [45]. Evidently, the DFS and OS decreased significantly in patients with HR changes after NACT who did not receive subsequent ET. Hence, it is necessary to evaluate both pre- and post- NACT HR status. Patients who are positive for HR, either before or after NACT, should accept subsequent endocrine therapy [93].
Furthermore, other studies have suggested that the loss of HRs in residual tumor after NACT
was associated with poor prognosis [96,97]. Jin et al. [97] has concluded that switching to
TNBC after NACT was an adverse prognostic indicator for poor DFS and OS. The subgroup
that lost HR or HER2 expression had relatively higher Ki-67 level. Although all patients with
HR
+tumor received endocrine therapy in Lim et al.'s study [98], patients with HR
+to HR
−conversion still showed poorer prognosis than those who remained HR
+. Similarly, Chen et
al. [99] demonstrated shorter 5-year DFS and OS in patients who changed from HR-positive
to HR-negative, for whom adjuvant endocrine therapy did not offer any survival benefit. Thus,
patients who lose the HR during NACT might show less sensitivity to subsequent endocrine
treatment, resulting in relatively higher risk of recurrence and death. Thus, endocrine therapy
should be based on clinical information of each patient. On the contrary, patients showing
HR-positive changes showed better DFS and OS than patients who consistently showed
Table 5. The prognostic value of receptor conversion during NACT Study
(year) Ref. Sample size and NACT
regimens Subtypes Biomarker Receptor changes Prognostic value
Hirata et al.
(2009) [93] Total (n = 368) All ER, PR Group A (n = 184): patients with
consistent HR-positive and received ET Group A vs. group B vs. group C vs. group D:
HR+: n = 214 3-year DFS: 80.3% vs. 78.4% vs. 36.4% vs. 72.2%,
p = 0.008 HR−: n = 154 Group B (n = 47): patients with HR status
conversion and received ET Group B and group A was similar: hazard ratio, 1.16;
95% CI, 0.61–2.19 HER2+: n = 112 Group C (n = 12): patients with HR status
conversion and not received ET T-;
Group D (n = 125): patients with consistent HR-negative
Group C was significantly shorter than group A: hazard ratio, 6.88; 95% CI, 3.00–15.80
HER2−: n = 256 5-year OS: 90.3% vs. 86.3% vs. 58.9% vs. 78.2%,
p = 0.035 HR+ to HR−: n = 30 (8.2%)
HER2+ to HR−: n = 22 (6%) HR− to HR+: n = 29 (7.9%) HER2− to HER2+: n = 13 (3.5%) Lim et al.
(2016) [98] Total (n = 322) All HR, HER2 HR+/HER2− to TNBC: n = 16 (10.3%) HR+/HER2− to TNBC vs. consistent HR+/HER2−: : 29 received anti-HER2
therapy HR+/HER2−: n = 165 TNBC to HR+/HER2−: n = 18 (34.6%) HR+/HER2− to TNBC group had worse outcomes : Adjuvant ET was offered
to all HR-positive patients HR+/HER2+: n = 64 HR+/HER2+ to HR+/HER2−: n = 12 (21.4%) RFS: p < 0.001; hazard ratio, 3.54; 95% CI, 1.60–7.85 HR-HER2+: n = 35 HR−/HER2+ to HR+/HER2+: n = 10 (38.5%) OS: p = 0.001; hazard ratio, 3.73; 95% CI, 1.34–10.38 TNBC: n = 53 HR+ to HR−: n = 23 (10.8%) Consistent TNBC vs. TNBC to HR+/HER2−:
HR+ to HR+: n = 189 (89.2%) Consistent TNBC group had the worst outcomes HR− to HR+: n = 29 (37.2%) RFS: p < 0.001; hazard ratio, 3.70; 95% CI, 1.86–7.36 HR− to HR−: n = 49 (62.8%) OS: p < 0.001; hazard ratio, 5.85; 95% CI, 2.53–13.51
HR+ to HR− vs. consistent HR+: HR+ to HR− worse RFS: p < 0.001; OS: p < 0.001
HR− to HR+ vs. consistent HR−: HR− to HR+ better RFS: p < 0.001; OS: p < 0.001
Chen et al.
(2012) [99] Total (n = 224)
: Patients with HR-positive at diagnosis and had RD) n =214 received adjuvant endocrine therapy regardless of post-NACT HR status
HR-positive (ER+:
83.9%, PR+: 84.8%) HR HR+ to HR−: 15.2%
(more frequently in HER2-positive tumors than negative, p = 0.001)
In the 214 patients, HR+ to HR− was an independent predictive factor for DFS (p = 0.026) and OS (p < 0.001)
HER2+ to HER2−: n = 7 (15.2%) In the 214 patients, HR+ to HR− vs. HR remained+: HER2− to HER2+: n = 7 (3.9%) DFS (5-year): 43.5% vs. 67.8%, p = 0.003
OS (5-year): 59.8% vs. 82.5%, p = 0.001 In other 10 patients with HR negative change and without ET: DFS (5-year): 50%; OS (5-year): 60%
(similar as those who received ET) Tacca et al.
(2007) [100] Total (n = 420) All HR HR− to HR+: n=61, 42% HR− to HR+ vs. stable HR−: HR− to HR+ was significantly correlated with better OS (p = 0.045) and DFS (p = 0.039) HR−: n = 145 (35%) HR+ to HR−: n=37, 13% HR+ to HR− vs. stable HR−: HR+ to HR− was significantly
correlated with better OS (p = 0.036), but not DFS.
HR+: n = 275 (65%) Stable HR+ vs. HR− to HR+: no significant survival difference
HR+ to HR− vs. stable HR+: no significant survival difference
Increase in Allred score after NACT was significantly associated with better DFS, but not OS post- chemotherapy HR status was a prognostic factor for DFS Guarneri et
al. (2015) [91] Total (n = 107) HER2+ HER2 HER2 loss: 40% of patients with RD in Cohort 1 vs. 14.7% of patients with RD in Cohort 2 (p = 0.019)
Loss of HER2 was significantly associated with higher risk of relapse (hazard ratio, 2.41; p = 0.063) Cohort 1 (n = 40): CT only
Cohort 2 (n = 67): CT + anti-HER2 therapy Montagna et
al. (2014) [45] Total (n = 904) All ER, PR,
HER2 HR+ to HR−: 5% Decrease of PR was associated with better DFS (hazard ratio, 0.73; 95% CI, 0.54–1.00; p = 0.046) and OS (hazard ratio, 0.75; 95% CI, 0.50–1.11; p = 0.149)
: Patients without pCR PR > 20% to < 20%: 67% Patients received ET according to type of ER change had no difference for DFS and OS compared with those without ET
HER2+ to HER2−: 14%
HER2− to HER2+: 4%
NACT = neoadjuvant chemotherapy; HR = hormone receptor; ER = estrogen receptor; PR = progesterone receptor; ET = endocrine therapy; DFS = disease- free survival; CI, confidence interval; OS = overall survival; HER2 = human epidermal growth factor receptor 2; TNBC = triple-negative breast cancer; RFS = recurrence-free survival; RD = residual disease; CT = chemotherapy (chemotherapy in these studies were based on trastuzumab, taxanes, 5-fluorouracil, epirubicin, cyclophosphamide and adriamycin); pCR = pathological complete response.