10.3988/jcn.2010.6.2.89 J Clin Neurol 2010;6:89-98
Increased Circulating Endothelial Microparticles and Carotid Atherosclerosis in Obstructive Sleep Apnea
Chang-Ho Yun, MD, PhDa; Keun-Hwa Jung, MD, PhDb; Kon Chu, MD, PhDb; So-Hyun Kim, MDa; Ki-Hwan Ji, MDa; Hee-Kwon Park, MDa; Hwan-Cheol Kim, MDc; Soon-Tae Lee, MD, PhDb; Sang-Kun Lee, MD, PhDb; Jae-Kyu Roh, MD, PhDb
Departments of aNeurology and cOccupational and Environmental Medicine, Inha University College of Medicine, Incheon, Korea Department of bNeurology, Seoul National University College of Medicine, Seoul, Korea
Received October 1, 2009 Revised February 26, 2010 Accepted March 22, 2010 Correspondence Jae-Kyu Roh, MD, PhD Department of Neurology, Seoul National University College of Medicine, 101 Daehak-ro, Jongno-gu, Seoul 110-744, Korea Tel +82-2-2072-3265 Fax +82-2-3672-4949 E-mail [email protected]
Background and PurposezzEndothelial impairment is a linking mechanism between obstruc- tive sleep apnea (OSA) and cardiovascular diseases. Profiles of endothelial microparticles (EMPs) and endothelial progenitor cells (EPCs) reflect the degree of endothelial impairment. The aims of this study were to measure the levels of EMPs and progenitor cells in OSA, determine the correla- tions between these factors and OSA severity and the degree of atherosclerosis, and document any changes in these factors after therapy.
MethodszzSubjects with (n=82) and without (n=22) OSA were recruited prospectively. We mea- sured the number of colony-forming units (CFU) in cell culture as the endothelial progenitor cell index, and the number of EMPs using flow cytometry with CD31 [platelet endothelial cell adhesion molecule (PECAM)], CD42 (platelet glycoprotein), annexin V, and CD62E (E-selec- tin) antibodies at baseline and after 4-6 weeks of continuous positive airway pressure (CPAP) therapy. Carotid intima-media thickness (IMT) was regarded as a marker of atherosclerosis.
ResultszzThe levels of PECAM+CD42- (p<0.001), PECAM+annexin V+ (p<0.001), and E-selec- tin+ microparticles (p=0.001) were higher in OSA subjects than in non-OSA subjects. The number of CFU did not differ between the two groups. OSA severity independently predicted the levels of PECAM+CD42- (p=0.02) and PECAM+annexin V+ (p=0.004). Carotid IMT was correlated with OSA severity (p<0.001), PECAM+CD42- (p=0.03), and PECAM+annexin V+ (p=0.01). Neither OSA severity nor carotid IMT was correlated with either the number of CFU or E-selectin+. CPAP therapy decreased the occurrence of E-selectin+ (p<0.001) in 21 of the OSA subjects, but had no effect on the other microparticles of the number of CFU.
ConclusionszzOSA led to the overproduction of EMPs, which moderately correlated with OSA severity and the degree of atherosclerosis, and partly responded to therapy. The endothelial impair- ment might contribute to future cardiovascular events. J Clin Neurol 2010;6:89-98 Key Wordszz atherosclerosis, endothelium, progenitor cells, continuous positive airway pres-
sure, colony-forming units assay.
Introduction
Sleep is a natural and inevitable part of human life. However, in about 2-5% of the adult population, sleep induces an unnat- ural and abnormal increase in upper-airways resistance, a con- dition known as obstructive sleep apnea (OSA).1,2 It has been shown that OSA can significantly and independently increase the risks of cardiovascular and cerebrovascular diseases.3 Ox-
idative stress, systemic inflammation, sympathetic activation, hemodynamic changes, and insulin resistance are the linking mechanisms between OSA and increased cardiovascular risk.3 Accelerated atherosclerosis and endothelial dysfunction also underlie this association.4,5
Endothelial microparticles (EMPs) are small (<1 μm) vesi- cles that are released from the endothelium in response to di- verse stimuli including oxidative stress and inflammation.6
EMPs can be differentiated from other microparticles originat- ing from leukocytes, erythrocytes, or platelets, and can be qu- antified by flow cytometry using specific antibodies raised against CD31 [platelet endothelial cell adhesion molecule (PECAM)], annexin-V, CD62E (E-selectin), or CD42 (plate- let glycoprotein), because they carry cytoplasmic components and cell-surface antigens of endothelial origin.6 The level of cir- culating EMPs in peripheral blood is augmented in various conditions that render the patient prone to endothelial dam- age or atherosclerosis, such as cerebrovascular disease,7 hy- pertension,8 hypercholesterolemia,9 diabetes mellitus,10 smok- ing,11 and acute coronary syndrome.12 Therefore, EMPs are re- garded as markers of vascular damage. Moreover, EMPs th- emselves might contribute to cardiovascular pathogenesis by affecting endothelial function, angiogenesis, and coagula- tion.13-15 Therefore, EMP levels are likely to be higher in OSA than in the non-OSA condition, and the difference may explain the link between OSA and cardiovascular diseases.
Endothelial progenitor cells (EPCs) are bone-marrow-deri- ved circulating cells that act as an endothelial reservoir for re- placing damaged or dysfunctional endothelium and counter- acting ongoing injury.16 EPC levels are associated with car- diovascular diseases and can be used to predict future vascu- lar events, in that lower levels are associated with poorer out- comes.16-18 Therefore, levels of EPC in OSA will be a reflec- tion of the vascular status.
Two recent studies found no difference in EMP levels be- tween OSA and non-OSA subjects.19,20 One of these studies included only minimally symptomatic OSA patients,19 and the other investigated subjects with both OSA and pulmonary hy- pertension.20 Therefore, it is difficult to generalize their results.
On the other hand, studies of EPC in OSA have produced inconsistent findings.21-23
We measured the levels of EMPs and EPCs in OSA subjects and compared them to those measured in non-OSA subjects, and documented the changes in these levels after treatment.
The tested hypothesis was that the levels of EMPs and EPCs differ between OSA and non-OSA, are correlated with OSA se- verity and carotid atherosclerosis, and change after treatment.
Methods
Subjects and assessment
Following Institutional Review Board approval, we prospec- tively recruited adults (≥20 years old) consecutively between March 2007 and March 2008 who had a history of habitual snoring or observed apneas. All subjects provided informed co- nsent to participate in the study. We excluded subjects with any of the following conditions: central sleep apnea; other sleep di- sorders such as insomnia, restless legs syndrome, parasomnia,
and narcolepsy or other hypersomnias; history of any cardio- vascular, cerebrovascular, or pulmonary diseases; history of or laboratory-detected renal, hepatic, or hematologic disorder;
clinical or laboratory evidence of inflammatory disease; histo- ry of autoimmune disease or malignancy; recent (within 4 we- eks) trauma; history of migraine, thyroid disease, or psychiat- ric disorder; current use of vitamin or anti-inflammatory drugs such as aspirin; or an inability to understand the consent form.
Subjects underwent full-night diagnostic polysomnogra- phy (Comet XL Lab-based PSG, TWin PSG software, Grass- Telefactor, West Warwick, RI, USA) followed by standard sco- ring.24 Obstructive apnea was defined when there was an ab- sence or reduction of airflow lasting more than 10 s with ongo- ing respiratory efforts, and hypopnea was scored as a reduc- tion in airflow of at least 30% for more than 10 s with associa- ted oxygen desaturation of more than 3%. The OSA diagnosis was based on an apnea-hypopnea index (AHI): those with AHI scores of at least 5 were was assigned to the OSA group, and the remainder were assigned to the OSA-free group. The OSA group was further subdivided into mild (AHI<15), moderate (AHI 15-30), and severe (AHI>30). AHI and mini- mum oxygen saturation were used as severity indices. Subjects with central sleep apneas, regardless of coexisting OSA, were excluded from the study.
Clinical evaluation was aided by a structured interview form, which included the Epworth Sleepiness Scale.25 The fol- lowing clinical findings were documented as designated con- founders: age, gender, body mass index (BMI), hypertension, diabetes mellitus, hyperlipidemia, current smoking, habitual al- cohol drinking, and medication. Blood glucose and lipid levels were measured after fasting for at least 8 h. Systolic and dia- stolic blood pressures were measured three times with 10-min intervals between each, in the supine position at the sleep lab- oratory, after which, polysomnography was performed with the aid of a mercury sphygmomanometer. Hypertension was defined when the mean systolic pressure was more than 140 mmHg or the mean diastolic pressure was more than 90 mmHg, or the subject was on antihypertensive medication. He- ight and weight were also measured in the laboratory. A sub- ject was defined as being overweight with a BMI of at least 23.0 kg/m2.26 Diabetes mellitus was defined when the subject had a relevant history or was on diabetes therapy. Hyperlip- idemia was diagnosed when the total cholesterol level exceed- ed 240 mg/dL, when the low-density lipoprotein-cholesterol level exceeded 160 mg/dL, or when the subject was taking a lipid-lowering agent. Current smoking was defined when the subject was smoking or had smoked within 6 months prior to enrollment in the study. Males who consumed at least 4 units of alcohol per day and females who consumed at least 2 units per day were classified as ‘habitual drinkers’.27
The carotid intima-media thickness (IMT) was measured (as a marker of atherosclerosis) in the morning after polysom- nography using high-definition B-mode ultrasonography with a 10.0-MHz linear array transducer (10L5, Terason 2000, Terason Ultrasound, Burlington, MA, USA) by one of the in- vestigators (K-H Ji) who was blind to other subject informa- tion. A longitudinal image of the distal common carotid artery was acquired. Measurements were performed 1 cm below the bifurcation at end-diastole in the segment including the thick- est point, but not plaques, on the far wall using software cali- pers (Intimascope, Media Cross, Tokyo, Japan). The average IMT from both sides was recorded. The presence of plaques was documented in the exposed areas of the bilateral common, external, and internal carotid arteries, and bulbs. A plaque was defined as a localized thickening greater than 1.2 mm that did not uniformly involve the entire artery. The degree of pla- que formation was defined as follows: 0=no plaque, 1=one small (<30% of the diameter), 2=one medium (between 30%
and 50% of the diameter) or multiple small, and 3=one large (>50% of the diameter) or multiple with at least one medium.
The presence of a plaque and its grade was also documented. IMT was measured in 80 subjects (76.9%); 24 subjects rejected the carotid study due to interference with their morning schedules.
Assay of EMPs and EPCs
In the morning (06:00-09:30 AM) after polysomnography, blood was drawn with a 21-gauge needle into heparinized bottles for EPC assay (25 mL) and citrated bottles for EMP as- say (30 mL). The number of colony-forming units (CFU) on the cell culture was adopted as an EPC index. The method for CFU assay is described elsewhere.28
For EMP assay, whole blood was centrifuged at 1,500×g for 15 min and again for 2 min at 13,000×g to obtain platelet- poor plasma, which was then stored at -70℃ until the analy- sis. After 2-6 weeks, frozen samples were thawed in a 37℃
water bath for 5 min and then centrifuged at 3,000×g for 15 min. Prepared plasma (50 μL) was incubated at room temper- ature for 30 min with monoclonal antibodies (2 μL each) un- der gentle shaking (orbital shaker, 120 rpm). Circulating EMPs were quantified and differentiated from microparticles of oth- er cellular origins by flow cytometry using a phycoerythrin- labeled CD31 (PECAM), allophycocyanin-annexin V, phyco- erythrin-CD62E (E-selectin), and fluorescein isothiocyanate- CD42 (platelet glycoprotein; BD Biosciences, San Jose, CA, USA).6,29 Double labeling with CD42 was performed to ex- clude PECAM-positive (PECAM+) microparticles of platelet origin. Phosphate-buffered saline was added to a total volume of 1 mL and samples were analyzed on a FACS II flow cytom- eter (BD Biosciences) using the medium flow-rate setting and a 30-s stop time. Microbeads from a FACS Size Calibration Kit
were used (Invitrogen, Carlsbad, CA, USA). EMPs of less than 1 μm were quantified as counts per microliter in specific popu- lations of PECAM+CD42-negative (CD42-), PECAM+ annex- in V-positive (annexin V+), and E-selectin-positive (E-selec- tin+) EMPs. Laboratory personnel were blinded to other data.
OSA intervention and follow-up analysis
Subjects who agreed to continuous positive airway pressure (CPAP) therapy underwent manual titration to normalize flow and sleep, including an AHI of <5/h. Titration was per- formed on a separate night. After CPAP therapy for 4-6 weeks, blood sampling for EPC and EMP analysis was per- formed in the morning (06:00-09:30 AM), and efficacy and compliance data were analyzed (S8 Elite and Autoscan 5.7, ResMed, Bella Vista, NSW, Australia). Changes in medica- tions, alcohol consumption, smoking, Epworth Sleepiness Scale, BMI, and blood pressure were noted. We included only CPAP-treated subjects, because surgery has a relatively poor and inconsistent outcome, and any procedure per se might bias EPC and EMP profiles.30
Statistical analysis
All results are presented as mean±standard deviation or me- dian (interquartile range) values for continuous variables, or number (percentage) values for categorical data. Variables not conforming to a normal distribution were log-transformed (EMPs), square-root transformed (AHI), or logit-transformed (minimum oxygen saturation) to achieve normality. Two- tailed Student’s t-test and Pearson’s chi-square (or Fisher’s ex- act) test were adopted for group comparisons. The Mann- Whitney U (or Kruskal-Wallis Analysis of Variance) test was applied in the subgroup analysis.
The existence of correlations between OSA severity and outcome measures (EMPs, EPC index, IMT) was assessed us- ing Pearson’s correlation analysis. Treatment responses of EMPs and EPC index were tested by paired t-test. Multiple regression analysis used IMT, EPC index, or EMPs as de- pendent variables. Covariates were waist circumference, hy- perlipidemia, alcohol drinking, and OSA severity indices.
The absence of multicollinearity was checked using the vari- ance-inflation factor. Statistical analysis was performed using SPSS software [SPSS 12.0 (SPSS Inc, Chicago, IL, USA)]. The null hypothesis was rejected at p<0.05.
Results
We evaluated 185 subjects consecutively; 49 were excluded due to cardiovascular diseases (n=23), vitamin intake (n=15), migraine (n=6), central apnea (n=4), and other factors (n=11).
Seven had two or more of the exclusion conditions and 23
declined to participate; 113 were initially enrolled into the study. Of these, 92 were diagnosed as suffering from OSA.
Blood sampling was unsuccessful or rejected in seven of these, and samples clotted in two. Ultimately, 104 subjects (age 40.8
±10.1 years, 90.4% males, BMI 26.1±3.4 kg/m2) were en- rolled in the study, of whom 82 were assigned to the OSA group and 22 to the non-OSA group.
EPC and EMP profiles
The OSA and non-OSA groups were balanced in terms of the distribution of key confounders (Table 1) and there was no significant difference in medication profiles, including antihypertensives (22.0% in OSA vs. 9.1% in non-OSA; p=
0.94) and statins (8.5% vs. 4.5%, p=1.00). Of the 23 subjects taking antihypertensive drugs, 15 were single-drug users and 7 were taking 2 drugs; only 1 subject was taking 3 drugs. Sta-
tins were taken by seven of the OSA subjects, and fibric acid by one. One non-OSA subject was on a statin. Scores on the Epworth Sleepiness Scale were higher in the OSA group, in which the levels of PECAM+CD42-, PECAM+annexin V+, and E-selectin+ EMPs were also significantly higher than those in the non-OSA group (Table 1). There was a significant correlation between the levels of PECAM+CD42- and PECAM+annexin V+ EMPs (r=0.89, p<0.001), but not with those of E-selectin+ EMPs. The EPC index did not differ be- tween the two groups (Table 1). The EPC index was lower in subjects on antihypertensive medication (32.9±22.1 vs.
45.6±25.4 for the OSA and non-OSA groups, respectively;
p=0.03). However, antihypertensive medication had no effect on EMP levels. There was no association between statin med- ication and gender, or between EPC index and EMPs. IMT was measured in 18 (81.8%) non-OSA subjects and 62 (75.6%)
Table 1. Characteristics and results of this study in obstructive sleep apnea (OSA) and non-OSA subjects
OSA (n=82) Non-OSA (n=22) p
Age (years) 41.5±9.8 039.1±10.7 0.34
Males (%) 75 (91.5) 19 (86.4) 0.44
Hypertension (%) 30 (36.6) 07 (31.8) 0.68
SBP (mmHg) 124.7±14.5 124.1±13.5 0.87
DBP (mmHg) 082.5±11.2 081.5±10.1 0.70
DM (%) 6 (7.3) 1 (4.2) 1.00
Hyperlipidemia (%) 18 (22.0) 2 (9.1) 0.23
Current smoking (%) 45 (54.9) 14 (63.6) 0.46
Habitual alcohol drinking (%) 37 (45.1) 10 (45.5) 0.98
Overweight (%)† 69 (84.1) 19 (86.4) 1.00
BMI (kg/m2) 026.0±3.6 26.2±2.8 0.84
F-glucose (mg/dL) 092.1±20.0 096.2±21.3 0.40
TC (mg/dL) 0202.2±29.7 198.6±26.6 0.60
TG (mg/dL) 0160.0±64.8 139.1±63.4 0.18
HDL (mg/dL) 050.8±10.3 48.6±7.5 0.35
LDL (mg/dL) 121.7±26.0 120.8±25.1 0.88
ESS score 010.6±4.9 07.2±3.9 0.004*
EDS (%) 38 (46.3) 04 (18.2) 0.02*
AHI 39.1 (20.2-58.0) 002.5 (0.9-3.2) <0.001*
MinSaO2 81.2 (75.0-86.0) 00091.5 (88.0-93.0) <0.001*
CFU 040.8±24.2 050.0±27.8 0.13
PECAM+CD42– EMPs (/μL) 153 (90-272) 0059 (39-104) <0.001*
PECAM+annexin V+ EMPs (/μL) 170 (84-303) 0052 (14-115) <0.001*
E-selectin+ EMPs (/μL) 81.5 (49-244) 39.5 (27-66) 00.001*
Carotid IMT (mm) 00.620±0.096 00.551±0.078 00.01*
Data are mean±standard deviation or median (interquartile range) values, depending on the data distribution for continuous data, and number (percentage) values for categorical data. For the statistical analysis, values not conforming to a normal distribution (AHI, minSaO2, EMPs) were transformed to achieve normality.
*p<0.05, Student’s t-test, Pearson chi-square test, or Fisher’s exact test, †Overweight, defined as BMI ≥23.0 kg/m2.
SBP: systolic blood pressure, DBP: diastolic blood pressure, DM: diabetes mellitus, BMI: body mass index, F-glucose: fasting glucose, TC: total cholesterol, TG: triglyceride, HDL: high density-lipoprotein-cholesterol, LDL: low density-lipoprotein-cholesterol, ESS: Epworth Sleepiness Scale, EDS: excessive daytime sleepiness (ESS score ≥11), AHI: apnea-hypopnea index, MinSaO2: minimum oxygen satura- tion (%), CFU: colony-forming units, PECAM: platelet endothelial cell adhesion molecule, EMPs: endothelial microparticles, IMT: intima- media thickness.
OSA subjects (p=0.54), and was found to be greater in the lat- ter (p=0.01)(Table 1).
While the OSA and non-OSA groups were balanced (Table 1), matching did not eliminate the time factor or the vascular remodeling that had resulted from coexisting conditions.
Therefore, we performed subgroup analysis. Nineteen sub- jects (14 OSA, 16 males, 41.1±9.9 years old, BMI 25.1±3.1 kg/m2) were free from smoking, hypertension, hyperlipid- emia, and diabetes mellitus.
The age, BMI, and gender did not differ between the OSA and non-OSA subjects. The levels of PECAM+CD42- EMPs were higher in OSA than in the non-OSA condition [150 (133- 243) vs. 69 (33-102), respectively; p= 0.03]. However, the EPC index score (p=0.30) and levels of PECAM+annexin V+ (p=0.09) and E-selectin+ EMPs (p=0.16) did not differ be- tween the two groups.
Correlations between OSA severity, endothelial markers, and atherosclerosis
The levels of PECAM+CD42- and PECAM+annexin V+ EMPs differed among mild, moderate, and severe OSA sub- jects, as did BMI and the proportions of hyperlipidemia and habitual alcohol drinking (Table 2). However, the levels of E-selectin+ EMPs and EPC index were not affected by the severity of OSA. Levels of PECAM+CD42- and PECAM+ an- nexin V+ EMPs were positively correlated with AHI (Fig. 1), but not with age, BMI, blood pressure, glucose, or lipid lev- els (p>0.05). Logit-transformed minimum oxygen saturation was also correlated with PECAM+annexin V+ EMP level (r=0.23, p=0.04), but not with levels of PECAM+CD42- (r=0.19, p=0.09) or E-selectin+ EMPs (r=0.03, p=0.78), or with CFU (r=0.09, p=0.45). Multiple regression analysis re- vealed that AHI was significantly associated with PECAM+- CD42- (p=0.02) and PECAM+annexin V+ EMP levels (p=
Table 2. Clinical features, blood endothelial markers, and carotid atherosclerosis relative to the severity of OSA
Mild OSA (n=18) Moderate OSA (n=16) Severe OSA (n=48) p
Age (years) 46.5 (34-50) 40.5 (31.5-49.0) 41.5 (34-47.5) 0.76*
Males (%) 17 (94.4) 13 (81.3) 45 (93.8) 0.78*
Hypertension (%) 5 (27.8) 9 (56.3) 16 (33.3) 0.18*
SBP (mmHg) 118 (110-125) 124 (115-141.5) 125.0 (115.0-134.5) 0.14*
DBP (mmHg) 77.5 (68-92) 82 (74-90.5) 82.5 (76.0-88.0) 0.48*
DM (%) 1 (5.6) 0 (0) 5 (10.4) 0.36*
Hyperlipidemia (%) 1 (5.6) 0 (0) 17 (35.4) 0.002*
Current smoking (%) 6 (33.3) 9 (56.3) 30 (62.5) 0.10*
Habitual alcohol drinking (%) 4 (22.2) 6 (37.5) 27 (57.4) 0.03*
Overweight (%)† 9 (50.0) 13 (81.3) 47 (97.9) <0.001*
BMI (kg/m2) 23.1 (21.3-25.7) 25.2 (23.9-26.9) 26.1 (25.0-28.4) <0.001*
F-glucose (mg/dL) 92.5 (89-99) 91.5 (86.5-99.5) 89.5 (81.0-98.5) 0.58*
TC (mg/dL) 193 (174-211) 197 (176-214) 206 (182-230) 0.15*
TG (mg/dL) 140 (113-170) 142.5 (91.5-183.0) 168.5 (123-218) 0.05*
HDL (mg/dL) 54 (45-58) 48.5 (43-61) 48.5 (43-56) 0.46*
LDL (mg/dL) 117 (96-128) 119.5 (103.5-130.0) 123 (106-143) 0.33*
ESS score 10 (6-12) 10.5 (7.0-14.5) 10 (7.0-13.5) 0.77*
EDS (%) 7 (38.9) 8 (50.0) 23 (47.9) 0.77*
AHI 11.1 (7.7-13.3) 21.0 (17.1-22.8) 52.8 (43.6-62.7) <0.001*
MinSaO2 88.5 (84-89) 85.6 (81-89) 76.2 (72-82) <0.001*
CFU 42.5 (27-67) 35.5 (12-56) 43 (22-53) 0.59*
PECAM+CD42- EMP (/μL) 136.5 (62-168) 126 (85-236) 213 (117-350) <0.001*
PECAM+annexin V+ EMP (/μL) 86.5 (53-152) 132 (80-181) 202.5 (156.0-333.5) <0.001*
E-selectin+ EMP (/μL) 90.5 (64-244) 100.5 (57-254) 78 (46-187) 0.69*
Carotid IMT (mm) 0.500±0.047 0.589±0.046 0.685±0.059 <0.001*
Data are median (interquartile range) or number (percentage) values. AHI, minSaO2, and EMP values were square root-, logit-, or log- transformed before the statistical analysis.
*p<0.05, Kruskal-Wallis ANOVA or Pearson chi-square test, †Overweight, defined as BMI ≥23.0 kg/m2.
OSA: obstructive sleep apnea, SBP: systolic blood pressure, DBP: diastolic blood pressure, DM: diabetes mellitus, BMI: body mass in- dex, F-glucose: fasting glucose, TC: total cholesterol, TG: triglyceride, HDL: high density-lipoprotein-cholesterol, LDL: low density-lipo- protein-cholesterol, ESS: Epworth Sleepiness Scale, EDS: excessive daytime sleepiness (ESS score ≥11), AHI: apnea-hypopnea index, MinSaO2: minimum oxygen saturation (%), CFU: colony-formingunits, EMPs: endothelial microparticles, IMT: intima-media thickness, ANOVA: analysis of variance
0.004). BMI, hyperlipidemia, and alcohol drinking did not predict EMP levels. There was no collinearity among AHI and its covariates (variance-inflation factor <4.0). The arous- al index was not correlated with either EMP level or EPC in- dex (p>0.05).
The relationship between IMT and OSA severity, EPC in- dex, and EMPs was assessed. Carotid Doppler ultrasound study was performed in 18 (81.8%) non-OSA subjects and in 62 OSA subjects: 16 (88.9%) with mild OSA, 10 (62.5%) with moderate OSA, and 36 (75.0%) with severe OSA. IMT was correlated with AHI with minimum saturation (r=-0.56, p<0.001) and the levels of PECAM+CD42- and PECAM+ an- nexin V+ EMPs (Fig. 2). Multiple regression analysis revealed that AHI and minimum saturation independently explained the change in IMT (p<0.001). Furthermore, the correlation be- tween IMT and levels of PECAM+CD42- and PECAM+ an- nexin V+ EMPs was independent of other confounders (β=
0.059, SE=0.027, and p=0.03; and β=0.061, SE= 0.023, and p=
0.01; respectively). However, neither the EPC index nor the lev- els of E-selectin+ EMPs was correlated with IMT. Carotid plaques were observed in 15 subjects, of which 11 were grade
1 (1 non-OSA; 3 with mild, 1 with moderate, and 6 with se- vere OSA) and 4 were grade 2 (all with severe OSA). The fre- quency of occurrence of a plaque did not differ among non- OSA (5.6%), mild-OSA (18.8%), moderate-OSA (10.0%), and severe-OSA (27.8%) subjects (p=0.42), and was not associat- ed with either EMP level or EPC index (p>0.05).
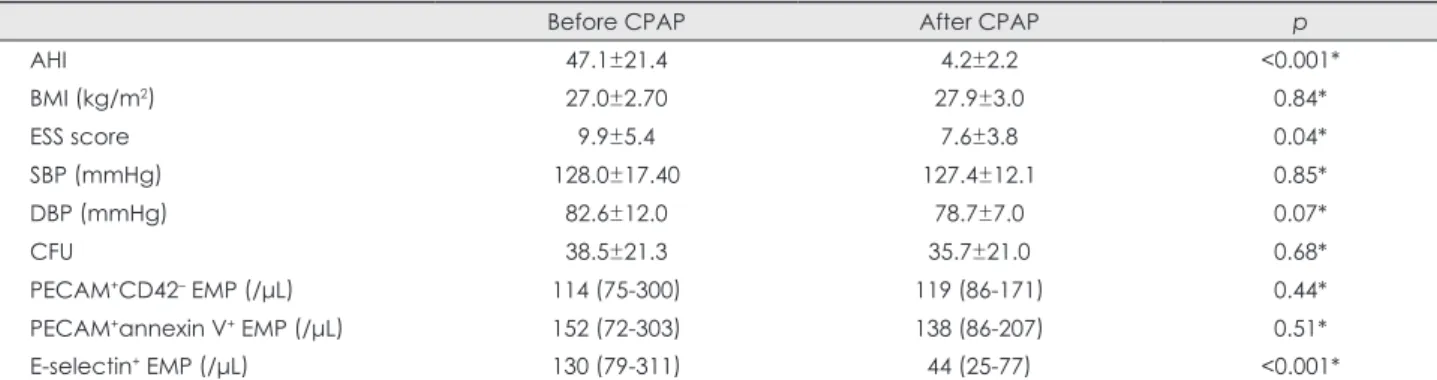
Endothelial markers after treatment
Twenty-one patients (25.6%) consented to CPAP therapy, during which one quit smoking. All other conditions were similar to those measured at baseline. Compliance was 89.3±
7.1% (percentage of days with CPAP used for more than 4 h) and the median number of used-hours was 5.83±1.10 h. The mean levels of E-selectin+ EMPs decreased from 133/μL (range 79-311/μL) to 44/μL (25-77/μL) (p<0.001), but there were no significant changes in the EPC index or in the levels of PECAM+CD42- or PECAM+annexin V+ EMPs (Fig. 3)(Ta- ble 3). There was no correlation between levels of E-selectin+ EMPs and residual AHI. CPAP compliance did not affect the treatment response of EPC index and EMP level. In two sub- jects, levels of E-selectin+ EMPs increased (from 33/μL to 40/
Fig. 1. Correlation between apnea hy- popnea index (AHI) and levels of endo- thelial microparticles (EMPs). AHI was correlated with platelet endothelial cell adhesion molecule (PECAM)+CD42- EMPs (r=0.28, p=0.01) and PECAM+ annexin V+ EMPs (r=0.36, p=0.001).
3,500 3,000 2,500 2,000 1,500
1,000
2.00 4.00 6.00 8.00 10.00 12.00
Square-root AHI Log-transformed PECAM+CD42-
3,500 3,000 2,500 2,000 1,500
1,000
2.00 4.00 6.00 8.00 10.00 12.00
Square-root AHI Log-transformed PECAM+annexin V+
Fig. 2. Correlations of carotid intima-media thickness (IMT) with obstructive sleep apnea severity and EMP levels. Apnea-hypopnea index (AHI) (r=0.71, p<0.001) and levels of PECAM+CD42- (r=0.27, p=0.01) and PECAM+annexin V+ EMPs (r=0.33, p=0.001) were correlated with IMT.
Square-root AHI Log-transformed PECAM+CD42- Log-transformed PECAM+annexin V+
10.00
3.000
3.500 8.00
2.500
3.000 6.00
2.000
2.000 2.500
4.00 1.500
2.00 1.000
0.00 1.500
0.500
0.400 0.500 0.600 0.700 0.800 0.400 0.500 0.600 0.700 0.800 0.400 0.500 0.600 0.700 0.800
Carotid IMT (mm) Carotid IMT (mm) Carotid IMT (mm)
μL, and from 21/μL to 92/μL); the residual AHI was 1.60 and 2.90, respectively, and the number of used-hours was 5 h 26 min and 6 h 15 min, respectively. No change was noted in any of the other parameters.
Discussion
The study findings can be summarized as follows: 1) EMP lev- els were higher in OSA than in non-OSA subjects, but the EPC index did not differ, 2) the EMP level (PECAM+CD42-, PE- CAM+ annexin V+) was correlated with AHI, 3) the carotid IMT was parallel with OSA severity, and with levels of PECAM+- CD42- and PECAM+annexin V+ EMPs, and 4) CPAP treatment reduced the levels of E-selectin+ EMPs.
Endothelial damage is one of the linking mechanisms be- tween OSA and cardiovascular diseases.31 The present study
found that overproduced EMPs and a thick IMT supports the endothelial pathology observed in OSA. The release of mic- roparticles is triggered by various activating or apoptotic sig- nals including cytokines, toxins, hypoxia, or shear stress.6 In OSA, repetitive cycles of hypoxia and reoxygenation caus- ing oxidative stress are cues for EMP release. A high oxida- tive stress state has been documented in OSA, and it can be normalized by effective CPAP treatment.32-34 Moreover, OSA leads to systemic inflammation, as evidenced by increased levels of inflammatory mediators or cytokines, such as of tu- mor necrosis factor-α, interleukin-6, C-reactive protein, nu- clear factor-κB (which is a proinflammatory transcription factor), and adhesion molecules including intercellular adhe- sion molecule-1 and E-selectin.5,34-36 Inflammation plays a central role not only in the development of atherosclerosis, but also in the formation of EMPs.6,37,38 This explains the sig- nificant correlations between OSA severity and levels of PE- CAM+CD42- and PECAM+annexin V+ EMPs, and carotid IMT.
E-selectin+ was also higher in the OSA group. The role of OSA in the production of EMPs was also supported by the subgro- up analysis in subjects free from other vascular risk factors. Le- vels of PECAM+CD42- EMPs were higher in OSA subjects than in non-OSA subjects. However, the small sample may have been responsible for the absence of statistically significant differences in the other EMP levels.
A different subset of antigen expressions on EMPs in vitro was documented depending on the stimulus type (i.e., apop- totic or activation).39 Destructive injury, as an apoptotic sig- nal, induced the expression of PECAM+CD42- and PECAM+ annexin V+ EMPs, and tumor necrosis factor-α, as an activat- ing signal, increased that of E-selectin+ EMPs.39 A potential difference in the biologic significance of EMP subtypes was suggested.40,41 In this study, levels of PECAM+CD42- EMPs were correlated with those of PECAM+annexin V+ EMPs (r=0.89, p<0.001), suggesting a common pathophysiology- Table 3. Effect of continuous positive airway pressure (CPAP) therapy on clinical status and blood endothelial markers
Before CPAP After CPAP p
AHI 47.1±21.4 4.2±2.2 <0.001*
BMI (kg/m2) 27.0±2.70 27.9±3.0 0.84*
ESS score 9.9±5.4 7.6±3.8 0.04*
SBP (mmHg) 128.0±17.40 127.4±12.1 0.85*
DBP (mmHg) 82.6±12.0 78.7±7.0 0.07*
CFU 38.5±21.3 35.7±21.0 0.68*
PECAM+CD42– EMP (/μL) 114 (75-300) 119 (86-171) 0.44*
PECAM+annexin V+ EMP (/μL) 152 (72-303) 138 (86-207) 0.51*
E-selectin+ EMP (/μL) 130 (79-311) 44 (25-77) <0.001*
Data are mean±standard deviation or median (interquartile range) values, depending on the data distribution. EMP values were log- transformed before statistical analysis.
*p<0.05, paired t-test.
AHI: apnea-hypopnea index, BMI: body mass index, ESS: Epworth Sleepiness Scale, SBP: systolic blood pressure, DBP: diastolic blood pressure, CFU: colony-formingunits, PECAM: platelet endothelial cell adhesion molecule, EMPs: endothelial microparticles.
3.000
2.500
2.000
1.500
1.000
Before CPAP After CPAP
E-selectin+ EMP
Fig. 3. Blood E-selectin+ EMPs in 21 patients with obstructive sleep apnea before and after continuous positive airway pressure thera- py. Changes in the log-transformed value of E-selectin+ EMPs are shown (p<0.001).
apoptosis. Endothelial apoptosis in OSA was demonstrated previously by measuring circulating apoptotic endothelial cells.42 Furthermore, the levels of PECAM+CD42- and PECAM+ annexin V+ EMPs paralleled the degree of atherosclerosis re- vealed by measuring carotid IMT (Fig. 2). Our findings sug- gest that OSA contributes to endothelial apoptosis and even- tually predisposes to atherosclerosis.
Levels of E-selectin+ EMPs were higher in OSA but were not correlated with OSA severity (Table 1 and 2). The plateau- ing of E-selectin+ EMP levels may explain the lack of corre- lation. The dose-dependency between soluble plasma E-se- lectin and severity indices was not consistent in a previous study.43 However, the reduction in E-selectin+ EMP levels af- ter CPAP supports the idea that OSA has a significant impact on it. As with E-selectin+, levels of soluble E-selectin reduced after CPAP.44 A reversible change in EMP levels was docu- mented in both in vitro and in vivo studies.11,45 The temporary change in EMP levels and flow-mediated dilatation effected by a brief exposure to second-hand smoking supports not only its reversibility, but also its correlation with endothelial function.11
CPAP only reduced E-selectin+ EMP levels. Neither PECAM+ nor annexin V+ EMPs levels were altered by CPAP therapy lasting more than 4 weeks, with a residual AHI of less than 10. Although the metabolism of various EMPs is unclear, a lo- nger half-life or a decreased clearance may contribute to per- sistently high PECAM+ and annexin V+ expressions. Follow- up after prolonged (>6 weeks) treatment may provide an explanation for this. Moreover, coexisting vascular risk, es- pecially being overweight, might contribute to the resistant overproduction of other EMPs. With regard to metabolic syn- drome, levels of PECAM+ and annexin V+ EMPs were higher in OSA subjects than in non-OSA subjects, whereas those of E- selectin+ EMPs were not.41 Uncontrolled metabolic factors may underlie the dissociated CPAP response. BMI and blood pres- sure, which are major factors of metabolic syndrome, did not ch- ange significantly after CPAP therapy (Table 3). Regardless of the dissociation, reducing the expression of E-selectin+ may af- ford further vascular protection, because EMPs themselves are known to have an impact on endothelial function, coagu- lation, and inflammation.13-15
A recent study found no difference in the level of PECAM+ CD41- expression between OSA subjects and the matched- controls.19 The subjects included in that study were less sleepy. Nonsleepy OSA differs from sleepy OSA, but the me- chanisms underlying this condition are unclear.46 CPAP exerts a less favorable effect on nonsleepy OSA.47,48 In contrast, sleepiness is a predictor of blood pressure lowering and insu- lin resistance.49,50 Therefore, the EMP levels measured in this study would better represent the situation in real-life OSA.
EPC index was not different between OSA and non-OSA subjects, and was unaffected by treatment. Two previous stud- ies were unable to document a difference in the EPC level be- tween OSA and control subjects.21,23 Although EPC levels are inversely correlated with cumulative cardiovascular risk, cir- culating EPC levels are known to change in a time-dependent manner.16,51 Acute vascular events initiate the recruitment of EPCs from the bone marrow, but EPC levels normalize in the chronic phase.51 OSA is a chronic condition, and hence EPC levels might not differ between OSA and non-OSA subjects.
Furthermore, coexisting vascular risk factors in both groups may have a more prominent effect on EPC level.
Our study had several limitations. Strictly speaking, as controls, the non-OSA group was not a predefined matched control from the general population, but rather constituted a group of subjects who had primary snoring without signifi- cant apneas on polysomnography. This may have biased the results. In addition, the treatment response was not addressed in a randomized fashion, but was only observed in a small (25.6%) proportion of subjects, because the Korean National Insurance scheme does not reimburse for CPAP therapy. An- other limitation is that the measurement of EPC has not yet been standardized. EPC can be measured by flow cytometry or cell culture.52 The number of CFU in cell cultures has been shown to be related to the cumulative vascular risk.16,17 How- ever, there is emerging evidence that EPCs defined by this method are not sufficient to give rise to an endothelial proge- ny.52 Although this study is the first to measure EPC levels with CFU, we cannot draw a firm conclusion about the involvement of EPCs in OSA. One study has demonstrated a reversible in- crease in EPC levels in OSA after CPAP treatment using flow cytometry.22 We have documented the overproduction of EMPs, which reflects the endothelial damage observed in OSA. Moreover, levels of apoptotic EMPs were correlated with carotid atherosclerosis, and CPAP therapy reduced E-selec- tin+ expression. Based on these findings, we conclude that endo- thelial damage is a linking mechanism between OSA and ac- celerated atherosclerosis, and that CPAP therapy may be effective in reversing endothelial activation and removing the undesirable effects of EMPs.
Conflicts of Interest
The authors have no financial conflicts of interest.
Acknowledgements
This research was supported by the Stem Cell Research Center of the 21st Century Frontier Research Program funded by the Ministry of Sci- ence and Technology, Republic of Korea (#SC4120).
REFERENCES
1. Kim J, In K, Kim J, You S, Kang K, Shim J, et al. Prevalence of sleep-
disordered breathing in middle-aged Korean men and women. Am J Respir Crit Care Med 2004;170:1108-1113.
2. Young T, Palta M, Dempsey J, Skatrud J, Weber S, Badr S. The occur- rence of sleep-disordered breathing among middle-aged adults. N Engl J Med 1993;328:1230-1235.
3. Somers VK, White DP, Amin R, Abraham WT, Costa F, Culebras A, et al. Sleep apnea and cardiovascular disease: an American Heart As- sociation/american College Of Cardiology Foundation Scientific State- ment from the American Heart Association Council for High Blood Pressure Research Professional Education Committee, Council on Clinical Cardiology, Stroke Council, and Council On Cardiovascular Nursing. In collaboration with the National Heart, Lung, and Blood Institute National Center on Sleep Disorders Research (National Insti- tutes of Health). Circulation 2008;118:1080-1111.
4. Ip MS, Tse HF, Lam B, Tsang KW, Lam WK. Endothelial function in obstructive sleep apnea and response to treatment. Am J Respir Crit Care Med 2004;169:348-353.
5. Minoguchi K, Yokoe T, Tazaki T, Minoguchi H, Tanaka A, Oda N, et al. Increased carotid intima-media thickness and serum inflammatory markers in obstructive sleep apnea. Am J Respir Crit Care Med 2005;
172:625-630.
6. Boulanger CM, Amabile N, Tedgui A. Circulating microparticles: a po- tential prognostic marker for atherosclerotic vascular disease. Hyper- tension 2006;48:180-186.
7. Jung KH, Chu K, Lee ST, Park HK, Bahn JJ, Kim DH, et al. Circulat- ing endothelial microparticles as a marker of cerebrovascular disease.
Ann Neurol 2009;66:191-199.
8. Preston RA, Jy W, Jimenez JJ, Mauro LM, Horstman LL, Valle M, et al. Effects of severe hypertension on endothelial and platelet micropar- ticles. Hypertension 2003;41:211-217.
9. Pirro M, Schillaci G, Paltriccia R, Bagaglia F, Menecali C, Mannari- no MR, et al. Increased ratio of CD31+/CD42- microparticles to en- dothelial progenitors as a novel marker of atherosclerosis in hyper- cholesterolemia. Arterioscler Thromb Vasc Biol 2006;26:2530-2535.
10. Sabatier F, Darmon P, Hugel B, Combes V, Sanmarco M, Velut JG, et al. Type 1 and type 2 diabetic patients display different patterns of cel- lular microparticles. Diabetes 2002;51:2840-2845.
11. Heiss C, Amabile N, Lee AC, Real WM, Schick SF, Lao D, et al. Brief secondhand smoke exposure depresses endothelial progenitor cells activity and endothelial function: sustained vascular injury and blunt- ed nitric oxide production. J Am Coll Cardiol 2008;51:1760-1771.
12. Bernal-Mizrachi L, Jy W, Jimenez JJ, Pastor J, Mauro LM, Horstman LL, et al. High levels of circulating endothelial microparticles in pati- ents with acute coronary syndromes. Am Heart J 2003;145:962-970.
13. Boulanger CM, Scoazec A, Ebrahimian T, Henry P, Mathieu E, Ted- gui A, et al. Circulating microparticles from patients with myocardial infarction cause endothelial dysfunction. Circulation 2001;104:2649- 2652.
14. Mezentsev A, Merks RM, O’Riordan E, Chen J, Mendelev N, Goli- gorsky MS, et al. Endothelial microparticles affect angiogenesis in vitro: role of oxidative stress. Am J Physiol Heart Circ Physiol 2005;
289:H1106-H1114.
15. Bakouboula B, Morel O, Faure A, Zobairi F, Jesel L, Trinh A, et al. Pro- coagulant membrane microparticles correlate with the severity of pul- monary arterial hypertension. Am J Respir Crit Care Med 2008;177:
536-543.
16. Hill JM, Zalos G, Halcox JP, Schenke WH, Waclawiw MA, Quyyu- mi AA, et al. Circulating endothelial progenitor cells, vascular func- tion, and cardiovascular risk. N Engl J Med 2003;348:593-600.
17. Chu K, Jung KH, Lee ST, Park HK, Sinn DI, Kim JM, et al. Circulat- ing endothelial progenitor cells as a new marker of endothelial dys- function or repair in acute stroke. Stroke 2008;39:1441-1447.
18. Werner N, Kosiol S, Schiegl T, Ahlers P, Walenta K, Link A, et al. Cir- culating endothelial progenitor cells and cardiovascular outcomes. N Engl J Med 2005;353:999-1007.
19. Ayers L, Ferry B, Craig S, Nicoll D, Stradling JR, Kohler M. Circulat- ing cell-derived microparticles in patients with minimally symptom- atic obstructive sleep apnoea. Eur Respir J 2009;33:574-580.
20. Akinnusi ME, El Solh AA. Circulating endothelial microparticle lev- els and hemodynamic severity of pulmonary hypertension: is there a role for sleep apnea? Am J Respir Crit Care Med 2009;179:328-329.
21. de la Peña M, Barceló A, Barbe F, Piérola J, Pons J, Rimbau E, et al.
Endothelial function and circulating endothelial progenitor cells in patients with sleep apnea syndrome. Respiration 2008;76:28-32.
22. Jelic S, Padeletti M, Kawut SM, Higgins C, Canfield SM, Onat D, et al.
Inflammation, oxidative stress, and repair capacity of the vascular en- dothelium in obstructive sleep apnea. Circulation 2008;117:2270-2278.
23. Martin K, Stanchina M, Kouttab N, Harrington EO, Rounds S. Cir- culating endothelial cells and endothelial progenitor cells in obstruc- tive sleep apnea. Lung 2008;186:145-150.
24. Iber C, Ancoli-Israel S, Chesson A, Quan S. The AASM manual for the scoring of sleep and associated events: rules, terminology and tech- nical specifications. 1st ed. Westchester, Illinois: American Academy of Sleep Medicine, 2007.
25. Johns MW. A new method for measuring daytime sleepiness: the Ep- worth sleepiness scale. Sleep 1991;14:540-545.
26. WHO Expert Consultation. Appropriate body-mass index for Asian populations and its implications for policy and intervention strategies.
Lancet 2004;363:157-163.
27. Kloner RA, Rezkalla SH. To drink or not to drink? That is the question.
Circulation 2007;116:1306-1317.
28. Lee ST, Chu K, Jung KH, Kim DH, Kim EH, Choe VN, et al. Decrea- sed number and function of endothelial progenitor cells in patients with migraine. Neurology 2008;70:1510-1517.
29. Jy W, Horstman LL, Jimenez JJ, Ahn YS, Biró E, Nieuwland R, et al.
Measuring circulating cell-derived microparticles. J Thromb Hae- most 2004;2:1842-1851.
30. Won CH, Li KK, Guilleminault C. Surgical treatment of obstructive sleep apnea: upper airway and maxillomandibular surgery. Proc Am Thorac Soc 2008;5:193-199.
31. Lopez-Jimenez F, Sert Kuniyoshi FH, Gami A, Somers VK. Obstruc- tive sleep apnea: implications for cardiac and vascular disease. Chest 2008;133:793-804.
32. Christou K, Kostikas K, Pastaka C, Tanou K, Antoniadou I, Gourgou- lianis KI. Nasal continuous positive airway pressure treatment reduc- es systemic oxidative stress in patients with severe obstructive sleep ap- nea syndrome. Sleep Med 2009;10:87-94.
33. de Lima AM, Franco CM, de Castro CM, Bezerra Ade A, Ataíde L Jr, Halpern A. Effects of nasal continuous positive airway pressure treat- ment on oxidative stress and adiponectin levels in obese patients with obstructive sleep apnea. Respiration 2010;79:370-736.
34. Dorkova Z, Petrasova D, Molcanyiova A, Popovnakova M, Tkacova R. Effects of continuous positive airway pressure on cardiovascular risk profile in patients with severe obstructive sleep apnea and meta- bolic syndrome. Chest 2008;134:686-692.
35. Ohga E, Nagase T, Tomita T, Teramoto S, Matsuse T, Katayama H, et al. Increased levels of circulating ICAM-1, VCAM-1, and L-selectin in obstructive sleep apnea syndrome. J Appl Physiol 1999;87:10-14.
36. Ryan S, Taylor CT, McNicholas WT. Predictors of elevated nuclear factor-kappaB-dependent genes in obstructive sleep apnea syndrome.
Am J Respir Crit Care Med 2006;174:824-830.
37. Daniel L, Dou L, Berland Y, Lesavre P, Mecarelli-Halbwachs L, Dig- nat-George F. Circulating microparticles in renal diseases. Nephrol Dial Transplant 2008;23:2129-2132.
38. Lusis AJ. Atherosclerosis. Nature 2000;407:233-241.
39. Jimenez JJ, Jy W, Mauro LM, Soderland C, Horstman LL, Ahn YS.
Endothelial cells release phenotypically and quantitatively distinct mi- croparticles in activation and apoptosis. Thromb Res 2003;109:175-180.
40. Amabile N, Heiss C, Real WM, Minasi P, McGlothlin D, Rame EJ, et al. Circulating endothelial microparticle levels predict hemodynam-
ic severity of pulmonary hypertension. Am J Respir Crit Care Med 2008;177:1268-1275.
41. Arteaga RB, Chirinos JA, Soriano AO, Jy W, Horstman L, Jimenez JJ, et al. Endothelial microparticles and platelet and leukocyte activation in patients with the metabolic syndrome. Am J Cardiol 2006;98:70-74.
42. El Solh AA, Akinnusi ME, Baddoura FH, Mankowski CR. Endothe- lial cell apoptosis in obstructive sleep apnea: a link to endothelial dys- function. Am J Respir Crit Care Med 2007;175:1186-1191.
43. El-Solh AA, Mador MJ, Sikka P, Dhillon RS, Amsterdam D, Grant BJ.
Adhesion molecules in patients with coronary artery disease and mod- erate-to-severe obstructive sleep apnea. Chest 2002;121:1541-1547.
44. Chin K, Nakamura T, Shimizu K, Mishima M, Miyasaka M, Ohi M.
Effects of nasal continuous positive airway pressure on soluble cell ad- hesion molecules in patients with obstructive sleep apnea syndrome.
Am J Med 2000;109:562-567.
45. Tramontano AF, O’Leary J, Black AD, Muniyappa R, Cutaia MV, El- Sherif N. Statin decreases endothelial microparticle release from hu- man coronary artery endothelial cells: implication for the Rho-kinase pathway. Biochem Biophys Res Commun 2004;320:34-38.
46. Montserrat JM, Garcia-Rio F, Barbe F. Diagnostic and therapeutic ap- proach to nonsleepy apnea. Am J Respir Crit Care Med 2007;176:6-9.
47. Barbé F, Mayoralas LR, Duran J, Masa JF, Maimó A, Montserrat JM, et al. Treatment with continuous positive airway pressure is not effec- tive in patients with sleep apnea but no daytime sleepiness. a random- ized, controlled trial. Ann Intern Med 2001;134:1015-1023.
48. Robinson GV, Smith DM, Langford BA, Davies RJ, Stradling JR.
Continuous positive airway pressure does not reduce blood pressure in nonsleepy hypertensive OSA patients. Eur Respir J 2006;27:1229- 1235.
49. Barceló A, Barbé F, de la Peña M, Martinez P, Soriano JB, Piérola J, et al. Insulin resistance and daytime sleepiness in patients with sleep apnoea. Thorax 2008;63:946-950.
50. Robinson GV, Langford BA, Smith DM, Stradling JR. Predictors of blood pressure fall with continuous positive airway pressure (CPAP) treatment of obstructive sleep apnoea (OSA). Thorax 2008;63:855-859.
51. Massa M, Rosti V, Ferrario M, Campanelli R, Ramajoli I, Rosso R, et al. Increased circulating hematopoietic and endothelial progenitor cells in the early phase of acute myocardial infarction. Blood 2005;
105:199-206.
52. Hirschi KK, Ingram DA, Yoder MC. Assessing identity, phenotype, and fate of endothelial progenitor cells. Arterioscler Thromb Vasc Biol 2008;28:1584-1595.