ARTICLE
Int J Thyroidol 2017 May 10(1): 24-35 https://doi.org/10.11106/ijt.2017.10.1.24Received November 25, 2016 / Revised February 15, 2017 / Accepted February 20, 2017
Correspondence: Yong Joon Suh, MD, CPBMI, Cancer Research Institute, Myongji Hospital, 55 Hwasu-ro 14beon-gil, Deokyang-gu, Goyang 10475, Korea
Tel: 82-31-810-5427, Fax: 82-31-969-0500, E-mail: [email protected]
Copyright ⓒ 2017, the Korean Thyroid Association. All rights reserved.
This is an open-access article distributed under the terms of the Creative Commons Attribution Non-Commercial License (http://creative- commons.org/licenses/by-nc/4.0/), which permits unrestricted non-commercial use, distribution, and reproduction in any medium, provided the original work is properly cited.
The Cancer Genome Atlas Validation of
Ancillary Tests for Classifying Papillary Thyroid Carcinoma
Yong Joon Suh
1,2, Hyoun Jong Moon
2, Ji-Young Choe
3and Hyo Jin Park
4Department of Surgery, Hallym University Sacred Heart Hospital, Hallym University College of Medicine1, Anyang, Cancer Research Institute, Myongji Hospital2, Goyang, Department of Pathology, Hallym University Sacred Heart Hospital, Hallym University College of Medicine3, Anyang, Department of Pathology, Seoul National University Bundang Hospital4, Seongnam, Korea
Background and Objectives: Ancillary tests such as BRAFV600E mutation or immunohistochemical (IHC) assays have been utilized as complements to morphological criteria in diagnosing subsets of papillary thyroid carcinoma (PTC). Utilizing results from analysis by The Cancer Genome Atlas (TCGA), we evaluated the diagnostic value and feasibility of these ancillary tests in diagnosing follicular variant PTC (FVPTC). Materials and Methods: Clinical data and tissue samples were analyzed from 370 PTC patients, who had undergone thyroidectomy between December 2003 and July 2014. PTC was limited to conventional PTC (CVPTC), tall cell variant PTC (TCPTC), and FVPTC. Using multivariate analyses, FVPTC cases were compared to CVPTC and TCPTC cases. Surgical specimens were pyrosequenced for BRAFV600E mutation or stained for IHC markers such as CD56, galectin-3, cytokeratin 19 (CK19), or CD31. For the validation, a comprehensive analysis was performed for BRAFV600E mutation and quantitative mRNA expressional difference in TCGA. Results: Demographic differences were not observed between 159 CVPTC, 103 TCPTC, and 108 FVPTC cases. BRAFV600E mutation predominated in CVPTC+TCPTC group, but not in FVPTC group (78.4% vs. 18.7%, p<0.001), as suggested by TCGA (57.4%
vs. 12.1%, p<0.0001). IHC markers significantly distinguished FVPTC cases from CVPTC+TCPTC cases. CD56 exhibited more intense staining in FVPTC cases (21.1% vs. 72.0%, p<0.001). Galectin-3 and CK19 yielded limited values. CD31 correlated with lymphovascular invasion (r=0.847, p<0.001). In analysis of TCGA, mRNA differential expression of these genes revealed their corresponding upregulation or downregulation. Conclusion: BRAFV600E mutation or TCGA-validated IHC assay could be recommended as ancillary tests for classifying PTC.
Key Words: BRAF, Immunohistochemistry marker, Thyroid neoplasm, Follicular variant papillary thyroid carcinoma, TCGA
Introduction
The incidence of thyroid cancer in South Korea in- creased during the 1990s, and after the turn of the century, the incidence increased rapidly.1) Papillary thyroid carcinoma (PTC), which is the most common type of thyroid cancer, exhibits neoplastic papillae and
nuclear features.2) Neoplastic papillae contain central fibro-vascular cores lined by layers of cells with crowded oval nuclei. The nucleus appearance, which is a diagnostic feature of the tumor, has been de- scribed as clear, ground glass, empty, or Orphan Annie-eye.
PTC has several types, which vary in their aggres- siveness. Follicular variant PTC (FVPTC) is regarded
Fig. 1. Study design flow dia- gram. CVPTC: conventional papillary thyroid carcinoma, FVPTC: follicular variant pa- pillary thyroid carcinoma, ICD:
international classification of diseases, IHC: immunohisto- chemical, TCPTC: tall cell variant papillary thyroid ca- rcinoma
as less aggressive; it is the most common PTC subset. FVPTC exhibits the overall follicular structure and nuclear features of PTC.3) Histological evaluation of surgically resected follicular patterned lesions can be challenging.4,5) The diagnosis of FVPTC is definitive if the nuclear features are characteristic, or if the growth pattern is noncircumscribed and infiltrative.
Many of these tumors, however, are circumscribed or even encapsulated. Infrequently, an encapsulated le- sion with a follicular growth pattern has some, but not all, of the nuclear features diagnostic of PTC. Poor di- agnostic agreement is a serious issue of diagnostic reproducibility. It has been reported that among path- ologists there exists inter-observer and intra-observer variability.6,7)
Proper diagnosis is directly linked to proper man- agement and follow-up. Therefore, ancillary techni- ques, such as BRAFV600E mutation analysis or immu- nohistochemical (IHC) assay, have been widely utilized to classify thyroid neoplasms, as an adjunct to the morphological criteria. The reported diagnostic values of ancillary tests vary widely between institutions.
Few appropriate methods are available to assess diagnostic value. The Cancer Genome Atlas (TCGA;
http://cancergenome.nih.gov), a recently developed public oncogenomics data platform, may enable vali-
dation of these diagnostic parameters. TCGA consists of sequencing, mutation, DNA methylation, copy- number variation, mRNA expression, reverse phase protein array (RPPA), and clinical information. Quanti- tative analysis of TCGA may help assess an ancillary test for the value that it adds. The present study as- sesses the diagnostic value of ancillary PTC-related assays for BRAFV600E, CD56, galectin-3, CK19, and CD31 in diagnosing FVPTC.
Materials and Methods
Study Design and Patient Selection
Informed consent was obtained from all individual participants included in the study. Demographics, pathologic assessments, BRAFV600E mutation analysis reports, and immunoreactivity results were obtained in accordance with the protocols of the Seoul National University Bundang Hospital (Gyeonggi-do, Korea) Institutional Review Board (No. B-1408/262-116) and the ethical standards of the 1964 Helsinki declaration and its later amendments or comparable ethical stan- dards. A retrospective electronic record review was conducted for the present study. We reviewed records for 370 PTC patients, who had undergone thyroi-
dectomy between December 2003 and July 2014 (Fig. 1). Conventional PTC (CVPTC), tall cell variant PTC (TCPTC), and FVPTC were included, which ac- count for the major proportion of PTC cases. Ancillary tests were limited to BRAFV600E mutation analysis and IHC assay (CD56, Galectin-3, CK19, and CD31) in surgical specimens. Specimens with mixed histology or multifocality were excluded. The diagnosis of CVPTC was based on the presence of papillary structures with fibro-vascular cores and specific nu- clear features typical of PTC. TCPTC is recognized as more aggressive.3) TCPTC cells are 3 times as tall as they are wide. Criteria require at least 50% of the cells to exhibit this height feature.2) FVPTC was diagnosed based on the presence of a follicular growth pattern with specific nuclear features. Tumors with over 1%
papillary formations were excluded from FVPTC diagnosis. Tumors were staged according to the 7th edition of the American Joint Committee on Cancer (AJCC) staging system.
BRAFV600E Mutation Analysis
BRAFV600E mutation analysis was performed for tu- mors that were suspected to be malignant based on their microscopic morphology. The target locus was marked on the formalin-fixed paraffin-embedded tis- sue, and microdissected for DNA extraction from 10- μm thick unstained sections. Thirty microliters of DNA extraction buffer (Bio-Rad, Hercules, CA, USA) was added to the scraped cells; the mixture was in- cubated at 56oC for 30 min. After incubation, the tubes were heated to 100oC for 10 min, and subsequently centrifuged at 12,000 rpm, to pellet the debris. The supernatant (5 μL) was used in a polymerase chain reaction (PCR). The PCR reaction contained forward and reverse primers (1 μL of each 20 pM primer), deoxynucleotide triphosphate mixture (0.4 μL of 25 mM dNTP), MgCl2 (1.5 μL of 50 nM), 5 μL of 10×
PCR buffer, 1.5 U of Taq DNA polymerase (Qiagen, Valencia, CA, USA), and 5 μL genomic DNA, in a to- tal volume of 50 μL. Exon 15 of the BRAF gene was amplified using a primer set for 40 cycles of PCR. The products were separated by electrophoresis in a 2%
agarose gel, and subjected to further gel purification.
All amplicons were pyrosequenced using a PyroMark Q24-MDx (Qiagen, CA).
Immunohistochemistry
The most representative areas of tumor tissues with adjacent normal parenchyma blocks were selected for immunohistochemical evaluation. Immunohistochemical staining was applied to 3-μm thin sections. The for- malin-fixed paraffin-embedded tissue sections were applied to polylysine coated slides (Menzel Gmbh and Co KG, Braunschweig, Germany), and dried at 60oC for at least 2 h. Deparaffinization and antigen exposure were performed in an automated immunohistoche- mical staining processor (Ventana Benchmark XT, Ventana Medical Systems, Tucson, AZ, USA). IHC as- say was performed using antibodies of CD56 (123C3, mouse monoclonal, pre-diluted, Ventana Medical Systems), galectin-3 (9C4, mouse monoclonal, 1:50, Leica Biosystems, Newcastle, UK), CK19 (RCK108, mouse monoclonal, 1:150, DAKO, Glostrup, Denmark), or CD31 (JC70A, mouse monoclonal, 1:100, DAKO).
Using an ultraView Universal DAB Detection Kit (Ventana Medical Systems), the complex was visuali- zed under light microscopy.
Immunohistochemical Assessment
The stained slides were independently examined by two pathologists. Immunoreactivity was considered positive when membranous CD56 expression was lost or predominantly cytoplasmic and/or membrane ex- pression of Galectin-3 and CK19 was observed in over 10% of tumor cells (Fig. 2). The immunoreactivity was graded as weak when 10-49% of tumor cells were positive and strong when 50-100% of tumor cells were positive. CD31, an endothelial marker, was used to evaluate tumor microvessel density. Immuno- reactivity of CD31 was considered positive when over 10% of tumor cells were stained.
TCGA Validation
As of July 2014, TCGA had acquired multigenomic analyses of 538 thyroid samples. Clinical information, mutation status, and a 20,531 gene expression data- set of normalized RNA-sequencing mRNA read counts
Fig. 2. Immunohistochemical stains of CD56, Galetin-3, CK19, and CD31, grouped according to papillary thyroid carcinoma histology. CVPTC: conventional papillary thyroid carcinoma, FVPTC: follicular variant papillary thyroid carcinoma, TCPTC:
tall cell variant papillary thyroid carcinoma. As per Bioethics and Safety Act in Korea, the slides only within the valid storage period could be suggested in this figure.
were downloaded from TCGA. Somatic mutation calls were generated by the Broad Institute and the Baylor College of Medicine. Genome Analyzer System (Illumina Inc., San Diego, CA, USA) was used as a platform for DNA sequencing. The dataset was integrated into a table. The dataset contained 58 normal control sam- ples, 346 CVPTC samples, 35 TCPTC samples, and 99 FVPTC samples. Features including BRAFV600E mutation and mRNA expression read counts were re-
organized and compared according to their histology.
Statistics
The groups were compared using the Chi-square test, or Fisher’s exact test, for categorical data; or, Student’s t-test, or the Mann-Whitney U test, for con- tinuous data. For hierarchical clustering between two or more groups, a one way ANOVA test (or Kruskal- Wallis test) was conducted, to test mean difference.
Post-hoc test was followed for between-group analysis. To control covariates, the Cochran-Mantel- Haenszel test – or a linear logistic regression model, if the requisite homogeneity was not satisfied – was used in the analysis of stratified data. In two-tailed tests, p<0.05 was considered to indicate statistical significance. Statistical analyses were performed in SPSS version 21 (SPSS, Inc. Chicago, IL, USA).
Results
Clinical Characteristics
We analyzed the tissue samples and clinical data for 370 PTC patients, who underwent thyroidectomy between December 2003 and July 2014. Of these 370 patients, 72 were male (Table 1). The mean age was 48±12 years (minimum age, 14 years and max- imum age, 86 years). In demographics, no difference was found between the CVPTC, TCPTC, and FVPTC groups. In the surgical specimen analysis, the FVPTC group had a higher incidence of TNM stage I/II and a lower incidence of lymphovascular invasion (LVI) (p
<0.001). However, CVPTC and TCPTC had no dif- ferences in clinicopathologic characteristics (Supple- mentary Table 1). The CVPTC and TCPTC groups were combined into a single group (CVPTC+TCPTC) for comparison with FVPTC (Table 1).
Ancillary Tests
In ancillary tests, there was a significant difference between the three groups (p<0.001). This sig- nificance arises from the significantly rarer BRAFV600E mutation incidence in FVPTC relative to CVPTC and TCPTC; the FVPTC IHC assay results were also sig-
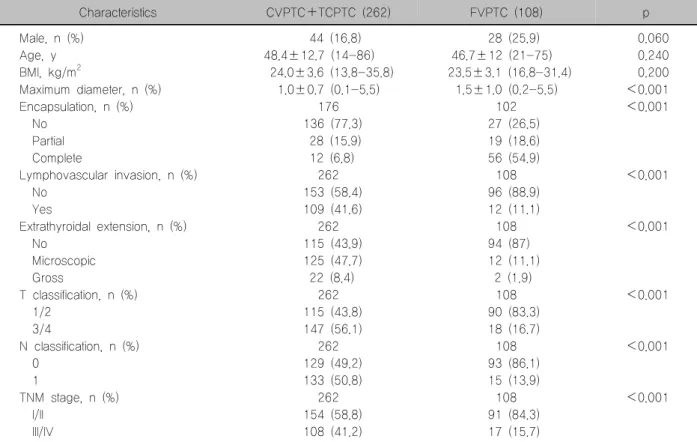
Table 1. Comparison of clinicopathologic characteristics between CVPTC+TCPTC and FVPTC
Characteristics CVPTC+TCPTC (262) FVPTC (108) p
Male, n (%) 44 (16.8) 28 (25.9) 0.060
Age, y 48.4±12.7 (14-86) 46.7±12 (21-75) 0.240
BMI, kg/m2 24.0±3.6 (13.8-35.8) 23.5±3.1 (16.8-31.4) 0.200
Maximum diameter, n (%) 1.0±0.7 (0.1-5.5) 1.5±1.0 (0.2-5.5) <0.001
Encapsulation, n (%) 176 102 <0.001
No 136 (77.3) 27 (26.5)
Partial 28 (15.9) 19 (18.6)
Complete 12 (6.8) 56 (54.9)
Lymphovascular invasion, n (%) 262 108 <0.001
No 153 (58.4) 96 (88.9)
Yes 109 (41.6) 12 (11.1)
Extrathyroidal extension, n (%) 262 108 <0.001
No 115 (43.9) 94 (87)
Microscopic 125 (47.7) 12 (11.1)
Gross 22 (8.4) 2 (1.9)
T classification, n (%) 262 108 <0.001
1/2 115 (43.8) 90 (83.3)
3/4 147 (56.1) 18 (16.7)
N classification, n (%) 262 108 <0.001
0 129 (49.2) 93 (86.1)
1 133 (50.8) 15 (13.9)
TNM stage, n (%) 262 108 <0.001
I/II 154 (58.8) 91 (84.3)
III/IV 108 (41.2) 17 (15.7)
BMI: body mass index, CVPTC: conventional papillary thyroid carcinoma, FVPTC: follicular variant papillary thyroid carcinoma, TCPTC: tall cell variant papillary thyroid carcinoma, TNM: tumor node mass
Table 2. Diagnostic values of ancillary tests differentiating FVPTC from CVPTC+TCPTC
Ancillary test CVPTC+TCPTC (262) FVPTC (108) p Sensitivity (%) Specificity (%)
BRAF mutation, n (%) 102 16 <0.001 78.4 81.3
Negative 22 (21.8) 13 (81.2)
V600E 80 (78.2) 3 (18.8)
CD56, n (%) 19 68 <0.001 78.9 72.1
Negative 15 (78.9) 19 (28.0)
Weak 3 (15.8) 37 (54.4)
Strong 1 (5.3) 12 (17.6)
Galectin-3, n (%) 26 100 <0.001 92.3 6.0
Negative 2 (7.7) 6 (6)
Weak 1 (3.8) 46 (46)
Strong 23 (88.5) 48 (48)
CK19, n (%) 23 98 <0.001 91.3 8.2
Negative 2 (8.7) 8 (8.2)
Weak 4 (17.4) 61 (62.2)
Strong 17 (73.9) 29 (29.6)
CD31, n (%) 218 60 0.001 37.6 85.0
Negative 136 (62.4) 51 (85.0)
Diffuse 82 (37.6) 9 (15.0)
CVPTC: conventional papillary thyroid carcinoma, FVPTC: follicular variant papillary thyroid carcinoma, TCPTC: tall cell variant papillary thyroid carcinoma
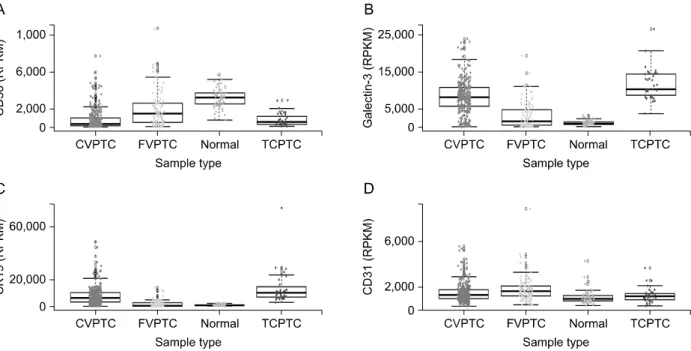
Fig. 3. (A-D) Boxplots of mRNA immunohistochemical markers grouped according to TCGA histology. CVPTC: conventional papillary thyroid carcinoma, FVPTC: follicular variant papillary thyroid carcinoma, RPKM: reads per kilobase per million formula, TCPTC: tall cell variant papillary thyroid carcinoma
Table 3. CD31 staining character versus presence of lym- phovascular invasion
Ancillary test Lymphovascular invasion
p Absent (249) Present (121)
CD31, n (%) 189 89 <0.001
Negative 179 (94.7) 8 (9.0) Diffuse 10 (5.3) 81 (91.0)
Table 4. BRAFV600E mutation status versus PTC type in TCGA Ancillary
test
CVPTC+TCPTC (380)
FVPTC
(99) p
BRAF mutation <0.0001
Negative 162 (42.6) 87 (87.9) V600E 218 (57.4) 12 (12.1)
CVPTC: conventional papillary thyroid carcinoma, FVPTC:
follicular variant papillary thyroid carcinoma, TCPTC: tall cell variant papillary thyroid carcinoma
nificantly different from those of CVPTC and TCPTC.
However, BRAFV600E mutation, CD56, Galectin-3, and CK19 were not significantly different between CPTC and TCPTC (Supplementary Table 2). For multivariate analyses, CVPTC and TCPTC were combined to con- duct a comparison with FVPTC (Table 2). These two groups had significant differences in BRAFV600E muta- tion incidence, CD56, Galetin-3, and CK19. Over 75%
of cases in the CVPTC+TCPTC group were positive for the BRAFV600E mutation; the corresponding statistic for the FVPTC group was less than 20%. The CD56 reverse immunoreactivity results were negative in over 75% of CVPTC+TCPTC cases, and less than 30% of FVPTC cases. When the immunoreactivity grading was not considered, CVPTC+TCPTC did not exhibit any difference from FVPTC in Galectin-3 or CK19
(p=1.000). CD31 depended on LVI rather than histol- ogy (Table 3). In multivariate analyses, we found no significant CD31 difference between CVPTC and TCPTC (p=0.066) or between CVPTC+TCPTC and FVPTC (p=0.206). However, CD31 was highly corre- lated with LVI (r=0.847, p<0.001).
TCGA Validation
BRAFV600E mutation results were validated using TCGA data. Over 50% of CVPTC or TCPTC cases were positive for the BRAFV600E mutation; we ob- served this mutation in only 12.1% of FVPTC cases (Supplementary Table 3). Even when CVPTC and TCPTC were combined for a comparison to FVPTC,
Table 5. Differentially expressed genes in 20,531 gene mRNA expression dataset for 555 TCGA samples (Threshold:
FDR-corrected p<0.01 and log2FC>1)
Ancillary test Gene Chr. Gene ontology DOWN UP
BRAFV600E* BRAF 7 Anti-apoptosis FVP CVN, TCV (TCV>CVN)
CD56 NCAM1 11 Cell adhesion CVN, TCV FVP
Galectin-3 LGALS3 14 ECM organization - CVN, TCV, FVP (CVN, TCV>FVP)
CK19 KRT19 17 Protein complex binding - CVN, TCV†
CD31 PECAM1 17 Cell adhesion - -
Chr.: chromosome, CVN: conventional papillary thyroid carcinoma, ECM: extracellular matrix, FC: fold change, FDR: false discovery rate, FVP: follicular variant papillary thyroid carcinoma, TCV: tall cell variant papillary thyroid carcinoma
*BRAFV600E mutation was compared between each pair of CVN, TCV, and FVP.
†No difference was found in between-group analysis.
Fig. 4. (A-D) Quantitative mRNA boxplots of immunohistochemical markers different between CVPTC+TCPTC and FVPTC, in The Cancer Genome Atlas (TCGA). CVPTC: conventional papillary thyroid carcinoma, FVPTC: follicular variant papillary thyroid carcinoma, RPKM: reads per kilobase per million formula, TCPTC: tall cell variant papillary thyroid carcinoma
there was a significant difference between the groups (p<0.001) (Table 4). To validate the IHC assay, genes corresponding to the IHC markers were selected from TCGA data. Next, we quantitatively compared mRNA expression levels between different histologic groups.
CVPTC and TCPTC were very similar in mRNA ex- pression (Fig. 3). For multivariate analyses, CVPTC and TCPTC were combined to compare with FVPTC (Fig. 4). There were statistically significant differences in all comparisons. In Table 5, upregulation and downregulation of mRNA expression was exhibited relative to normal control. CD56 was downregulated in CVPTC or TCPTC, which was upregulated in FVPTC.
In all histologies, Galectin-3 mRNA expression was high, although Galectin-3 mRNA expression levels in the CVPTC and TCPTC groups were significantly up- regulated relative to those of the FVPTC group. CK19 was upregulated in CVPTC and TCPTC, but in FVPTC CK19 did not differ from control. In the expression of CD31, no histology was significantly different from normal control. RPPA data also showed the consistent results.
Discussion
The present study evaluated ancillary techniques that have been utilized in diagnosing the major var-
iants of PTC. The BRAFV600E mutation predominated in the CVPTC+TCPTC group, in which CD56 exhibited a significant loss of expression. Galectin-3 and CK19 demonstrated stronger expression in CVPTC+TCPTC, although weak expression could be detected in FVPTC. The diagnostic outcome of each ancillary test, such as BRAFV600E mutation status or mRNA ex- pression level, was validated by the integrative analy- sis of TCGA data. In TCGA, over 50% of CVPTC or TCPTC cases were positive for the BRAFV600E muta- tion, while this mutation was observed in only 12.1%
of FVPTC cases. CD56 was upregulated in FVPTC, and downregulated in CVPTC and TCPTC. Galectin-3 was upregulated in all major PTC variants; upregula- tion of this product was significantly weaker in FVPTC.
Relative to the control group, CK19 was upregulated only in CVPTC or TCPTC; we observed no such CK19 change for the FVPTC group. Therefore, Galetin-3 and CK19 have limited value in classifying the major variants of PTC. CD31 exhibited significant upregulation and downregulation according not to histology, but rather to LVI.
BRAF is a RAS-regulated serine-threonine kinase and activator of the MAPK signaling cascade.8) The vast majority of its mutations occur in exon 15, causing valine to glutamic acid substitution at codon 600 (V600E). The detection of a BRAFV600E mutation is di- agnostic of malignancy. BRAFV600E mutation is helpful in a wide array of neoplasms, and is positive in about 45% of PTC cases.9) BRAFV600E mutation is predictive of CVPTC or TCPTC, but not FVPTC.10) In one analysis of PTC,11) the BRAFV600E mutation was observed in 55-75% of CVPTC cases, over 90% of TCPTC cases, and 5-10% of FVPTC cases, which is in general ac- cord with the results of the present study. Although BRAFV600E mutation detection is a gold standard of di- agnosis, this technique requires a DNA-based assay and quality control, which are not available at all hospitals. However, the BRAFV600E mutation-specific antibody is commercialized. The IHC detection of BRAFV600E mutation has demonstrated a high con- cordance with DNA-based methods.12) BRAFV600E mutation-specific antibody is promising because evi- dence is accumulating to suggest its usefulness.
IHC markers have been extensively explored.13-15) Recent studies have focused on identifying IHC mark- ers that can help in classifying thyroid neoplasm. The IHC marker CD56 is stained on cellular membrane;
CD56 expression is reduced or absent in thyroid carcinoma.16) El Demellawy et al.17) reported 100%
negativity in PTC. Multiple studies have since consid- ered CD56 a sensitive and specific marker for PTC.18-20) Nechifor-Boila et al.18) in their thyroid cancer registry review of 204 cases, found a more prominent loss of CD56 expression in CVPTC cases than in FVPTC cases. Galectin-3 has gained attention for dif- ferentiating benign from malignant thyroid lesions.21) CVPTC was also reported to stain stronger than FVPTC for Galectin-3.22) In TMA evaluation of 201 cases, Galectin-3 was a highly sensitive marker for malignancy.19) CK19 is the smallest member of the cytokeratin family, the upregulation of which is linked to neoplastic transformation.23) CVPTC is stained most prominently for CK19.19) FVPTC is stained weakly for CK19; the immunoreactivity grading of staining can enhance diagnostic accuracy.24) The expression of CD31 is correlated with aggressiveness, such as vascular invasion or lymph node metastasis.25) The results of our present clinical analysis are in close agreement with previous reports.
The present study has verified that FVPTC is a dis- tinct class of PTC. FVPTC emerged as a novel entity in 1977,26) in which neoplastic follicles exhibit nuclear features characteristic of PTC. This novel disease en- tity encountered doubts about the necessity of its existence.4,7,26) In the past, some FVPTC lesions were classified as follicular adenoma or follicular thyroid carcinoma.2) TCGA showed that FVPTC may need a pathologic reclassification.27,28) In TCGA analysis, CVPTC and TCPTC were BRAF-like tumors, whereas FVPTC was a RAS-like tumor. Based on the TCGA data showing that FVPTC had higher thyroid differ- entiation scores, Asa et al.26) proposed that the dis- tinction between FTC and FVPTC be considered.
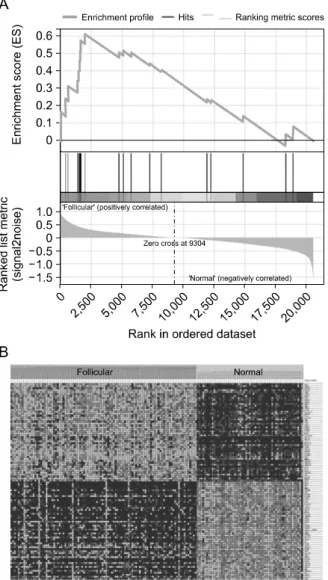
Additional comparative study of FTC and FVPTC would be worthwhile. In our Gene Set Enrichment Analysis based on TCGA mRNA expression level, FVPTC features were distinct from normal control fea-
Fig. 5. mRNA gene expression differences between follicular variant papillary thyroid carcinoma and normal TCGA samples (Threshold: FDR 25%). (A) Gene Set Enrichment Analysis, (B) Heat map of the top 50 features for each phenotype in gene expression data.
tures (Fig. 5). FVPTC, like CVPTC or TCPTC, exhibited upregulation of genes in chromosome 3q28 (p=
0.007843138) (Supplementary Table 4). Likewise, in the mRNA expression analysis of TCGA, FVPTC cases exhibited neoplastic alteration similar to those of CVPTC or TCPTC, which were different from those of the normal control group. However, the FVPTC mRNA expression levels were more indolent than those of CVPTC or TCPTC. These results correspond with an innovative concept suggested.29) They proposed re- naming encapsulated FVPTC to noninvasive follicular thyroid neoplasm with papillary-like nuclear features
(NIFTP). In encapsulated FVPTC, the deescalated treatment will reduce risk of complication from total thyroidectomy or secondary malignancy from radio- active iodine therapy.29) Ancillary techniques can be utilized to classify PTC for identifying NIFTP.
The present study has assessed the diagnostic value of clinically applied ancillary PTC diagnosis techniques. Previous studies of ancillary tests were limited by small sample size, lack of reliable data, and vague histologic classification. This study overcame these limitations, and revealed evidence for applying BRAFV600E mutation analysis or IHC using TCGA.
Furthermore, bioinformatics was utilized to explore the helpfulness of markers in pathologic diagnosis.
The present study had a few limitations. More di- verse ancillary techniques were not tested. Not all of the samples could be subjected to the same ancillary techniques. A combination of IHC markers was not considered for this reason. The mRNA expression analysis of TCGA could not extend to the protein anal- ysis, because TCGA protein data were limited. The current study suffered from the usual limitations of ob- servational studies.
Conflicts of Interest
The authors declare that they have no conflict of interest.
Acknowledgments
The Research Fund of Myongji Hospital (Goyang, Korea) supported this study (grant number 1601-01- 01). All statistical analyses were performed by the Medical Research Collaborating Center, Seoul National University Bundang Hospital (Gyeonggi-do, Korea).
The results reported here were based partly upon da- ta generated by the TCGA Research Network.
References
1) Ahn HS, Kim HJ, Welch HG. Korea's thyroid-cancer
"epidemic"--screening and overdiagnosis. N Engl J Med 2014;
371(19):1765-7.
2) LiVolsi VA. Papillary thyroid carcinoma: an update. Mod Pathol
2011;24 Suppl 2:S1-9.
3) Schneider DF, Chen H. New developments in the diagnosis and treatment of thyroid cancer. CA Cancer J Clin 2013;63(6):
374-94.
4) Salajegheh A, Petcu EB, Smith RA, Lam AK. Follicular variant of papillary thyroid carcinoma: a diagnostic challenge for clinicians and pathologists. Postgrad Med J 2008;84(988):78-82.
5) Chetty R. Follicular patterned lesions of the thyroid gland: a practical algorithmic approach. J Clin Pathol 2011;64(9):737-41.
6) Elsheikh TM, Asa SL, Chan JK, DeLellis RA, Heffess CS, LiVolsi VA, et al. Interobserver and intraobserver variation among experts in the diagnosis of thyroid follicular lesions with borderline nuclear features of papillary carcinoma. Am J Clin Pathol 2008;130(5):736-44.
7) Lloyd RV, Erickson LA, Casey MB, Lam KY, Lohse CM, Asa SL, et al. Observer variation in the diagnosis of follicular variant of papillary thyroid carcinoma. Am J Surg Pathol 2004;28(10):1336-40.
8) Xing M, Haugen BR, Schlumberger M. Progress in molecular-based management of differentiated thyroid cancer.
Lancet 2013;381(9871):1058-69.
9) Ritterhouse LL, Barletta JA. BRAF V600E mutation-specific antibody: A review. Semin Diagn Pathol 2015;32(5):400-8.
10) Cheng S, Serra S, Mercado M, Ezzat S, Asa SL. A high- throughput proteomic approach provides distinct signatures for thyroid cancer behavior. Clin Cancer Res 2011;17(8):2385-94.
11) Adeniran AJ, Zhu Z, Gandhi M, Steward DL, Fidler JP, Giordano TJ, et al. Correlation between genetic alterations and microscopic features, clinical manifestations, and prognostic characteristics of thyroid papillary carcinomas. Am J Surg Pathol 2006;30(2):216-22.
12) Capper D, Preusser M, Habel A, Sahm F, Ackermann U, Schindler G, et al. Assessment of BRAF V600E mutation status by immunohistochemistry with a mutation-specific monoclonal antibody. Acta Neuropathol 2011;122(1):11-9.
13) Wiseman SM, Melck A, Masoudi H, Ghaidi F, Goldstein L, Gown A, et al. Molecular phenotyping of thyroid tumors identifies a marker panel for differentiated thyroid cancer diagnosis. Ann Surg Oncol 2008;15(10):2811-26.
14) Zhao M, Wang KJ, Tan Z, Zheng CM, Liang Z, Zhao JQ.
Identification of potential therapeutic targets for papillary thyroid carcinoma by bioinformatics analysis. Oncol Lett 2016;11(1):
51-8.
15) Serra S, Asa SL. Controversies in thyroid pathology: the diagnosis of follicular neoplasms. Endocr Pathol 2008;19(3):
156-65.
16) Fadda G, Rossi ED. Immunohistochemical diagnosis of thyroid tumors. Surg Pathol Clin 2014;7(4):491-500.
17) El Demellawy D, Nasr A, Alowami S. Application of CD56,
P63 and CK19 immunohistochemistry in the diagnosis of papillary carcinoma of the thyroid. Diagn Pathol 2008;3:5.
18) Nechifor-Boila A, Borda A, Sassolas G, Hafdi-Nejjari Z, Borson-Chazot F, Lifante JC, et al. Immunohistochemical markers in the diagnosis of papillary thyroid carcinomas: The promising role of combined immunostaining using HBME-1 and CD56. Pathol Res Pract 2013;209(9):585-92.
19) Dunderovic D, Lipkovski JM, Boricic I, Soldatovic I, Bozic V, Cvejic D, et al. Defining the value of CD56, CK19, Galectin 3 and HBME-1 in diagnosis of follicular cell derived lesions of thyroid with systematic review of literature. Diagn Pathol 2015;10:196.
20) Alshenawy HA. Utility of immunohistochemical markers in diagnosis of follicular cell derived thyroid lesions. Pathol Oncol Res 2014;20(4):819-28.
21) Saleh HA, Jin B, Barnwell J, Alzohaili O. Utility of immuno- histochemical markers in differentiating benign from malignant follicular-derived thyroid nodules. Diagn Pathol 2010;5:9.
22) Barut F, Onak Kandemir N, Bektas S, Bahadir B, Keser S, Ozdamar SO. Universal markers of thyroid malignancies:
galectin-3, HBME-1, and cytokeratin-19. Endocr Pathol 2010;
21(2):80-9.
23) Sethi K, Sarkar S, Das S, Mohanty B, Mandal M. Biomarkers for the diagnosis of thyroid cancer. J Exp Ther Oncol 2010;
8(4):341-52.
24) Isic Dencic T, Cvejic D, Paunovic I, Tatic S, Havelka M, Savin S. Cytokeratin19 expression discriminates papillary thyroid carcinoma from other thyroid lesions and predicts its aggressive behavior. Med Oncol 2013;30(1):362.
25) Lee SH, Lee SJ, Jin SM, Lee NH, Kim DH, Chae SW, et al. Relationships between lymph node metastasis and expression of CD31, D2-40, and vascular endothelial growth factors A and C in papillary thyroid cancer. Clin Exp Otorhinolaryngol 2012;5(3):150-5.
26) Asa SL, Giordano TJ, LiVolsi VA. Implications of the TCGA genomic characterization of papillary thyroid carcinoma for thyroid pathology: does follicular variant papillary thyroid carcinoma exist? Thyroid 2015;25(1):1-2.
27) Cancer Genome Atlas Research Network. Integrated genomic characterization of papillary thyroid carcinoma. Cell 2014;159(3):
676-90.
28) Giordano TJ. Follicular cell thyroid neoplasia: insights from genomics and The Cancer Genome Atlas research network. Curr Opin Oncol 2016;28(1):1-4.
29) Nikiforov YE, Seethala RR, Tallini G, Baloch ZW, Basolo F, Thompson LD, et al. Nomenclature revision for encapsulated follicular variant of papillary thyroid carcinoma: a paradigm shift to reduce overtreatment of indolent tumors. JAMA Oncol 2016;2(8):1023-9.
Supplementary Table 1. Comparison of clinicopathologic characteristics between CVPTC and TCPTC
Characteristics CVPTC (159) TCPTC (103) p
Male, n (%) 26 (16.4) 18 (17.5) 0.945
Age, y 49.5±11.9 (26-83) 46.6±13.7 (14-86) 0.065
BMI, kg/m2 23.8±3.4 (13.8-34.9) 24.3±3.9 (17.1-35.8) 0.245
Max. diameter, n (%) 0.9±0.5 (0.1-2.8) 1.3±0.9 (0.4-5.5) <0.001
Encapsulation, n (%) 112 64 0.182
No 82 (73.2) 54 (84.4)
Partial 22 (19.6) 6 (9.4)
Complete 8 (7.1) 4 (6.3)
Lymphovascular invasion, n (%) 159 103 0.002
No 105 (66.0) 48 (46.6)
Yes 54 (34.0) 55 (53.4)
Extrathyroidal extension, n (%) 159 103 0.056
No 77 (48.4) 38 (36.9)
microscopic 73 (45.9) 52 (50.5)
gross 9 (5.7) 13 (12.6)
T classification, n (%) 159 103 0.075
1/2 77 (48.5) 38 (36.9)
3/4 82 (51.6) 65 (63.1)
N classification, n (%) 159 103 0.148
0 84 (52.8) 45 (43.7)
1 75 (51.0) 58 (58.0)
TNM stage, n (%) 159 103 0.441
I/II 90 (56.6) 64 (62.1)
III/IV 69 (43.4) 39 (37.9)
BMI: body mass index, CVPTC: conventional papillary thyroid carcinoma, TCPTC: tall cell variant papillary thyroid carcinoma, TNM: tumor node mass
Supplementary Table 2. Diagnostic values of ancillary tests differentiating TCPTC from CVPTC
Ancillary test TCPTC (103) CVPTC (159) p Sensitivity (%) Specificity (%)
BRAF mutation, n (%) 50 52 0.114 86.0 28.8
Negative 7 (14.0) 15 (28.8)
V600E 43 (86.0) 37 (71.2)
CD56, n (%) 2 17 0.742 100.0 23.5
Negative 2 (100) 13 (76.5)
Weak 0 (0) 3 (17.6)
Strong 0 (0) 1 (5.9)
Galectin-3, n (%) 4 22 0.347 75.0 4.5
Negative 1 (25.0) 1 (4.5)
Weak 0 (0) 1 (4.5)
Strong 3 (75.0) 20 (90.9)
CK19, n (%) 3 20 0.544 100.0 10.0
Negative 0 (0) 2 (10.0)
Weak 0 (0) 4 (20.0)
Strong 3 (100) 14 (70.0)
CD31, n (%) 80 138 <0.001 52.5 71.0
Negative 38 (47.5) 98 (71.0)
Diffuse 42 (52.5) 40 (29.0)
CVPTC: conventional papillary thyroid carcinoma, TCPTC: tall cell variant papillary thyroid carcinoma
Supplementary Table 3. BRAFV600E mutation status versusTCGA histology
Ancillary test CVPTC (345) FVPTC (99) Normal (57) TCPTC (35) p
BRAF mutation <0.0001
Negative 154 (44.6) 87 (87.9) 57 (100.0) 8 (22.9)
V600E 191 (55.4) 12 (12.1) 0 (0) 27 (77.1)
CVPTC: conventional papillary thyroid carcinoma, FVPTC: follicular variant papillary thyroid carcinoma, TCPTC: tall cell variant papillary thyroid carcinoma
Supplementary Table 4. Gene set enrichment analysis of CVPTC versus normal, FVPTC versus normal, and TCPTC versus normal in TCGA (Threshold: FDR 25%)
CVPTC vs. normal FVPTC vs. normal TCPTC vs. normal
Down Up Down Up Down Up
Upregulated in class CVPTC FVPTC TCPTC
GeneSet CHR3Q28 CHR3Q28 CHR3Q28
ES 0.68492913 0.6115162 0.6303183
NES 1.9033238 1.8017814 1.7782005
Nominal p-value 0.001838235 0.007843138 0.0063158
FDR q-value 0.075719655 0.21197195 0.1819091
FWER p-value 0.122 0.307 0.254
Genes ETV5 ETV5 CLDN1
CLDN1 CLDN1 ETV5
IL1RAP HES1 IL1RAP
AP2M1 EIF4A2 AP2M1
MFI2 IL1RAP EIF4A2
MB21D2 AP2M1 MB21D2
EIF4A2 FGF12 MFI2
TPRG1 MB21D2 TPRG1
POLR2H HRASLS POLR2H
HES1 TPRG1 FXR1
TMEM207 POLR2H HRASLS
SST MFI2 TMEM207
FXR1 SST SST
FGF12 TMEM207 HES1
HRASLS FXR1 B3GNT5
B3GNT5 OPA1 OPA1
SENP2 SENP2 SENP2
OPA1 CCDC50 FGF12
CCDC50 B3GNT5 CCDC50
CVPTC: conventional papillary thyroid carcinoma, ES: enrichment score, FDR: false discovery rate, FVPTC: follicular variant papillary thyroid carcinoma, FWER: family-wise error rate, NES: normalized enrichment score, TCPTC: tall cell variant papillary thyroid carcinoma