INTRODUCTION
Insulin resistance (IR) is an important risk factor for the development of atherosclerosis and diabetes and also associ- ated with obesity and the metabolic syndrome (MetS). Altho- ugh the link between IR and obesity is not completely under- stood, recent findings suggest that a variety of fat-derived factors regulate IR (1). Among them, resistin has been sug- gested to decrease insulin sensitivity in vitro and in vivo in rodent animal models (2).
Resistin was cloned in 2001; it is a thiazolidinedione (TZD)- regulated cytokine expressed in adipose tissue (2). In animal studies, resistin has been shown to influence hepatic glucose and lipid metabolism (3, 4), and appears to be a major deter- minant of hepatic IR induced by a high-fat diet (5). Howev- er, the data on resistin in humans is conflicting. Some reports have shown that resistin levels are elevated in individuals with obesity and diabetes (6-8), whereas other investigators have
not confirmed these findings (9-11). These conflicting find- ings reflect variations in the study design and experimental conditions, but more importantly they may reflect the lack of adjustment for potential confounding factors such as gen- der, ethnicity, degree of obesity, and differences in fat distri- bution. Moreover, the role of the body fat mass and distribu- tion in determining the plasma levels of resistin has not yet been studied in humans.
The aim of this study was to determine the plasma levels of resistin in healthy subjects and subjects with MetS. In addi- tion, the correlation of resistin levels with clinical, laborato- ry, including the index of IR and determinants of MetS, and anthropometric parameters were evaluated.
MATERIALS AND METHODS
One hundred and twenty Korean men and 180 women,
695
Jong Chul Won1,*, Cheol-Young Park1, Won Young Lee1, Eon Sook Lee2, Sang Woo Oh3, and Sung Woo Park1
Department of Internal Medicine1, Sungkyunkwan University School of Medicine, Kangbuk Samsung Hospital, Seoul; Department of Family Medicine2, Center for Health Promotion, Ilsan-Paik Hospital, College of Medicine, Inje University, Goyang;
Department of Family Medicine3, Dongguk University International Hospital, Goyang, Korea
*Current address: Department of Internal Medicine, Sanggye Paik Hospital, Mitochondrial Research Group, Inje University College of Medicine, Seoul, Korea
Address for correspondence Cheol Young Park, M.D.
Department of Internal Medicine, Sungkyunkwan University School of Medicine, Kangbuk Samsung Hospital, Pyeong-dong, Jongno-gu, Seoul 110-746, Korea
Tel : +82.2-2001-2440, Fax : +82.2-2001-1588 E-mail : [email protected]
This study was supported by the Health Promotion Funds from the Ministry of Health & Welfare, Republic of Korea Government.
DOI: 10.3346/jkms.2009.24.4.695
Association of Plasma Levels of Resistin with Subcutaneous Fat Mass and Markers of Inflammation but not with Metabolic Determinants or Insulin Resistance
Received : 29 October 2007 Accepted : 22 August 2008 The aim of the present study was to investigate the relationship of plasma resistin
levels with determinants of the metabolic syndrome (MetS) and anthropometric param- eters in healthy Korean subjects. Plasma resistin levels were determined in 276 sub- jects. In subjects with MetS, the plasma resistin levels were not significantly increased compared to those without MetS (8.3±4.3 ng/mL vs. 8.5±3.6 ng/mL, respectively, P=0.84). In addition, the plasma resistin levels were not correlated with the body mass index, the waist circumference, homeostasis model assessment-insulin resis- tance (HOMA-IR), fasting plasma glucose or insulin levels. However, the plasma resistin levels were positively correlated with the abdominal subcutaneous fat (r=
0.18, P<0.01) in all subjects and correlated with TNF α(r=-0.16, P<0.05) and hsCRP (r=0.15, P<0.05) in subjects without MetS but not with MetS. With multiple linear regression analysis, these linear associations remained to be significant. The results of this study show that plasma resistin levels in humans were not associated with markers of insulin resistance, obesity or other determinants of the MetS.
Key Words : Resistin; Metabolic Syndrome; C-reactive Protein
who did not take any medication at the time of the study, and who have no known major illness, were recruited to par- ticipate in this study from 2005 through 2006. The institu- tional review board at the health promotion center at Ilsan- Paik Hospital in Korea approved the study protocol accord- ing to the Declaration of Helsinki. All subjects provided writ- ten informed consent to participate in the study.
Subjects completed a self-administered questionnaire that included demographic characteristics, general health status, smoking history, and current medications. Anthropometric and body composition measurements including heights, waist and hip-circumference were performed in all study partici- pants before breakfast, with the subject wearing light cloth- ing and without shoes. Their body mass index (BMI, kg/m2) was calculated as an index of their overall adiposity. The waist circumference was measured midway between the inferior margin of the last rib and the crest of the ileum in the hori- zontal plane. Hip circumference was measured around the pelvis at the point of maximal protrusion of the buttocks.
The circumference was measured to the nearest 0.1 cm. Blood pressure (BP) was measured from the right arm subsequent to the participant sitting at rest for a period of 20 min. The mean of two consecutive blood pressure recordings was used for statistical analysis. The total body fat and muscle were then measured by bioimpedance analysis (Inbody 3.0, Bio- space, Seoul, Korea). One observer performed all of the anthro- pometric and blood pressure measurements.
The total cross-sectional abdominal fat and abdominal vis- ceral tissue (VAT) areas were measured by computed tomog- raphy (CT) scans (Somatom Plus 4, Siemens, Forchheim, Germany) using an established protocol (12). A cross-sec- tional scan, with 10-mm thickness centered at the L4-L5 ver- tebral disc space, was obtained with the subject in the supine position using a radiograph of the skeleton as a reference; this was used to establish the position of the scans to the nearest millimeter. The abdominal subcutaneous tissue (SAT) area was calculated by subtracting the VAT area from the total area of adipose tissue. In addition, the body composition, in- cluding lean body mass and total body fat, was determined by a dual energy absorptiometry (DXA; QDR 4500, Holog- ic, Bedford, MA, U.S.A.) performed with a whole-body scan- ner. The trunk fat was determined as the amount of fat mea- sured by the DXA from below the neck to the pelvis, exclud- ing the limbs.
Blood samples were collected from all subjects after an over- night fast (10 hr) between 0830 and 1030 hr, and the sera were stored at -70℃until used. Fasting plasma glucose and lipids were measured enzymatically using an autoanalyzer (Hitachi 747, Hitachi Ltd., Tokyo, Japan). The plasma insulin levels were measured by radioimmunoassay (Hitachi E170, Hitachi Ltd.). The resistin was measured as previously des- cribed (7) and means of duplicated values were used in anal- ysis. The IR index calculated from the fasting plasma insulin and the plasma glucose levels was estimated by the homeosta-
sis model assessment (HOMA) where (13): HOMA=fasting plasma insulin (lU/mL)×fasting plasma glucose (mM/L)/
22.5. The presence of the MetS was determined according to the 2005 revised National Cholesterol Education Program (NCEP) Adult Treatment Panel III criteria (14). We defined central obesity as a waist circumference ≥90 cm for men or
≥80 cm for women as recommended by the revised NCEP criteria.
Statistical analysis
SPSS 12.0 software (SPSS Inc., Chicago, IL, U.S.A.) was used for statistical analysis. A P less than 0.05 were consid- ered statistically significant. Several variables were logarith- mically transformed to obtain a normal distribution. We used the independent-t tests to analyze differences in the body com- position and biochemical parameters between gender and between subjects without the MetS and those with the MetS.
We calculated partial correlation analysis and then performed multiple linear regression analyses. Analyses were controlled for potential confounders including age and gender. We used a one-way ANOVA with post hoc analysis to assess for differ- ences along the quartile hsCRP levels and the tertile of abdom- inal SAT.
RESULTS
After exclusion of six subjects (3 men and 3 women), because of incidentally detected diabetes, the analysis was restricted to 276 subjects (aged from 19 to 70 yr, mean 40±11 yr, men=108 and women=168) for whom resistin data was avail- able. BMI ranged from 17.6 to 33.2 kg/m2, with a mean value of 24.3±3.0 kg/m2. Table 1 summarizes the demographic, anthropometric and metabolic parameters of subjects enrolled in this study. The mean BMI was 25.3±2.6 kg/m2in men and 23.7±3.0 kg/m2in women. The finding of obesity was higher in men (54.6%: n=59, compared to women, 28.6%;
n=48, P<0.001). The waist circumference, waist-hip ratio (WHR), systolic and diastolic blood pressure, fasting plas- ma glucose, uric acid, total cholesterol, and triglyceride were significantly higher in men compared to women. The HDL- cholesterol was lower in men compared to women. In addi- tion, all anthropometric parameters were significantly high- er in men compared to women, except for the total abdomi- nal fat measured by CT and the fat mass in the trunk area measured by DXA. The plasma levels of TNF α, and high- sensitive C-reactive protein (hsCRP) were higher in men, but resistin was higher in women. Log transformed IL-6 level was significantly higher in women compared to men (-0.20±1.4 vs. 0.41±0.83, P<0.01). There were no significant differ- ences between men and women in fasting glucose, insulin and HOMA-IR.
The clinical, laboratory and anthropometric parameters
were compared between subjects without MetS (80.4%, n=
222) and those with MetS (19.6%, n=54) (Table 2). As expect- ed, all values of metabolic and anthropometric parameters were significantly different between the two groups. How- ever, the plasma levels of resistin were not significantly dif- ferent in comparisons between these two groups (8.3±4.3 vs. 8.5±3.6 ng/mL, respectively, P=0.278). The plasma lev- els of retinol binding protein 4 and hsCRP were significant- ly increased in subjects with MetS compared to those with- out MetS (52.4±20.1 vs. 64.3±26.2 μg/mL, 0.8±2.0 vs.
1.4±1.3 mg/L, respectively, P<0.01). The plasma levels of TNF αand log transformed IL-6 were increased in subjects with MetS but the differences did not reach statistical sig- nificance. In addition, adiponectin was increased in subjects without MetS but not in those with MetS (9.1±7.0 μg/mL vs.
5.2±3.5, respectively, P<0.001).
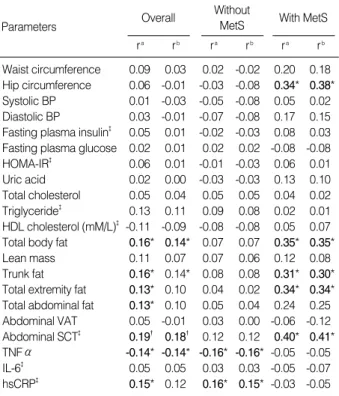
In order to evaluate potential relationships between plas- ma levels of resistin and clinical, laboratory and anthropomet- ric parameters, we performed a correlation analysis (Table 3).
The plasma resistin levels were significantly correlated with the age of subjects (Pearson’s correlation coefficient, r=0.15, P=0.019) and increased in women. Thus, the correlation of resistin levels with other metabolic and anthropometric param- eters was investigated with a partial correlation analysis adjust- ed for age and gender. We observed that the plasma levels of resistin were positively correlated with fat mass, measured by in-body impedance (data not shown), fat CT or DXA, especially with the fat mass in the extremities (r=0.13, P<
0.05) and the abdominal SCT (r=0.19, P<0.01). In addition, resistin was significantly correlated with the hsCRP (r=0.15, P<0.05). However, resistin was negatively correlated with the plasma levels of TNF α(r=-0.14, P<0.05). Furthermore, the plasma levels of resistin did not show any significant cor- relation with the BMI (r=0.09, P=0.152), waist circumfer- ence, waist-to-hip ratio, systolic and diastolic BP, plasma glu- cose, total cholesterol, triglycerides, and HDL-C (Table 3).
Moreover, no correlation of plasma levels of resistin was noted to be associated with the levels of fasting plasma insulin and
Data are means±SD. *P<0.05, �P<0.01.
MetS, metabolic syndrome; BMI, body mass index; WHR, waist-hip ratio;
BP, blood pressure; HOMA-IR, homeostasis model assessment-insulin resistance; HDL, high density lipoprotein; VAT, visceral adipose tissue;
SCT, subcutaneous adipose tissue; hsCRP, high-sensitive c-reactive protein.
Parameters Men (n=108,
39.1%)
Women, (n=168, 60.9%)
Age (yr) 40±11 40±10
Weight (kg) 74.1±9.6 59.4±7.5�
BMI (kg/m2) 25.3±2.6 23.7±3.0�
Obesity (n) 59 (54.6%) 48 (28.6%)�
Waist circumference (cm) 90.3±7.4 80.4±7.4� Hip circumference (cm) 101.8±4.8 97.8±5.6�
WHR 0.89±0.05 0.82±0.06�
Systolic BP (mmHg) 121.9±15.2 109.7±12.7� Diastolic BP (mmHg) 75.8±9.6 67.1±8.1� Fasting plasma insulin (pM/L) 40.9±27.6 38.9±29.0 Fasting plasma glucose (mM/L) 5.1±0.5 4.9±0.5�
HOMA-IR 1.28±0.88 1.18±0.94
Uric Acid (μM/L) 393.7±74.3 275.5±67.0� Total cholesterol (mM/L) 4.83±0.80 4.55±0.76� Triglyceride (mM/L) 2.25±1.51 1.39±0.82� HDL cholesterol (mM/L) 1.09±0.29 1.24±0.33� Total body fat (kg) 17.1±5.0 19.9±4.6�
Lean mass (kg) 53.8±5.9 37. 5±4.6�
Trunk fat (kg) 8.7±3.0 8.9±2.8
Total extremity fat (kg) 7.3±2.3 10.2±2.1� Total abdominal fat (cm2) 263.8±89.3 265.4±87.4 Abdominal VAT (cm2) 111.7±52.5 72.2±38.0� Abdominal SCT (cm2) 152.1±53.7 193.1±64.5�
TNF α(pg/mL) 7.96±1.30 7.22±1.29�
IL-6 (pg/mL) 1.49±1.09 1.84±0.88�
hsCRP (mg/L) 0.8±1.0 0.8±1.2
Fasting resistin (ng/mL) 7.5±4.2 8.9±4.1� Table 1. Clinical, laboratory and anthropometric characteristics of the study subjects according to gender
Data are means±SD. *P<0.01.
MetS, metabolic syndrome; BMI, body mass index; WHR, waist-hip ratio;
BP, blood pressure; HDL, high density lipoprotein; VAT, visceral adipose tissue; SCT, subcutaneous adipose tissue; hsCRP, high-sensitive c-reac- tive protein.
Those without MetS (n=222, 80.4%)
Those with MetS, (n=54, 19.6%)
Age (yr) 39±11 45±11*
Men (n, %) 71, 65.7 37, 34.3*
Weight (kg) 62.9±9.6 74.7±11.5*
BMI (kg/m2) 23.7±2.8 26.7±2.4*
Waist circumference (cm) 82.2±7.8 92.7±7.3*
Hip circumference (cm) 98.5±5.5 103.0±4.9*
WHR 0.83±0.06 0.90±0.05*
Systolic BP (mmHg) 111.7±13.4 126.3±15.6*
Diastolic BP (mmHg) 68.4±8.5 79.6±9.3*
Fasting plasma insulin (pM/L) 34.8±23.7 60.1±36.2*
Fasting plasma glucose (mM/L) 4.9±0.4 5.2±0.6*
HOMA-IR 1.05±0.74 1.93±1.20*
Uric Acid (μM/L) 309.6±86.4 370.8±91.8*
Total cholesterol (mM/L) 4.63±0.76 4.78±0.88 Triglyceride (mM/L) 1.37±0.71 3.17±1.71*
HDL cholesterol (mM/L) 1.24±0.31 0.95±0.24*
Total body fat (kg) 18.3±4.9 20.8±4.7*
Lean mass (kg) 42.2±8.5 50.5±10.4*
Trunk fat (kg) 8.4±2.7 10.6±2.6*
Total extremity fat (kg) 9.1±2.6 9.2±2.6 Total abdominal fat (cm2) 248.7±82.6 330.6±78.7*
Abdominal VAT (cm2) 76.5±39.6 133.5±53.4*
Abdominal SCT (cm2) 172.2±63.2 197.1±61.8*
TNF α(pg/mL) 7.45±1.33 7.76±1.34
IL-6 (pg/mL) 1.68±0.98 1.81±0.96
hsCRP (mg/L) 0.7±1.1 1.4±1.3*
Fasting resistin (ng/mL) 8.3±4.3 8.5±3.6 Table 2. Comparison of clinical, laboratory and anthropometric parameters between subjects without the metabolic syndrome and those with metabolic syndrome
Parameters
HOMA-IR. As well, plasma levels of IL-6, RBP4, adiponec- tin, and leptin were not significantly correlated with plasma resistin. After adjustment for obesity by BMI, these relation- ships remained significant, except for the total abdominal fat and fat mass in the extremities (Table 3). When a partial correlation analysis were performed in subjects without MetS, the plasma levels of resistin were positively correlated with the plasma hsCRP levels (r=0.16, P<0.05) and negatively correlated with the TNF α(r=-0.16, P<0.05). These obser- vations remained significant after adjustment for BMI. In subjects with MetS, plasma levels of resistin were positively correlated with the hip circumference, total body fat, trunk fat, extremity fat, leptin and strongly correlated with abdom- inal subcutaneous adipose tissue (SCT) (Table 3).
We performed a multiple linear regression analysis includ- ing the parameters, which were significantly correlated with the plasma resistin levels in all subjects and in subjects with/
without MetS (Table 4). In this analysis, we included only abdominal SCT because of the interdependence and multi-
colinearity among the variables associated with measurements of body fat mass. The results of this analysis showed that age (β=-0.20, P<0.01), abdominal SCT (β=0.26, P<0.01) and TNF α(β=-0.16, P<0.01) in all subjects; age (β=-0.19, P<
0.01), abdominal SCT (β=0.20, P<0.05), TNF α(β=-0.16, P<0.05), and hsCRP (β=0.16, P<0.05) in subjects without MetS and only abdominal SCT (β=0.57, P<0.01) in subjects with MetS were independent predictors of plasma resistin levels.
Fig. 1 shows that the plasma levels of resistin increased with hsCRP levels and abdominal SCT in subjects without MetS, however in the second and third tertile of the abdom- inal SCT, plasma levels of resistin were not significantly dif- ferent with increases in hsCRP levels.
*Logarithmic transformation performed before analysis.
β: Standardized coefficients.
MetS, metabolic syndrome; hsCRP, high-sensitive c-reactive protein; SCT, subcutaneous adipose tissue.
Without MetS
β P
With MetS
β P
Overall
β P
Age (yr) -0.12 <0.01 -0.19 0.01 -0.16 0.24 Abdominal SCT (cm2)* 0.26 <0.01 0.20 0.03 0.57 <0.01 TNF α(pg/mL) -0.16 0.01 -0.16 0.02 -0.19 0.15 hsCRP (mg/dL)* 0.12 0.07 0.16 0.03 -0.19 0.16 Table 4. Multiple linear regression analysis between plasma lev- els of resistin, transformed to log, and age, BMI, hsCRP, TNF α levels, fat mass in the abdominal subcutaneous tissue in all sub- jects and according to status of the metabolic syndrome
2.5 2.0 1.5 1.0 0.5 0.0
Fig. 1. Mean plasma levels of logarithmic transformed resistin along high-sensitive C-reactive protein (hsCRP) tertile and abdominal subcutaneous fat (SCT) quartile in subjects without the metabolic syndrome.
*P<0.05 vs. respective first quartile of hsCRP.
Logarithmic transformed resistin (ng/mL) 1st quartile hsCRP
2nd quartile hsCRP
3rd quartile hsCRP
3rd terile SCT 2nd terile
SCT 1st terile 4th SCT
quartile hsCRP
*P<0.05; �P<0.01; �Logarithmic transformation performed before analy- sis.
ra, after adjustment for age and sex; rb, after adjustment for age, gender and body mass index.
MetS, metabolic syndrome; BP, blood pressure; HOMA-IR, homeosta- sis model assessment-insulin resistance; HDL, high density lipoprotein;
VAT, visceral adipose tissue; SCT, subcutaneous adipose tissue; hsCRP, high-sensitive c-reactive protein.
Without MetS ra rb
With MetS ra rb Overall
ra rb
Waist circumference 0.09 0.03 0.02 -0.02 0.20 0.18 Hip circumference 0.06 -0.01 -0.03 -0.08 0.34* 0.38*
Systolic BP 0.01 -0.03 -0.05 -0.08 0.05 0.02 Diastolic BP 0.03 -0.01 -0.07 -0.08 0.17 0.15 Fasting plasma insulin� 0.05 0.01 -0.02 -0.03 0.08 0.03 Fasting plasma glucose 0.02 0.01 0.02 0.02 -0.08 -0.08
HOMA-IR� 0.06 0.01 -0.01 -0.03 0.06 0.01
Uric acid 0.02 0.00 -0.03 -0.03 0.13 0.10
Total cholesterol 0.05 0.04 0.05 0.05 0.04 0.02 Triglyceride� 0.13 0.11 0.09 0.08 0.02 0.01 HDL cholesterol (mM/L)�-0.11 -0.09 -0.08 -0.08 0.05 0.07 Total body fat 0.16* 0.14* 0.07 0.07 0.35* 0.35*
Lean mass 0.11 0.07 0.07 0.06 0.12 0.08
Trunk fat 0.16* 0.14* 0.08 0.08 0.31* 0.30*
Total extremity fat 0.13* 0.10 0.04 0.02 0.34* 0.34*
Total abdominal fat 0.13* 0.10 0.05 0.04 0.24 0.25 Abdominal VAT 0.05 -0.01 0.03 0.00 -0.06 -0.12 Abdominal SCT� 0.19� 0.18� 0.12 0.12 0.40* 0.41*
TNF α -0.14* -0.14* -0.16* -0.16* -0.05 -0.05
IL-6� 0.05 0.05 0.03 0.03 -0.05 -0.07
hsCRP� 0.15* 0.12 0.16* 0.15* -0.03 -0.05
Table 3. Correlation coefficients between plasma levels of resistin, transformed to log, and the variables of clinical, laboratory and anthropometric parameters in all subjects examined and accord- ing to presence/absence of the metabolic syndrome
* *
*
*
Parameters
DISCUSSION
We present one of the first human studies on the plasma levels of resistin associated with anthropometric parameters.
The results showed no evidence supporting a role for plasma resistin in mediating visceral obesity or IR in individuals with the MetS. However, potential associations between resistin and markers of systemic inflammations, such as hsCRP were found even in metabolically stable and healthy individuals.
Circulating resistin levels were found to be elevated in ge- netic (ob/ob and db/db) and diet induced models of obesity (2).
Thiazolidinedione (TZDs), which lower IR by binding to peroxisome proliferators activated receptor-γ(PPARγ) recep- tors, decreased resistin levels in ob/ob mice and diabetic fatty rats. Tissue-cultured murine adipocytes treated with TZDs decreased resistin mRNA expression (2, 15). However, other studies have not supported a role of resistin in mediating IR in rodents. TZD treatment increased resistin expression in both lean and obese rodents, including ob/ob mice and Zucker diabetic fatty rats (16, 17); and resistin expression was incre- ased by 66% in db/db mice treated with metformin (18). Addi- tionally, resistin gene expression in 3T3-L1 adipocytes was inhibited by insulin and TNF α, which are increased in obe- sity (19, 20). Consistent with these findings, our results showed that the plasma resistin levels had a inverse relationship with plasma TNF α.
Plasma levels of resistin, produced by adipose tissue, might be present at high circulating levels in subjects with high fat content. In human, evidence in accumulating that resistin expression is high in mononuclear blood cells and other non- adipocytes of adipose tissue than in adipocytes them selves (20, 21). Therefore, absolute plasma levels of resistin were increased with generalized obesity and its relationship with clinical parameters of visceral obesity was not be linear; this could explain some of the inconsistent findings in human studies (20). Although previous reports showed that resistin mRNA was higher in visceral fat than in subcutaneous fat (22), our data suggests a possible significant association bet- ween circulating resistin levels and total fat mass or subcu- taneous fat in humans.
As shown here, the impact of resistin may be more impor- tant in the regulation of the inflammatory process even in the lean subjects (23). After adjustment for abdominal SCT, gender and age, the partial correlation analyses showed that the plasma levels of resistin were associated with hsCRP (r=
0.15, P=0.040) in subjects without MetS. These findings suggest that resistin may play a role in inflammation and could be a potential marker for systemic subclinical inflam- mation in obesity (24-27). Shetty et al. (11) described a pos- itive association between resistin and CRP independent of BMI and gender. Thus, these observations suggest that infla- mmatory factors are more dominant determinants of plasma resistin levels than metabolic factors. Further studies are need- ed to clarify the role of resistin in obesity.
In summary, these results show that the resistin levels are not associated with markers of IR and/or central obesity. How- ever, the resistin levels are associated with the total body fat mass and with markers of systemic inflammation in lean heal- thy subjects. However, because of this cross-sectional study design, we cannot suggest any causal or temporal relation- ship. Further investigations are needed to improve our under- standing of resistin in humans.
REFERENCES
1. Havel PJ. Control of energy homeostasis and insulin action by adi- pocyte hormones: leptin, acylation stimulating protein, and adipo- nectin. Curr Opin Lipidol 2002; 13: 51-9.
2. Steppan CM, Bailey ST, Bhat S, Brown EJ, Banerjee RR, Wright CM, Patel HR, Ahima RS, Lazar MA. The hormone resistin links obesity to diabetes. Nature 2001; 409: 307-12.
3. Banerjee RR, Rangwala SM, Shapiro JS, Rich AS, Rhoades B, Qi Y, Wang J, Rajala MW, Pocai A, Scherer PE, Steppan CM, Ahima RS, Obici S, Rossetti L, Lazar MA. Regulation of fasted blood glu- cose by resistin. Science 2004; 303: 1195-8.
4. Rajala MW, Obici S, Scherer PE, Rossetti L. Adipose-derived resistin and gut-derived resistin-like molecule-beta selectively impair insulin action on glucose production. J Clin Invest 2003; 111: 225-30.
5. Muse ED, Obici S, Bhanot S, Monia BP, McKay RA, Rajala MW, Scherer PE, Rossetti L. Role of resistin in diet-induced hepatic insulin resistance. J Clin Invest 2004; 114: 232-9.
6. Fujinami A, Obayashi H, Ohta K, Ichimura T, Nishimura M, Matsui H, Kawahara Y, Yamazaki M, Ogata M, Hasegawa G, Nakamura N, Yoshikawa T, Nakano K, Ohta M. Enzyme-linked immunosorbent assay for circulating human resistin: resistin concentrations in nor- mal subjects and patients with type 2 diabetes. Clin Chim Acta 2004;
339: 57-63.
7. Youn BS, Yu KY, Park HJ, Lee NS, Min SS, Youn MY, Cho YM, Park YJ, Kim SY, Lee HK, Park KS. Plasma resistin concentrations measured by enzyme-linked immunosorbent assay using a newly devel- oped monoclonal antibody are elevated in individuals with type 2 dia- betes mellitus. J Clin Endocrinol Metab 2004; 89: 150-6.
8. Degawa-Yamauchi M, Bovenkerk JE, Juliar BE, Watson W, Kerr K, Jones R, Zhu Q, Considine RV. Serum resistin (FIZZ3) protein is in- creased in obese humans. J Clin Endocrinol Metab 2003; 88: 5452-5.
9. Heilbronn LK, Rood J, Janderova L, Albu JB, Kelley DE, Ravussin E, Smith SR. Relationship between serum resistin concentrations and insulin resistance in nonobese, obese, and obese diabetic subjects. J Clin Endocrinol Metab 2004; 89: 1844-8.
10. Lee JH, Chan JL, Yiannakouris N, Kontogianni M, Estrada E, Seip R, Orlova C, Mantzoros CS. Circulating resistin levels are not asso- ciated with obesity or insulin resistance in humans and are not reg- ulated by fasting or leptin administration: cross-sectional and inter- ventional studies in normal, insulin-resistant, and diabetic subjects.
J Clin Endocrinol Metab 2003; 88: 4848-56.
11. Shetty GK, Economides PA, Horton ES, Mantzoros CS, Veves A.
Circulating adiponectin and resistin levels in relation to metabolic
factors, inflammatory markers, and vascular reactivity in diabetic patients and subjects at risk for diabetes. Diabetes Care 2004; 27:
2450-7.
12. Sjostrom L, Kvist H, Cederblad A, Tylen U. Determination of total adipose tissue and body fat in women by computed tomography, 40K, and tritium. Am J Physiol 1986; 250: E736-45.
13. Matthews DR, Hosker JP, Rudenski AS, Naylor BA, Treacher DF, Turner RC. Homeostasis model assessment: insulin resistance and beta-cell function from fasting plasma glucose and insulin concen- trations in man. Diabetologia 1985; 28: 412-9.
14. Grundy SM, Cleeman JI, Daniels SR, Donato KA, Eckel RH, Franklin BA, Gordon DJ, Krauss RM, Savage PJ, Smith SC Jr, Spertus JA, Costa F. Diagnosis and management of the metabolic syndrome: an American Heart Association/National Heart, Lung, and Blood Insti- tute Scientific Statement. Circulation 2005; 112: 2735-52.
15. Moore GB, Chapman H, Holder JC, Lister CA, Piercy V, Smith SA, Clapham JC. Differential regulation of adipocytokine mRNAs by rosiglitazone in db/db mice. Biochem Biophys Res Commun 2001;
286: 735-41.
16. Way JM, Gorgun CZ, Tong Q, Uysal KT, Brown KK, Harrington WW, Oliver WR Jr, Willson TM, Kliewer SA, Hotamisligil GS. Adi- pose tissue resistin expression is severely suppressed in obesity and stimulated by peroxisome proliferator-activated receptor gamma agonists. J Biol Chem 2001; 276: 25651-3.
17. Fukui Y, Motojima K. Expression of resistin in the adipose tissue is modulated by various factors including peroxisome proliferator-acti- vated receptor alpha. Diabetes Obes Metab 2002; 4: 342-5.
18. Rajala MW, Lin Y, Ranalletta M, Yang XM, Qian H, Gingerich R, Barzilai N, Scherer PE. Cell type-specific expression and coregula- tion of murine resistin and resistin-like molecule-alpha in adipose
tissue. Mol Endocrinol 2002; 16: 1920-30.
19. Fasshauer M, Klein J, Neumann S, Eszlinger M, Paschke R. Tumor necrosis factor alpha is a negative regulator of resistin gene expres- sion and secretion in 3T3-L1 adipocytes. Biochem Biophys Res Com- mun 2001; 288: 1027-31.
20. Savage DB, Sewter CP, Klenk ES, Segal DG, Vidal-Puig A, Consi- dine RV, O’Rahilly S. Resistin/Fizz3 expression in relation to obe- sity and peroxisome proliferator-activated receptor-gamma action in humans. Diabetes 2001; 50: 2199-202.
21. Patel L, Buckels AC, Kinghorn IJ, Murdock PR, Holbrook JD, Plump- ton C, Macphee CH, Smith SA. Resistin is expressed in human ma- crophages and directly regulated by PPAR gamma activators. Bio- chem Biophys Res Commun 2003; 300: 472-6.
22. McTernan CL, McTernan PG, Harte AL, Levick PL, Barnett AH, Kumar S. Resistin, central obesity, and type 2 diabetes. Lancet 2002;
359: 46-7.
23. Hotamisligil GS. The irresistible biology of resistin. J Clin Invest 2003; 111: 173-4.
24. Smith SR, Bai F, Charbonneau C, Janderova L, Argyropoulos G. A promoter genotype and oxidative stress potentially link resistin to human insulin resistance. Diabetes 2003; 52: 1611-8.
25. Felipe F, Bonet ML, Ribot J, Palou A. Modulation of resistin expres- sion by retinoic acid and vitamin A status. Diabetes 2004; 53: 882-9.
26. Bo S, Gambino R, Pagani A, Guidi S, Gentile L, Cassader M, Pagano GF. Relationships between human serum resistin, inflammatory mark- ers and insulin resistance. Int J Obes (Lond) 2005; 29: 1315-20.
27. Lu SC, Shieh WY, Chen CY, Hsu SC, Chen HL. Lipopolysaccha- ride increases resistin gene expression in vivo and in vitro. FEBS lett 2003; 530: 158-62.