A Study on Numerical Simulation of Gaseous Flow in SCR Catalytic Filter of Diesel Exhaust Gas Aftertreatment Device
Myung-Whan Bae†⋅Syaiful1․Yoshihiro Mochimaru2
(Received August 11, 2009; Revised November 19, 2009; Accepted December 28, 2009)
Abstract:A SCR catalytic filter system is used for reducing NOx and soot emissions simultaneously from diesel combustors. The amount of ammonia (as a reducing agent) must be controlled with the amount of NOx to obtain an optimal NOx conversion. Hence, gas mixing between ammonia and exhaust gases is vital to ensure that the SCR catalyst is optimally used. If ammonia mass distribution is not uniform, slip potential will occur in rich concentration areas. At lean areas, on the other hand, the catalyst is not fully active. The better mixing is indicated by the higher uniformity of ammonia mass distribution which is necessary to be considered in SCR catalytic filter system. The ammonia mass distributions are depended on the flow field of fluids. In this study, the velocity field of gaseous flow is investigated to characterize the transport of ammonia in SCR catalytic filter system. The influence of different injection placements on the ammonia mass distribution is also discussed. The results show that the ammonia mass distribution is more uniform for the injector directed radially perpendicular to the main flow of inlet at the gravitational direction than that at the side wall for both laminar (Re = 640) and turbulent flows (Re = 4255). It is also found that the mixing index decreases as increasing the heating temperature in the case of ammonia injected at the side wall.
Key words:Numerical simulation, Gaseous flow, SCR catalytic filter system, Uniformity of ammonia mass distribution, Injection placement
†Corresponding Author (Research Center for Aircraft Parts Technology, School of Mechanical and Aerospace Engineering, Gyeongsang National University, E-mail: [email protected], Tel: 055-751-6071) 1 Graduate School, Gyeongsang National University
2 Department of International Development Engineering, Graduate School of Science and Engineering, Tokyo Institute of Technology
1. Introduction
Selective catalytic reduction (SCR) made in a variety of constructions is a prospective way for reducing NOx emissions in a diesel combustor. Urea-SCR system is widely used as a denitration device in diesel combustion applications. Urea dissolved in
water is mixed with exhaust gas, and ammonia is then formed by hydrolysis and thermolysis. The ammonia reacts with NOx on the catalyst to produce nitrogen and water. The amount of ammonia must be controlled with the amount of NOx to obtain an optimal NOx conversion. Hence,
gas mixing between ammonia and exhaust gases is vital to ensure that the SCR catalyst is optimally used. If ammonia mass distribution is not uniform, then there will be rich concentration areas where slip potential occurs. At lean areas, however, the catalyst is not fully active.
Some methods for achieving uniform ammonia mass distribution in SCR device with acceptable pressure loss and dimension were performed. The addition of a mixing section in front of catalytic converter to achieve an uniform ammonia mass distribution has been studied by Karlsson et al. [1]. The improvement of ammonia mass distribution in front of SCR substrate by considering the geometrical effects on flow mixing was studied with a numerical simulation by Zhang et al. [2].
They used the delta wings to generate turbulent flow, and used the twisted blades for creating swirling flow.
Bae et al. [3] studied the characteristics of ammonia mass distribution in the SCR catalytic filter system by a numerical analysis. They found that the local amount of ammonia concentrates in the core of circulation leading to the restriction of ammonia transport from the core to the outside. Syaiful et al. [4]
investigated the effect of injection placement on the ammonia mass distribution around the catalytic filter. They observed that the ammonia injected into the main flow of inlet in axial direction was more uniform distribution than that in radial direction and direct injection in SCR device. However, in that study, the effect of induced heat on the uniformity of ammonia mass distribution in SCR device
was not discussed.
The present study focuses the effect of injection placement and heating temperature on the gaseous flow characteristics in SCR device by numerical simulation. The heating temperature is varied from 473 to 1273 K with 200 K intervals. The injection placement has two different directions at the main flow of inlet. In order to investigate the flow field characteristics of fluid in the SCR catalytic filter system, the laminar and turbulent flows are analyzed by imposing the Reynolds numbers of 640 and 4255.
2. SCR Catalytic Filter System and Geometric Model
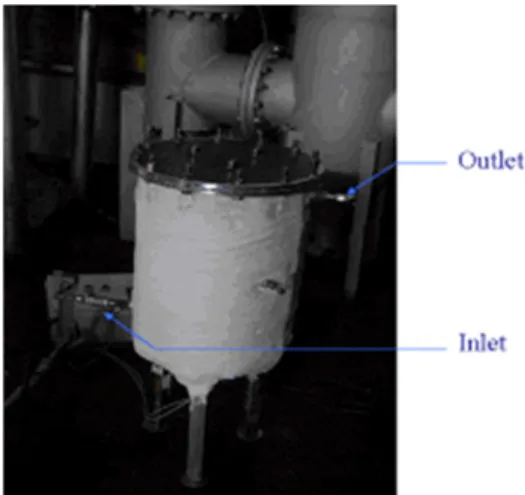
The modelling approach is based on the actual SCR catalytic filter system as shown in Figure 1. The inlet is located at the side wall of 202.5 mm above the bottom wall as shown in Figure 2 (a) and (b). The outlet is placed at the side wall of 44.95 mm from the upper side in opposite direction from the inlet. The bottom side of each catalytic filter is
Figure 1: SCR catalytic filter system
(a) SCR catalytic filter system(b) Geometric detail of a SCR
catalytic filter system (c) Catalytic filter
(d) Horizontal plate with
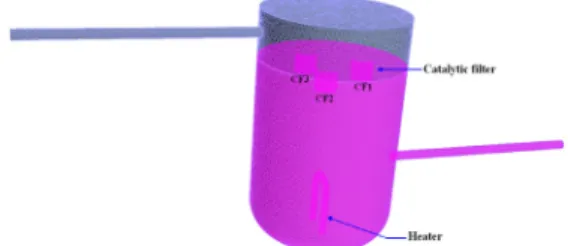
three catalytic filters (e) Heater (f) Inlet part with different injection placements Figure 2: Geometric design of a SCR catalytic filter system
enclosed by a plate with 2 mm thickness leading to the gaseous flow through only the side surface to the top of catalytic filter as shown in Figure 2(c). Three catalytic filters are mounted under the supporting plate with 120˚ intervals inside the SCR catalytic filter system as shown in Figure 2(d). A U-tube heater with diameter of 20 mm is located at the center of bottom wall inside SCR device as denoted in Figure 2(e). An injector with diameter of 1.5 mm is located 70 mm away from the side wall of SCR device as expressed in Figure 2(f). In this study, ammonia is injected at two different injection placements which are named as
‘Model A’ and ‘Model B’. Model A is as like in the actual SCR device in which ammonia is injected radially perpendicular
to the main flow of inlet in a 90 degree angle to the gravitational direction at the side wall. Model B is in which ammonia is injected radially perpendicular to the main flow of inlet in the gravitational direction at the side wall.
3. Numerical Method
In this paper, the three-dimensional gaseous flow in the SCR catalytic filter system is analyzed using commercial CFD (Computational fluid dynamics) STAR-CD v.4.06 [5]. Unstructured polyhedral meshes are generated by STAR-CCM+ in which meshes near the wall are fine enough.
125,784 cells are made as expressed in Figure 3(a), and three catalytic filters are denoted as CF1, CF2 and CF3. A part of SCR cell grids in a cross-sectional view
with catalytic filter is shown in Figure 3(b). In this figure, the catalytic filter expresses the porous media cells.
Gaseous flow is assumed as incompressible steady state without chemical reaction. A standard k-ε turbulence model with standard wall function treatment is used to predict the turbulent flow in SCR device. The SIMPLE algorithm is used for the calculation of pressure and velocity in the momentum equation. The upwind differencing scheme is used for the convection-diffusion equation except the density which uses the central differencing scheme.
The inlet boundary except on the wall is considered as the uniform velocity profile at two Reynolds numbers of 640 and 4255.
The Reynolds number of 640 is ten times larger than that of Kim’s experiment [6]
and 4255 is the same value based on Han et al’s experiment [7]. The total flow rate in Kim’s experiment [6] is 1176 mℓ/min with the simulated gas compositions of 800 ppm NH3, 600 ppm NO, 7% O2 and N2
balance. The total flow rate of exhaust gases, on the other hand, is 200 ℓ/min in Han et al.’s experiment [7] which was performed in a turbo intercooler ECU common-rail diesel engine.
Although the exhaust gases compose of many species, the gaseous flow in this study is assumed by only 2 main components of NH3 and exhaust gases (composed by NO, O2
and N2) which are based on the condition of Kim’s experiment [6]. The mixture properties of exhaust gas are calculated with the respective physical property of gases [8].
In this numerical simulation, the temperature
at the inlet boundary is determined as the same condition of the inlet temperature in Kim’s experiment [7], which is 298 K. The various heating temperatures are changed in the range from 473 to 1273 K with 200 K intervals. No slip condition is considered at the wall, which means that velocity vector components at the wall are equal to zero. The outlet boundary is selected far away from the main body of SCR device to reach a fully developed state. All boundary conditions are same for both numerical simulations of model A and B.
To estimate gaseous flow in porous media, the model of pressure drop characteristics is used under the isotropic assumption.
This model reveals proportionality between the flow resistance and the pressure gradient in the porous media [9].
(a) Polyhedral-cell grids of SCR device model
(b) A part of SCR cell grids in cross-sectional view with a catalytic filter
Figure 3: The polyhedral cell grids of SCR device model and its cross-sectional view with catalytic filters
4. Results and Discussion
4.1 Velocity Field of Gaseous Flow in Outlet Pipe A fully developed flow is reached at the outlet pipe of SCR device in this simulation results for both laminar (Re = 640) and turbulent flows (Re = 4255) as shown in Figure 4. Velocity distribution in the outlet pipe is observed as a parabolic curve at the laminar flow. The velocity at the wall is zero for both laminar and turbulent flows because of friction (no slip condition). The velocity magnitude increases as the fluid is away from the wall and reaches the maximum in the center of pipe because the shear force acts on each layer. Velocity distribution at the turbulent flow is more uniform than that at laminar flow because of the flow mixing.
Figure 4 : Velocity distributions in the outlet pipe of SCR catalytic filter system: (a) is a velocity of laminar flow at Re = 640 and (b) is a mean velocity of turbulent flow at Re = 4255
4.2 Ammonia Mass Distribution
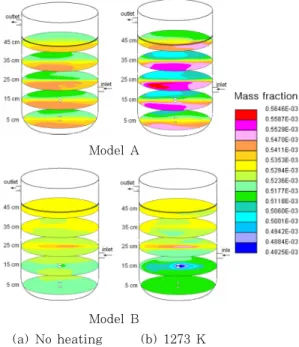
The comparison of ammonia mass distribution for model A and B at the laminar flow is shown in Figure 5. The high ammonia mass concentration is observed in the core of circulation at the cross-section view of 25 cm with heating temperature for model A. The larger difference of ammonia mass concentration
is found in the core of circulation at the cross-section views of 15, 25 and 35 cm in the case of heating temperature for model A compared with model B and no heating temperature. This is caused by the high restriction of ammonia transport from the core to the outside due to the high centripetal force. In model B, the difference of ammonia mass concentration is small because the ammonia is almost evenly distributed at the circulation area in the cross-section views. The low ammonia mass concentration is found near the heater at the cross-section view of 15 cm in the case of heating temperature for model B. For model A, the difference of ammonia mass concentration is approximately 0.0000352 in the case of no heating temperature, while it is approximately 0.0000645 with heating temperature. For model B, the difference of ammonia mass concentration is approximately 0.0000176 in the case of no heating temperature, while it is approximately 0.0000235 with heating temperature. The ammonia mass concentration occupying the small area is not considered in this calculation. This indicates that the uniformity of ammonia mass distribution in SCR device at the laminar flow decreases with heating temperature. The results also show that the ammonia mass distribution for model B is more uniform than that for model A at the laminar flow in SCR device.
Figure 6 shows the comparison of ammonia mass distribution for model A and B at the turbulent flow in SCR device.
The high ammonia mass concentration is observed for model A at the cross-section view of 25 cm with heating temperature, while the low one is found for model A at
Model A
Model B
(a) No heating (b) 1273 K
Figure 5: Comparison of ammonia mass distribution among model A and B at the different horizontal cross-section views along flow direction for Re = 640 with and without heating temperature
Model A
Model B
(a) No heating (b) 1273 K
Figure 6: Comparison of ammonia mass distribution among model A and B at the different horizontal cross-section views along flow direction for Re = 4255 with and without heating temperature
the same cross-section view in the case of no heating temperature. The difference of ammonia mass concentration for model A is approximately 0.000128 in the case of no heating temperature, while it is approximately 0.000154 with heating temperature. For model B, the difference of ammonia mass concentration is approximately 0.000039 in the case of no heating temperature, while it is approximately 0.000052 with heating temperature. The same results in turbulent flow can be found as the ones shown by the phenomena of laminar flow.
4.3 Uniformity of Ammonia Mass Distribution
The uniformity of ammonia mass distribution in the SCR catalytic filter system is indicated by a mixing index. Mixing index evaluates the mass distribution degree of two species at a certain location along the SCR device. The value of mixing index is in the range of 0 to 1. The value of 1 indicates a complete mixing which means there is no gradient of ammonia mass concentration on the section area.
The value of 0 means all mass of ammonia located at very small area, that is, with some gradient of ammonia mass concentration.
The equation for calculating the mixing index,, is given as
AC
A
C CdA
, (1)
where C is ammonia mass concentration across section area, A, and
. (2)
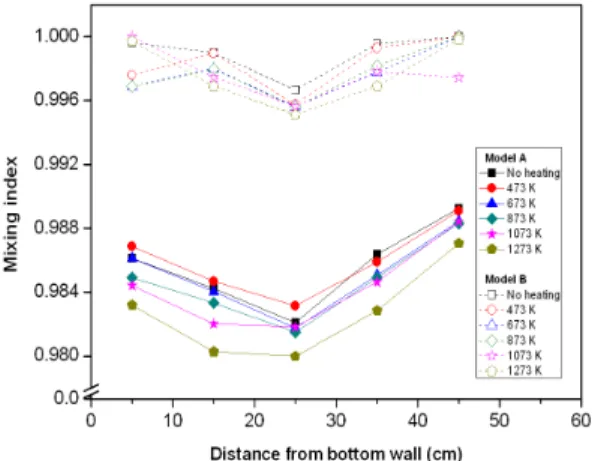
Figure 7 shows the comparison of mixing index between model A and B for the laminar flow in SCR device. The abscissa represents the distance away from the bottom wall. The solid and dotted lines represent the results of model A and B, respectively. The results show that the mixing index for model B is 0.63 to 0.8% higher than that for model A in the case of no heating temperature. The mixing index for model B is 0.98 to 1.55%
higher than that for model A with a heating temperature of 1273 K. This indicates that the ammonia mass distribution for model B is more uniform than that of model A with and without heating temperature.
The results also show that the mixing index for model A decreases as increasing the heating temperature because the circulation with heating temperature is stronger than that of no heating temperature resulting in the high restriction of ammonia transport from the core to the outside.
Figure 8 shows the comparison of
Figure 7: Comparison of mixing index between model A and B with and without heating temperature at Re = 640 in SCR device
Figure 8: Comparison of mixing index between model A and B with and without heating temperature at Re = 4255 in SCR device
mixing index between model A and B at the turbulent flow in SCR device. The solid lines represent the results of model A, while the dotted lines express the results of model B. Comparing with Figs.
7 and 8, it can be found the similar tendency of the results. The results show that the mixing index for model B is 1.08 to 1.48% higher than that for model A in the case of no heating temperature, while 1.28 to 1.67% higher than that for model A with a heating temperature of 1273 K.
The mixing index for model A decreases as increasing the heating temperature because the heat addition leads to the circulation becoming stronger than that of no heating temperature at the turbulent flow in SCR device. As a result, the transport of ammonia from the core to the outside is restricted by the circulation leading to the decrease of uniform ammonia mass distribution which means the dropping of mixing index. The smaller difference of mixing index at the turbulent flow than the laminar flow is observed at the locations of 15 to 45 cm in model A
due to the flow mixing. The values of mixing index at both laminar and turbulent flows for model B are almost same. This indicates that the effect of flow type on the uniformity of ammonia mass distribution for model B is small.
5. Conclusions
A fully developed flow in the outlet pipe was achieved in the simulation results for both laminar and turbulent flows. The large difference of ammonia mass concentration in SCR device was found at both laminar and turbulent flows with heating temp- erature for ammonia injected radially perpendicular to the main flow of inlet in a 90 degree angle to the gravitational direction at the side wall. The uniformity of ammonia mass distribution for the injection placement in the gravitational direction at the side wall was higher than that for 90 degree angle to the gravitational direction at the side wall for both laminar and turbulent flows. The mixing index for the ammonia injection for a 90 degree angle to the gravitational direction at the side wall decreased as increasing the heating temperature because of the strong circulation leading to the restriction of ammonia transport from the core to the outside at both laminar and turbulent flows. The effect of flow type on the uniformity of ammonia mass distribution for the injection placement in the gravitational direction at the side wall was small.
Acknowledgement
This research is carried out by supports of Commission Research of Materials and
Components Technology Development Project (Ministry of Knowledge Economy) and the second phase BK 21 project. We appreciate the help of all who are concerned.
References
[1] Karlsson M., Wallin U., Fredholm S., Jansson J. and Wahlström G. O., A Combined 3D/Lumped Modeling Approach to Ammonia SCR Aftertreatment Systems:
Application to Mixer Designs, SAE Technical Paper 2006-01-0469, 2006.
[2] Zhang X., Romzek M. and Morgan C., 3-D Numerical Study of Mixing Characteristics of NH3 in Front of SCR, SAE Technical Paper 2006-01- 3444, 2006.
[3] Bae M. W., Syaiful and Hwang K. Y., “ Numerical modeling of ammonia distribution characteristics in the mixing area of SCR catalytic filter device,” Proceedings of International Conference on Modeling and Diagnostics for Advanced Engine Systems (COMODIA), EM1-2, pp. 709-716, 2008.
[4] Syaiful, Bae M. W. and Im K., “Effect of injection placement and direction on ammonia distribution around SCR catalytic filter device by numerical Modeling”, KSAE 2008 Annual Conference Proceedings, KSAE-A0011, pp. 142-150, 2008.
[5] Adapco, STAR-CD v.4.06, 2008.
[6] Kim Y. A., The Effect of MnO2 Addition on the V2O5/TiO2 Catalytic Filter for NO Reduction, Master Thesis, Gyeongsang National University, 2007.
[7] Han, Y. W., Bae M. W., Choi J. H. and Kim J. H, “Development of a combined Urea-SCR catalytic filter system for
simultaneous of soot and NOx emissions in diesel engines,” KSAE 2008 Annual Conference Proceedings, KSAE08-A0086, pp. 216-222, 2008.
[8] Reid R. C., Prausnitz J. M. and Poling B. E., The Properties of Gases and Liquids, 4th Edition, McGraw-Hill, 1987.
[9] Nield D. A. and Bejan A., Convection in Porous Media, 3rd edition, Springer, 2006.
Author Profile
Myung-Whan Bae
He received his B. S. degree from Korea Maritime University and his Dr. Eng.
from Tokyo Institute of Technology. He is currently a professor of School of Mechanical and Aerospace Engineering, Gyeongsang National University, and Vice President of KSAE. His research interests are the fields of energy and environment in combustion engines.
Syaiful
He received his B.E. degree from Brawijaya University and M. Eng. from Bandung Institute of Technology. He is currently a graduate student of Graduate School of Mechanical and Aerospace Engineering, Gyeongsang National University.
His research interest is the field of exhaust gas aftertreatment modeling.
Yoshihiro Mochimaru
He received his B.E. degree from Tokyo Institute of Technology and his Dr.
Eng. from Tokyo Institute of Technology.
He is currently a professor of Graduate School of Science and Engineering, Tokyo Institute of Technology. His research interest is the fields of computational fluid dynamics and heat transfer.