pISSN: 0378-6471⋅eISSN: 2092-9374
http://dx.doi.org/10.3341/jkos.2014.55.10.1476
Original Article
당뇨 환자와 정상인의 스펙트럼 영역 빛간섭단층촬영을 통한 신경절세포-내망상층 두께 차이
Difference of GCIPL Thickness of Diabetes and Normal Eyes in Spectral Domain OCT
박상준⋅문연성⋅김나래
Sang Jun Park, MD, Yeon Sung Moon, MD, PhD, Na Rae Kim, MD, PhD 인하대학교 의과대학 안과학교실 인하시과학연구소
Department of Ophthalmology and Inha Vision Science Laboratory, Inha University School of Medicine, Incheon, Korea
Purpose: To analyze the difference of the ganglion cell-inner plexiform layer (GCIPL) thickness in diabetic and normal eyes of patients using spectral domain optical coherence tomography (OCT) (Carl Zeiss Meditec, Dublin, CA, USA).
Methods: The authors compared and analyzed the difference of the GCIPL thickness measured with spectral domain optical co- herence tomography (OCT) in 42 diabetic and 92 normal subjects.
Results: The study subjects were divided into 3 groups: 92 normal subjects, 22 diabetic patients without diabetic retinopathy, and 26 diabetic patients with diabetic retinopathy. Presence of diabetes mellitus (DM) or diabetic retinopathy did not influence the retinal nerve fiber layer (RNFL) thickness. The GCIPL thickness tended to be thinner especially in the superior sector GCIPL.
The GCIPL thickness of normal subjects, diabetes patients without diabetic retinopathy, and diabetic retinopathy patients was 82.24 ± 7.21 μm, 81.86 ± 9.53 μm, and 76.77 ± 14.13 μm, respectively, especially in the superior sector GCIPL (p = 0.029).
Conclusions: Retinal ganglion cell layer thinning was induced by diabetes and diabetic retinopathy, and originated specifically from the superior part of the retina.
J Korean Ophthalmol Soc 2014;55(10):1476-1480
Key Words: Diabetes mellitus (DM), Ganglion cell-inner plexiform layer (GCIPL), Optical coherence tomography (OCT), Retinal nerve fiber layer (RNFL)
■Received: 2014. 1. 11. ■ Revised: 2014. 4. 24.
■Accepted: 2014. 9. 5.
■Address reprint requests to Na Rae Kim, MD, PhD Department of Ophthalmology, Inha University Hospital,
#27 Inhang-ro, Jung-gu, Incheon 400-711, Korea Tel: 82-32-890-2400, Fax: 82-32-890-2417 E-mail: [email protected]
* This work was supported by Inha University Hospital, Research Grant.
ⓒ2014 The Korean Ophthalmological Society
This is an Open Access article distributed under the terms of the Creative Commons Attribution Non-Commercial License (http://creativecommons.org/licenses/by-nc/3.0/) which permits unrestricted non-commercial use, distribution, and reproduction in any medium, provided the original work is properly cited.
당뇨에 의해서 우리 몸에는 많은 변화가 나타난다. 당뇨 환자에서 허혈성 변화, 단백질 생성의 감소나 소르비톨 농 도가 증가함에 따라 이로 인한 전신적 이상이 나타나고 특
히 눈에는 당뇨망막병증과 같은 합병증이 발생한다.1 당뇨 망막병증이 있는 경우 눈에서는 미세혈관류, 모세혈관 비 관류, 망막 출혈, 지단백 삼출 등의 변화를 관찰할 수 있 다.2-5 여러 동물이나 인체를 통한 연구에서 당뇨가 있는 경 우 이러한 당뇨망막병증 소견 외에도 망막신경섬유층 소실 을 보고한 바 있으며6-10 망막 신경 세포의 위축이나 신경절 세포의 얇아짐이 보고되었다.11,12 하지만 이러한 변화들이 허혈성 변화에 의한 것인지 아니면 만성적 고혈당증에 의 한 시신경 자체의 직접적 손상인지에 대해서는 아직 논란 이 되고 있다.13
최근에는 스펙트럼 영역 빛간섭단층촬영(spectral domain OCT, SD-OCT)을 이용하여 망막신경섬유층뿐만 아니라 신
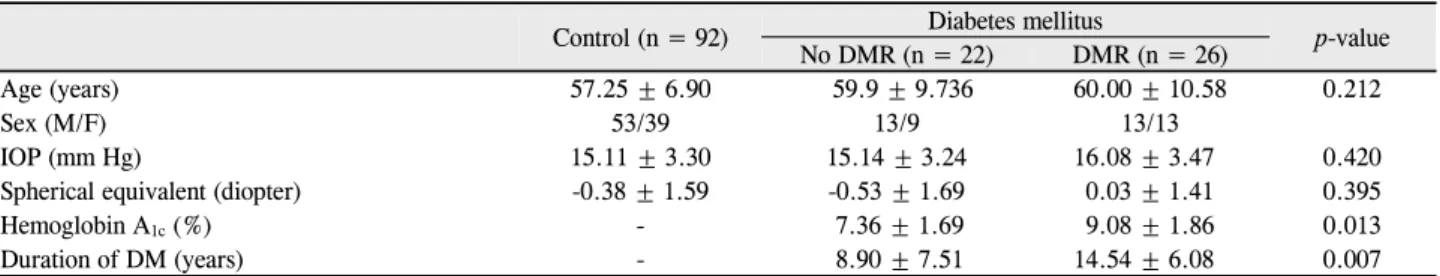
Table 1. Demographic characteristics of diabetic patients groups and control group
Control (n = 92) Diabetes mellitus p-value
No DMR (n = 22) DMR (n = 26)
Age (years) 57.25 ± 6.90 59.9 ± 9.736 60.00 ± 10.58 0.212
Sex (M/F) 53/39 13/9 13/13
IOP (mm Hg) 15.11 ± 3.30 15.14 ± 3.24 16.08 ± 3.47 0.420
Spherical equivalent (diopter) -0.38 ± 1.59 -0.53 ± 1.69 0.03 ± 1.41 0.395
Hemoglobin A1c (%) - 7.36 ± 1.69 9.08 ± 1.86 0.013
Duration of DM (years) - 8.90 ± 7.51 14.54 ± 6.08 0.007
Values are presented as mean ± SD unless otherwise indicated.
DMR = diabetic retinopathy; DM = diabtes mellitus; IOP = intraocular pressure.
경절 세포의 측정도 가능하게 되었고 Cirrus OCT (Carl Zeiss Meditec, Dublin, California)에서는 Macular cube mode를 통하여 이 신경절 세포층과 내망상층의 복합체인 신경절 세포-내망상층(Ganglion cell-inner plexiform layer, GCIPL)의 두께를 측정할 수 있게 되었다.14
본 연구에서는 정상인과 당뇨환자를 당뇨망막병증 유무 에 따라 분류한 뒤 스펙트럼 영역 빛간섭단층촬영을 이용 하여 측정한 망막신경섬유층 두께와 신경절 세포-내망상층 두께를 비교하여 당뇨 또는 당뇨망막병증이 이들에 어떠한 영향을 미치는지 알아보고자 하였다.
대상과 방법
인하대병원 안과에 2011년 3월부터 2013년 3월 사이 내 원한 환자들의 의무 기록을 후향적으로 검토하여 Cirrus OCT의 Macular cube mode와 Optic disc cube mode 스캔을 둘 다 시행하였던 정상군 92명, 당뇨가 있는 환자 48명을 대상으로 선정하였다.
당뇨가 있는 환자는 기존에 당뇨병을 진단받고 인슐린 또는 혈당강하제를 사용하고 있는 환자들을 대상으로 선정하 였으며 당뇨망막병증의 유무는 Early Treatment of Diabetic Retinopathy Study (ETDRS)에서 제시한 척도를 기준으로 안저촬영 또는 형광안저혈관조영술을 시행하여 평가하였 다.15
이에 따라 정상군, 당뇨망막병증이 없는 당뇨환자군, 당 뇨망막병증이 있는 당뇨환자군으로 분류하였으며 당뇨 환 자군에서는 황반부종, 증식성 당뇨망막병증이 있거나 범망 막 레이저 광응고술을 시행한 사람은 제외하였다. 또한 모 든 대상에서 신경학적 질환, 당뇨망막병증을 제외한 다른 망막 질환, 매체혼탁, 거짓비늘증후군, 포도막염, 녹내장, -6.0디옵터 이상의 고도근시, 병적근시가 있는 환자들은 제 외하였다.
대상들은 모두 안압, 굴절력을 측정하고 Cirrus OCT를 이용하여 빛간섭단층촬영을 시행하였고 Macular cube
512×128 combination scan mode를 통해 황반부 두께와 신 경절 세포-내망상층 두께를, Optic disc cube 200×200 scan mode를 통해 유두주위 망막신경섬유층 두께를 측정하였다.
Macular cube 512×128 combination scan mode는 황반부 6×6 mm에 해당하는 부위를 512×128의 점으로 스캔하는 방식으로 망막신경섬유층에서 망막색소상피층까지의 두께 를 측정하여 황반두께지도(macular thickness map)를 제공 하는데 최근에는 신경절세포층과 내망상층의 합에 대한 두 께를 따로 측정할 수 있어 이에 대한 정보도 제공한다.
당뇨환자군들은 모두 당뇨 유병기간과 HbA1c를 측정하 였다. 양안이 모두 포함 가능한 환자의 경우 단안만을 무작 위로 선정하여 분석하였다.
측정된 자료는 SPSS program (Version 20.0 for Window) 을 이용하여 통계 처리하였다. 각 군 간에 망막신경섬유층 두께와 신경절세포-내망상층 두께는 ANOVA를 이용하여 비교분석하였으며 사후분석은 Scheffe’s post hoc test를 시 행하여 통계적 유의성을 확인하였다. 유의 수준은 0.05%
이하로 정하여 분석하였다.
결 과
본 연구를 통해 분석한 환자는 모두 140명으로 이 중 정 상군 92명, 당뇨망막병증이 없는 당뇨환자 22명, 당뇨망막 병증이 있는 당뇨환자는 26명이었다. 대상군의 연령, 안압, 굴절도 등은 각 군당 유의한 차이를 보이지 않았다. 당뇨환 자에서 HbA1c는 당뇨망막병증이 있는 군과 없는 군에서 각 각 9.08 ± 1.86%, 7.36 ± 1.69%이었고 유병기간은 8.90 ± 7.51년, 14.54 ± 6.08년으로 당뇨망막병증이 있는 군에서 유의하게 높았다(Table 1).
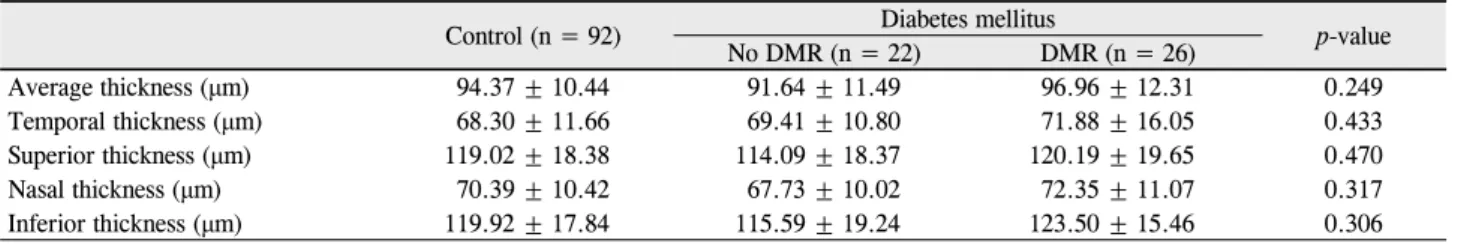
망막신경섬유층의 두께를 비교하였을 때 평균 망막신경 섬유층 두께 및 사분원별로 비교 분석한 결과 각 군 간에 유의한 차이를 관찰할 수 없었다(Table 2, Fig. 1).
신경절 세포-내망상층 두께를 비교하였을 때에는 정상군 보다 당뇨가 있는 군에서 그보다는 당뇨망막병증이 있는
Table 2. RNFL thickness of diabetic patients groups and control group
Control (n = 92) Diabetes mellitus
p-value
No DMR (n = 22) DMR (n = 26)
Average thickness (μm) 94.37 ± 10.44 91.64 ± 11.49 96.96 ± 12.31 0.249
Temporal thickness (μm) 68.30 ± 11.66 69.41 ± 10.80 71.88 ± 16.05 0.433
Superior thickness (μm) 119.02 ± 18.38 114.09 ± 18.37 120.19 ± 19.65 0.470
Nasal thickness (μm) 70.39 ± 10.42 67.73 ± 10.02 72.35 ± 11.07 0.317
Inferior thickness (μm) 119.92 ± 17.84 115.59 ± 19.24 123.50 ± 15.46 0.306
Values are presented as mean ± SD.
RNFL = retinal nerve fiber layer; DMR = diabetic retinopathy.
160 150 140 130 120 110 100 90 80 70 60 50 40
Temporal Superior Nasal Inferior Peripapilary region
Average retinal nerve fiber layer thickness (µm)
With DM, without DMR With DM, with DMR Control
90
85
80
75
70
With DM, without DMR With DM, with DMR Control
Ganglion cell-inner plexiform layer thickness (µm)
Superotemp Superonasal
Superior Inferonasal Inferior Inferotemporal
Peripapilary region
Figure 1. Peripapillary retinal nerve fiber layer (RNFL) thick-
ness of diabetic patients groups and control group. The illus- tration shows that the RNFL layer thickness had no difference among the 3 groups. DM = diabtes mellitus; DMR = diabetic retinopathy.Figure 2. Ganglion cell-inner plexiform layer (GCIPL) thick-
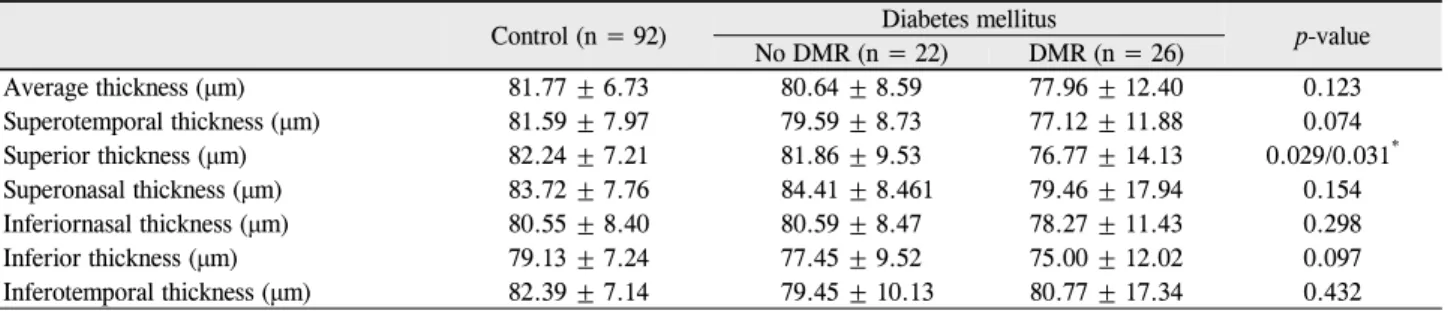
ness of diabetic patients groups and control group. The illus- tration shows that the GCIPL thickness had tendency to be thinner in diabetic patients than normal patients and in diabetic retinopathy than non-diabetic retinopathy diabetes mellitus patients. DM = diabtes mellitus; DMR = diabetic retinopathy.군에서 신경절 세포-내망상층 두께가 얇아지는 경향을 보 였다(Fig. 2). 평균 신경절 세포-내망상층 두께는 정상군, 당 뇨망막병증이 없는 당뇨환자군, 당뇨망막병증이 있는 당뇨 환자군에서 81.77 ± 6.73 μm, 80.64 ± 8.59 μm, 77.96 ± 12.40 μm였으며 통계학적으로 유의한 차이는 보이지 않았 다(p=0.123). 측정 구역별로 분석하였을 때, 상측 육분원 구 역에서 정상군, 당뇨망막병증이 없는 당뇨환자군, 당뇨망막 병증이 있는 당뇨 환자군에서 82.24 ± 7.21 μm, 81.86 ± 9.53 μm, 76.77 ± 14.13 μm로 신경절 세포-내망상층 두께 가 유의하게 감소하는 것을 확인하였다(p=0.029) (Table 3).
Scheffe’s test를 이용한 사후분석 결과에서 정상군과 당뇨 망막병증이 있는 환자군 사이에 유의한 차이가 있음을 확 인하였다(p=0.031).
총 망막 두께나 황반 두께는 각 군당 유의한 차이를 보이 지 않았다(Table 4).
고 찰
본 연구에서는 당뇨환자와 정상인을 대상으로 Cirrus OCT를 이용하여 측정한 망막신경섬유층 두께와 신경절세 포-내망상층 두께를 비교하였다. 이전에 당뇨가 눈에 미치 는 영향에 대한 연구 중 망막신경섬유층과 관련된 내용을 살펴보면 많은 연구에서 당뇨의 진행에 따라 망막신경섬유 층이 소실된다고 보고하고 있으며 이러한 변화는 당뇨망막 병증이 발생하기 전부터 일어난다고 하였다. van Dijk et al13 은 1형 당뇨환자에서 당뇨망막병증이 있는 군과 없는 군, 정상군으로 분류하여 탑콘사의 3D OCT (3-D OCT-1000;
Topcon Corp.)를 통해 신경절 세포의 두께와 망막신경섬유 층 두께를 비교한 연구에서 정상군보다 당뇨가 있는 경우 황반부 신경절 세포의 두께와 망막신경섬유층 두께가 더 얇아진다고 보고하였다. Park et al16은 Cirrus OCT를 이용 하여 황반부 망막신경섬유층과 유두주위 망막신경섬유층 두께를 측정한 연구에서 상측의 황반부 망막신경섬유층 두
Peripapillary region Peripapillary region
Table 3. GCIPL thickness of diabetic patients groups and control group
Control (n = 92) Diabetes mellitus
p-value No DMR (n = 22) DMR (n = 26)
Average thickness (μm) 81.77 ± 6.73 80.64 ± 8.59 77.96 ± 12.40 0.123
Superotemporal thickness (μm) 81.59 ± 7.97 79.59 ± 8.73 77.12 ± 11.88 0.074
Superior thickness (μm) 82.24 ± 7.21 81.86 ± 9.53 76.77 ± 14.13 0.029/0.031*
Superonasal thickness (μm) 83.72 ± 7.76 84.41 ± 8.461 79.46 ± 17.94 0.154
Inferiornasal thickness (μm) 80.55 ± 8.40 80.59 ± 8.47 78.27 ± 11.43 0.298
Inferior thickness (μm) 79.13 ± 7.24 77.45 ± 9.52 75.00 ± 12.02 0.097
Inferotemporal thickness (μm) 82.39 ± 7.14 79.45 ± 10.13 80.77 ± 17.34 0.432
Values are presented as mean ± SD.
GCIPL = ganglion cell-inner plexiform layer; DMR = diabetic retinopathy.
*p-value of Scheffe’s post hoc test between the control and the diabetic retinopathy group.
Table 4. Macular thickness of diabetic patients groups and control group
Control (n = 92) Diabetes mellitus
p-value No DMR (n = 22) DMR (n = 26)
Cube average thickness (μm) 279.83 ± 12.42 275.86 ± 11.89 278.19 ± 16.20 0.436
Central macular thickness (μm) 251.98 ± 24.61 240.86 ± 36.16 241.00 ± 34.08 0.099
Cube volume (mm2) 10.01 ± 0.43 9.86 ± 0.40 9.90 ± 0.62 0.286
Values are presented as mean ± SD.
DMR = diabetic retinopathy.
께가 당뇨 환자에서 감소된다고 보고한 바 있다.
본 연구의 결과에 따르면 당뇨 유무나 당뇨환자에서 당 뇨망막병증의 유무는 유두주위 망막신경섬유층 두께의 차 이에 영향을 주지 않았다. 이러한 차이점의 원인에는 여러 가지가 있겠지만 환자군의 차이, 당뇨유병기간의 차이, 빛 간섭단층촬영기의 기종 및 소프트웨어 버전의 차이, 황반 부와 시신경 유두 주위의 스캔 위치 차이 등이 원인이 될 수 있을 것으로 생각한다.
이전의 연구들에 따르면 당뇨에 의한 변화로 망막신경섬 유층 두께의 감소뿐만 아니라 신경절세포와 뮬러세포 등의 손상에 의한 내과립층과 내망상층의 두께 감소도 보고되었
는데17,18 현재는 OCT의 해상도 향상으로 신경절세포-내망
상층의 두께를 측정할 수 있게 됨에 따라 이를 좀 더 정량 적으로 알 수 있게 되었다. 본 연구의 결과에 따르면 신경 절세포-내망상층 두께는 당뇨가 있는 환자에서, 그리고 당 뇨망막병증이 있는 환자에서 더욱 얇아지는 경향이 있었으 며 특히 위쪽 구역에서 유의한 차이가 있었다(p<0.05).
Chung et al19은 아래쪽의 망막 혈관이 위쪽의 망막혈 관에 비하여 혈류량이 더 많다고 하였고 Jonas and Naumann20의 연구에 따르면 아래쪽 망막혈관의 직경이 더 크다는 보고가 있었다. 또한 Kern and Engerman21은 당뇨 동물모델에서 위쪽 망막에 혈관 관류가 더 적어 미세혈관 류 및 무세포(acellular) 모세혈관이 많다고 하였으며 Lopes de Faria et al7은 상측 망막신경섬유층과 신경절세포가 당 뇨망막병증이 없는 1형 당뇨환자에서 더 손상을 잘 받는다 고 보고한 바 있다. 위 연구들에서 보고한 해부학적 혈관
분포의 차이가 당뇨병성 변화에 의한 손상이 위쪽의 망막 과 아래쪽의 망막에서 비대칭적으로 발생한 본 연구의 결 과에 대한 하나의 설명이 될 수 있다. 그러나 자세한 기전 에 대해서는 추가적인 연구가 필요하다.
본 연구의 제한점으로는 각 군당 대상 수가 적다는 점이 있으며 그로 인해 당뇨망막병증 유무에 따른 차이점은 볼 수 있었지만 당뇨망막병증의 중등도에 따른 차이점은 알 수 없었다.
본 연구는 당뇨 유무나 당뇨망막병증 유무가 망막에 어 떠한 영향을 미치는지 스펙트럼 영역 빛간섭단층촬영을 통 해 알아보았다. 당뇨에 의한 허혈성 변화 등에 의해 신경절 세포층 두께의 감소가 유발되며 특히 이는 위쪽 망막 구역 에서 잘 발생하였다.
REFERENCES
1) Dyck PJ, Lais A, Karnes JL, et al. Fiber loss is primary and multi- focal in sural nerves in diabetic polyneuropathy. Ann Neurol 1986;19:425-39.
2) Antonetti DA, Barber AJ, Bronson SK, et al. Diabetic retinopathy:
seeing beyond glucose-induced microvascular disease. Diabetes 2006;55:2401-11.
3) Barber AJ, Lieth E, Khin SA, et al. Neural apoptosis in the retina during experimental and human diabetes. Early onset and effect of insulin. J Clin Invest 1998;102:783-91.
4) Barber AJ, Antonetti DA, Kern TS, et al. The Ins2Akita mouse as a model of early retinal complications in diabetes. Invest Ophthalmol Vis Sci 2005;46:2210-8.
5) Rungger-Brändle E, Dosso AA, Leuenberger PM. Glial reactivity,
= 국문초록 =
당뇨 환자와 정상인의 스펙트럼 영역 빛간섭단층촬영을 통한 신경절세포-내망상층 두께 차이
목적: 당뇨병 환자와 정상인에서 스펙트럼 영역 빛간섭 단층촬영(Carl Zeiss Meditec, Dublin, CA)을 통한 신경절 세포-내망상층 및 망막신경섬유층 두께의 차이에 대하여 분석한다.
대상과 방법: 정상안 92안과 당뇨안 42안을 대상으로 스펙트럼 영역 빛간섭단층촬영을 시행하여 망막신경섬유층 두께와 신경절 세포 -내망상층 두께의 차이를 비교 분석하였다.
결과: 정상군 92명, 당뇨망막병증이 없는 당뇨환자 22명, 당뇨망막병증이 있는 당뇨환자 26명으로 각 군을 나누어 분석한 결과 당뇨 유무나 당뇨망막병증 유무는 망막신경섬유층 두께 차이에 영향을 주지 않았다. 신경절 세포-내망상층 두께는 당뇨가 있는 환자에서, 그리고 당뇨망막병증이 있는 환자에서 더욱 얇아지는 경향이 있었으며 특히 위쪽 망막 구역에서 정상군 82.24 ± 7.21 μm, 당뇨망막 병증이 없는 당뇨환자군 81.86 ± 9.53 μm, 당뇨망막병증이 있는 당뇨환자군 76.77 ± 14.13 μm로 유의하게 감소하였다(p=0.029).
결론: 당뇨와 당뇨망막병증에 의한 영향에 의해 망막 신경절 세포의 두께 감소가 유발되며 이러한 변화는 특히 위쪽 망막에서 먼저 일어나는 것을 확인하였다.
<대한안과학회지 2014;55(10):1476-1480>
an early feature of diabetic retinopathy. Invest Ophthalmol Vis Sci 2000;41:1971-80.
6) Takahashi H, Goto T, Shoji T, et al. Diabetes-associated retinal nerve fiber damage evaluated with scanning laser polarimetry. Am J Ophthalmol 2006;142:88-94.
7) Lopes de Faria JM, Russ H, Costa VP. Retinal nerve fibre layer loss in patients with type 1 diabetes mellitus without retinopathy. Br J Ophthalmol 2002;86:725-8.
8) Ozdek S, Lonneville YH, Onol M, et al. Assessment of nerve fiber layer in diabetic patients with scanning laser polarimetry. Eye (Lond) 2002;16:761-5.
9) Sugimoto M, Sasoh M, Ido M, et al. Detection of early diabetic change with optical coherence tomography in type 2 diabetes mel- litus patients without retinopathy. Ophthalmologica 2005;219:
379-85.
10) Lonneville YH, Ozdek SC, Onol M, et al. The effect of blood glu- cose regulation on retinal nerve fiber layer thickness in diabetic patients. Ophthalmologica 2003;217:347-50.
11) Zhang L, Ino-ue M, Dong K, Yamamoto M. Retrograde axonal transport impairment of large- and medium-sized retinal ganglion cells in diabetic rat. Curr Eye Res 2000;20:131-6.
12) Lieth E, Gardner TW, Barber AJ, Antonetti DA. Retinal neuro- degeneration: early pathology in diabetes. Clin Experiment Ophthalmol 2000;28:3-8.
13) van Dijk HW, Verbraak FD, Kok PH, et al. Decreased retinal gan- glion cell layer thickness in patients with type 1 diabetes. Invest
Ophthalmol Vis Sci 2010;51:3660-5.
14) Garvin MK, Abràmoff MD, Wu X, et al. Automated 3-D intra- retinal layer segmentation of macular spectral-domain optical co- herence tomography images. IEEE Trans Med Imaging 2009;28:
1436-47.
15) Photocoagulation for diabetic macular edema. Early Treatment Diabetic Retinopathy Study report number 1. Early Treatment Diabetic Retinopathy Study research group. Arch Ophthalmol 1985;103:1796-806.
16) Park HY, Kim IT, Park CK. Early diabetic changes in the nerve fi- bre layer at the macula detected by spectral domain optical coher- ence tomography. Br J Ophthalmol 2011;95:1223-8.
17) Mizutani M, Gerhardinger C, Lorenzi M. Müller cell changes in human diabetic retinopathy. Diabetes 1998;47:445-9.
18) Rungger-Brändle E, Dosso AA, Leuenberger PM. Glial reactivity, an early feature of diabetic retinopathy. Invest Ophthalmol Vis Sci 2000;41:1971-80.
19) Chung HS, Harris A, Halter PJ, et al. Regional differences in retinal vascular reactivity. Invest Ophthalmol Vis Sci 1999;40:2448-53.
20) Jonas JB, Naumann GO. Parapapillary retinal vessel diameter in normal and glaucoma eyes. II. Correlations. Invest Ophthalmol Vis Sci 1989;30:1604-11.
21) Kern TS, Engerman RL. Vascular lesions in diabetes are dis- tributed non-uniformly within the retina. Exp Eye Res 1995;60:
545-9.