ISSN 2234-3806 • eISSN 2234-3814
https://doi.org/10.3343/alm.2019.39.2.141
Development of a Novel Flow Cytometry-Based System for White Blood Cell Differential Counts: 10-color
LeukoDiff
Dongjin Park, M.D.1, Jiyoung Chang, M.D.1, Jimin Kahng, M.D.1, Hunhee Park, Ph.D.2, Irene Jo, M.D.1, Yonggoo Kim, M.D.1, and Kyungja Han , M.D.1
1Department of Laboratory Medicine, College of Medicine, The Catholic University of Korea, Seoul, Korea; 2Department of Clinical Laboratory Science, Ansan University, Ansan, Korea
Background: Flow cytometry (FCM) is commonly used to identify many cell populations.
We developed a white blood cell (WBC) differential counting system for detecting abnor- mal cells using FCM incorporating 10 colors and 11 antibodies in a single tube, called
“10-color LeukoDiff,” and evaluated its performance.
Methods: Ninety-one EDTA-anti-coagulated peripheral blood samples from 76 patients were analyzed using 10-color LeukoDiff. We compared 10 color LeukoDiff results with the results of manual differential count (manual diff). WBCs were classified into 17 cell popu- lations: neutrophils, total lymphocytes, T lymphocytes, B lymphocytes, CD5 and CD19 co- expressing lymphocytes, natural killer cells, total monocytes, 16+ monocytes, eosinophils, immature granulocytes, basophils, myeloblasts, B-blasts, T-blasts, myeloid antigen-posi- tive B-blasts, CD19- plasma cells, and 19+ plasma cells.
Results: The correlations between the 10-color LeukoDiff and manual diff results were strong (r>0.9) for mature neutrophils, lymphocytes, eosinophils, immature granulocytes, and blasts and moderate for monocytes and basophils (r=0.86 and 0.74, respectively).
There was no discrepancy in blast detection between 10-color LeukoDiff and manual diff results. Furthermore, 10-color LeukoDiff could differentiate the lineage of the blasts and separately count chronic lymphocytic leukemic cells and multiple myeloma cells.
Conclusions: The 10-color LeukoDiff provided an accurate and comprehensive WBC dif- ferential count. The most important ability of 10-color LeukoDiff is to detect blasts accu- rately. This system is clinically useful, especially for patients with hematologic diseases, such as acute leukemia, chronic lymphocytic leukemia, and multiple myeloma. Applica- tion of this system will improve the development of FCM gating strategy designs.
Key Words: Flow cytometry, Manual differential count, 10-color LeukoDiff, Blasts, Imma- ture granulocytes
Received: December 6, 2017 Revision received: May 4, 2018 Accepted: August 28, 2018
Corresponding author: Kyungja Han, M.D.
https://orcid.org/0000-0003-4960-3403 Department of Laboratory Medicine, College of Medicine, Seoul St. Mary’s Hospital, The Catholic University of Korea, 222 Banpo-daero, Seocho-gu,
Seoul 07345, Korea Tel: +82-2-2258-1644 Fax: +82-2-2258-1719 E-mail: hankja@catholic.ac.kr
© Korean Society for Laboratory Medicine This is an Open Access article distributed under the terms of the Creative Commons Attribution Non-Commercial License (http://creativecom- mons.org/licenses/by-nc/4.0) which permits unrestricted non-commercial use, distribution, and reproduction in any medium, provided the original work is properly cited.
INTRODUCTION
Automated hematology analyzers are useful for white blood cell (WBC) differential counts, especially for differentiating mature neutrophils (mNE), lymphocytes (LY), monocytes (MO), eosino-
phils (EO), and basophils (BA) [1]. However, these analyzers may have problems in identifying abnormal cells, including blasts (BL) and immature granulocytes (IG). In such cases, “flag” messages are used to show the presence of abnormal cells and to inform the user of a potential inaccuracy in the differential count [2].
2017-03-16 https://crossmark-cdn.crossref.org/widget/v2.0/logos/CROSSMARK_Color_square.svg
Therefore, when the presence of abnormal cells, such as cir- culating BL is suspected, a microscopic examination with man- ual differential count (manual diff) is required [3]. Manual diff has traditionally been considered a reference method [4]; how- ever, it is labor-intensive, time-consuming, and vulnerable to er- ror [5]. To overcome these disadvantages, several attempts have been made to use flow cytometry (FCM) in WBC differential counting [5-8]. A FCM WBC differential counting method using a five-color and six-antibody reagent cocktail was recently intro- duced [6]. This method could successfully identify various cell populations, but it showed lower sensitivity and specificity than manual diff in detecting important immature cells, such as BL and IG, and it failed to identify specific cell populations, such as chronic lymphocytic leukemia (CLL) cells [6].
Using an extended number of antibodies would improve the sensitivity and specificity of FCM-based WBC differential count- ing, since the method is based on the immunological recogni- tion of cell lineage-specific antigens [9, 10]. We developed a system for detecting abnormal cells using 10 colors and 11 an- tibodies in a single tube with three-laser FCM, called “10-color LeukoDiff.” To evaluate its performance, its results were com- pared with those obtained from manual diff.
METHODS
Patients and samplesIn this retrospective study, 91 fresh EDTA-anti-coagulated resid- ual blood samples from 76 patients (45 males and 31 females;
age range, 13–77 years; median age, 53 years) of Seoul St.
Mary’s Hospital, Seoul, Korea, were used. There were 36 sam- ples from 26 patients with acute myeloid leukemia (AML), five samples from four patients with acute promyelocytic leukemia, nine samples from eight patients with B-acute lymphoblastic leukemia (B-ALL), one sample from a patient with T-ALL, one sample from a patient with chronic lymphocytic leukemia (CLL), five samples from five patients with chronic myelogenous leuke- mia (CML), nine samples from eight patients with non-Hodg- kin’s malignant lymphomas, one sample from a patient with Hodgkin’s lymphoma, eight samples from seven patients with myelodysplastic syndrome (MDS), three samples from two pa- tients with multiple myeloma (MM), and 13 samples from pa- tients with other hematologic and non-hematologic diseases.
This study was conducted from March 2014 to February 2015 and approved by the Institutional Review Board (2010-0186- 000) of Seoul St. Mary’s Hospital.
Manual diff
Two trained hematology technicians with over 15 years of expe- rience in diagnostic hematology laboratories performed the man- ual diff on 200 cells, and the average of the results was used.
They counted mNE, LY, MO, EO, BA, BL, IG, (including myelo- cytes, metamyelocytes, and promyelocytes), plasma cells (PC), and nucleated red blood cells (nRBCs).
10-color LeukoDiff
10-color LeukoDiff used a three-laser Navois flow cytometer (Beckman Coulter, Indianapolis, IN, USA) and Kaluza analysis software (Beckman Coulter). For photomultiplier tube (PMT) voltage calibration, each tube stained with a single antibody was run, and after all 10 tubes were run, the Navios automatically set up using an automatic instrument setting software provided by the manufacturer, Flowset Pro software (Beckman Coulter);
the calibration was saved as a protocol. Subsequently, we used this saved protocol until any of the antibodies were changed.
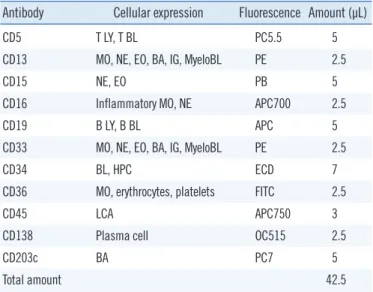
The compensation between colors was automatically set using Navios auto setup wizard. The antibodies (Beckman Coulter) were premixed, and the volume of each antibody is shown in Table 1.
The premixed reagent was stored at 4°C and used for one week. Before conducting this study, we had confirmed that the
Table 1. Cellular expression characteristics and amount of antibod- ies in the premixed 10-color LeukoDiff reagent
Antibody Cellular expression Fluorescence Amount (µL)
CD5 T LY, T BL PC5.5 5
CD13 MO, NE, EO, BA, IG, MyeloBL PE 2.5
CD15 NE, EO PB 5
CD16 Inflammatory MO, NE APC700 2.5
CD19 B LY, B BL APC 5
CD33 MO, NE, EO, BA, IG, MyeloBL PE 2.5
CD34 BL, HPC ECD 7
CD36 MO, erythrocytes, platelets FITC 2.5
CD45 LCA APC750 3
CD138 Plasma cell OC515 2.5
CD203c BA PC7 5
Total amount 42.5
Abbreviations: NE, neutrophil; LY, lymphocyte; MO, monocyte; EO, eosino- phil; BA, basophil; IG, immature granulocyte; BL, blast; HPC, hematopoietic progenitor cells; LCA, leukocyte common antigen; PC5.5, Phycoerythrin-Cy- anin 5.5; PE, R-Phycoerythrin; PB, Pacific Blue; APC, Allophycocyanin;
APC700, APC-Alexa Fluor 700; ECD, PE-Texas Red; FITC, Fluorescein iso- thiocyanate; APC750, APC-Alexa Fluor 750; OC515, Orange Cytognos 515;
PC7, Phycoerythrin-Cyanin 7.
fluorescence intensity of each antibody in the premixed reagent was the same as that of freshly mixed antibodies for over one week. In brief, 100 µL of whole blood was mixed with 42.5 µL of the premixed reagent and incubated for 20 minutes at room temperature. RBCs were broken down by incubation in a lysis solution (Versalyse Solution, Beckman Coulter) for 15 minutes.
Without washing, 20,000 cells were acquired.
The 11-antibody plot for 10-color LeukoDiff was as follows:
CD36- FITC (Fluorescein isothiocyanate), CD33-PE (R-Phycoer- ythrin), CD13-PE, CD34-ECD (PE-Texas Red), CD5-PC5.5 (Phy- coerythrin-Cyanin 5.5), CD203c-PC7 (Phycoerythrin-Cyanin 7), CD19-APC (Allophycocyanin), CD16-APC700 (APC-Alexa Fluor 700), CD45-APC750 (APC-Alexa Fluor 750), CD15-PB (Pacific Blue), and CD138-OC515 (Orange Cytognos 515). WBCs were classified into the following 17 cell populations: mNE, total LY, T LY, B LY, CD5, and CD19 co-expressing LY(5+19+LY), natural killer cell (NK), total MO, 16+MO, EO, BA, IG, myeloblast (My BL), B BL, T BL, myeloid antigen-positive B BL (My+B BL), CD19-PC (19-PC), and 19+PC (Table 1).
The total WBC count was determined using an XE-2100 auto- mated hematology analyzer (Sysmex, Kobe, Japan). With the 10-color LeukoDiff method, the cut-off of normal and abnormal (including IG, BL, and PC) cell populations was set at 1%.
Gating strategy for subpopulations
The gating strategy was established from the 10-Color LeukoDiff dot plot A (Fig. 1) of the whole nucleated cell (WN). In plot A, the N area contains nRBCs, platelets, and RBC debris, and we excluded the N area, including nRBCs. From the WN gate, we created orientating gates (A), (B), and (C) so that we could not identify the nRBCs. As described in Table 2, the first orientating (A) gate could identify mNE, MO, EO, IG, BL, and PC. From the second orientating (B) gate, partial mN, BA, and BL could be identified. The third orientating (C) gate could identify B, T-LY, NK, and BL. The BL lineage could be detected using CD34 co- expressing My BL by using CD13 and 33. B BL and T BL could be detected using CD19 and CD5, respectively (Fig. 1; Table 2).
The gating strategy for counting each cell population was as follows: we used a stepwise and minimal gate adjustment and defined the 17 cell populations described above and shown in Table 2. In setting each cut-off value, for example, that between the (A) gate and (C) gate, a histogram was used to set a cut-off value as the groove between the two positive peaks. This method was applied to establish cut-off levels for all other cell populations. The (A) gate primarily contained a large percent- age of mNE (red), MO (blue), EO (pink), IG (yellow), and PC
(dark blue); the (C) gate mainly contained LY (green); and the (B) gate mostly contained BL (sky blue) and BA (flesh color).
The mNE were counted from the (A) gate after eliminating MO (CD36+) on the CD36/FSC scattergram, and the cells show- ing CD15+CD16+ expression were counted (Fig. 1, Plot D, and Table 2). In addition, a few mNE contaminated in the (B) gate were identified by CD203-CD15+ (Fig. 1, Plot E, and Table 2).
The LY consisted of T LY, B LY, and NK. The T LY and B LY populations were counted from the (C) gate using CD5+CD19- and CD5-19+, respectively (Fig. 1, Plot F, and Table 2). The NK were counted from the L region by CD16+CD36- (Fig. 1, Plots F and G). The 5+19+LY were counted from the (C) gate. The MO were counted from the (A) and (C) gates by CD36+/FSC (Fig. 1, Plots I and J). The 16+MO were identified on CD16 histogram plots from total MO (MO+MO1) using CD16 (Table 2).
The EO and IG were initially counted from the (A) gate by CD15+CD16-CD45 and CD15+CD16-CD45- (Fig. 1, Plots D, K, and L, Table 2), which menas that the (G) region was separated from (A) gate using CD36 (Fig. 1, Plots B and C). Subsequently, the (H) region (CD15+CD16-) was identified from the (G) region using CD15 and CD16 (Fig. 1, Plots D). Lastly, the EO and IG were identified on CD45 histogram plots from the (H) region (Fig. 1, Plots K and L). The BA count was calculated by the sum of CD203c+/CD15- cells in the (B) gate (Fig. 1, Plot N, Table 2) and CD203+/CD36- cells in the (C) gate (Fig. 1, Plot O, and Ta- ble 2).
The BL population was initially identified using the (B) gate as CD203c− CD15-, and CD36- cells. The BA population was ex- cluded based on CD203c expression, and mNE were excluded based on CD15 expression (Fig. 1, Plot Q). From the P region, platelets and RBC debris were eliminated by expression of CD36 using a histogram of CD36, and the CD36- region was the BL region (Fig. 1, Plot R). The lineages of BL were determined as follows: CD (13+33)+as my BL, CD19+as B BL, and CD5+as T BL (Fig. 1, Plots P-U), regardless of CD34 expression. The My+B BL cells were counted only when both CD (13+33) and CD19 were positive in CD34+cells.
PCs (dark blue) were identified from (A) gate as CD36-CD15- CD16-CD138+ cells (Fig. 1, Plots V-Y). The PCs were then fur- ther divided into CD19- of MM and CD19+ of reactive (normal) PC (Fig. 1, Plot Y). The nRBCs were excluded from 10-color LeukoDiff analysis because they can be easily destroyed during the lysing of RBCs.
Statistical analysis
Binomial envelope scatter plots and linear regression analysis
for normal cell populations (neutrophil (NE), LY, MO, EO, and BA) were performed to compare the results of 10-color Leuko- Diff and manual diff. Binomial XY scatter plots and linear regres-
sion analysis were also conducted for the abnormal cell popula- tions, including IG, BL, and PC. Receiver operating characteris- tic (ROC) curves for IG and BL were analyzed, and their sensi- Fig. 1. 10-color LeukoDiff plots of whole nucleated cell (WN) (A), orientating gate (B), neutrophils (C, D, and E), lymphocytes (T, B, NK, 5+
19+) (F, G, and H), monocytes (I and J), eosinophils (K), immature granulocytes (L), chronic myelogeneous leukemia (M), basophils (N and O), acute myeloid leukemia (P), blasts (Q and R), myeloblasts (S), B blasts (T), myeloid antigen-positive B blasts (U), and 19-plasma cells (V, W, X, and Y) in peripheral blood samples.
Abbreviation: NK, natural killer cells.
A
F
K
P
U
B
G
L
Q
V
C
H
M
R
W
D
I
N
S
X
E
J
O
T
Y
SSC
FSC
CD19-APC
5-PC5.5
Count
45-APC750
SSC
45-APC750
13+33PE
CD19-APC
SSC
45-APC750
16-APC700
36-FITC
Count
45-APC750
203C-PC7
15-PB
SSC
45-APC750
36-FITC
FSC
CD19-APC
5-PC5.5
SSC
45-APC750
Count
36-FITC
36-FITC
FSC
15-PB
16-APC700
36-FITC
FSC
203C-PC7
15-PB
13+33PE
34-ECD
15-PB
16-APC700
203-PC7
15-PB
203C-PC7
36-FITC
203C-PC7
36-FITC
CD19-APC
34-ECD
CD19-APC
138-CO
tivity and specificity were calculated when the cut-off value was set at 1%. All statistical analyses were performed using MedCalc 15.0 (MedCalc Software, Ostend, Belgium), and the level of sta- tistical significance was set at P <0.05.
RESULTS
Among the 91 samples, manual diff revealed BL in 37 samples and IG in 34 samples. The correlation coefficients between the manual diff and 10-color LeukoDiff in leukopenia, normal WBC count, and leukocytosis samples are shown in Table 3.
mNE, LY, MO, EO, BA, and IG
The correlation of mNE counts between manual diff and 10-color LeukoDiff was strong (r =0.95, P <0.001) for all 91
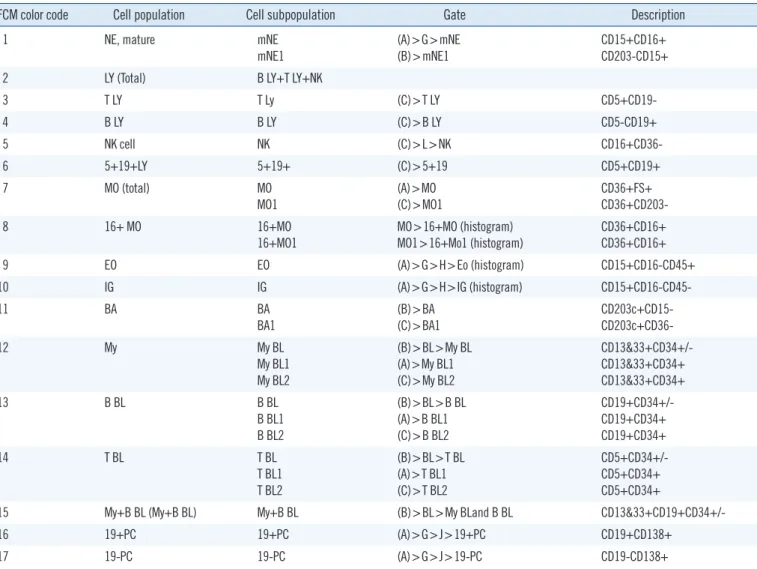
Table 2. Cellular expression profiles and FCM gate strategies of 17 cells populations in peripheral blood
FCM color code Cell population Cell subpopulation Gate Description
1 NE, mature mNE
mNE1
(A)>G>mNE (B)>mNE1
CD15+CD16+
CD203-CD15+
2 LY (Total) B LY+T LY+NK
3 T LY T Ly (C)>T LY CD5+CD19-
4 B LY B LY (C)>B LY CD5-CD19+
5 NK cell NK (C)>L>NK CD16+CD36-
6 5+19+LY 5+19+ (C)>5+19 CD5+CD19+
7 MO (total) MO
MO1 (A)>MO
(C)>MO1 CD36+FS+
CD36+CD203-
8 16+ MO 16+MO
16+MO1
MO>16+MO (histogram) MO1>16+Mo1 (histogram)
CD36+CD16+
CD36+CD16+
9 EO EO (A)>G>H>Eo (histogram) CD15+CD16-CD45+
10 IG IG (A)>G>H>IG (histogram) CD15+CD16-CD45-
11 BA BA
BA1 (B)>BA
(C)>BA1 CD203c+CD15-
CD203c+CD36-
12 My My BL
My BL1 My BL2
(B)>BL>My BL (A)>My BL1 (C)>My BL2
CD13&33+CD34+/- CD13&33+CD34+
CD13&33+CD34+
13 B BL B BL
B BL1 B BL2
(B)>BL>B BL (A)>B BL1 (C)>B BL2
CD19+CD34+/- CD19+CD34+
CD19+CD34+
14 T BL T BL
T BL1 T BL2
(B)>BL>T BL (A)>T BL1 (C)>T BL2
CD5+CD34+/- CD5+CD34+
CD5+CD34+
15 My+B BL (My+B BL) My+B BL (B)>BL>My BLand B BL CD13&33+CD19+CD34+/-
16 19+PC 19+PC (A)>G>J>19+PC CD19+CD138+
17 19-PC 19-PC (A)>G>J>19-PC CD19-CD138+
Abbreviations: FCM, flow cytometry; mNE, mature neutrophil; LY, lymphocyte; NK, natural killer; MO, monocyte; EO, eosinophil; My, myeloblast; IG, imma- ture granulocyte; BA, basophil; BL, blast; PC, plasma cell; My+ B BL, myeloid antigen-positive B blast.
Table 3. Correlation coefficients between the manual differential counts and 10-color LeukoDiff results according to total leukocyte counts
Cell population
Total WBC*
Leukopenia (N=24) Normal (N=38) Leukocytosis (N=29)
mNE 0.94 0.94 0.95
LY 0.84 0.93 0.94
MO 0.94 0.83 0.86
EO 0.94 0.97 0.99
BA 0.52 0.59 0.91
IG 0.42 0.85 0.98
BL 0.99 0.99 0.99
*Leukopenia, WBC <4.00 ×10⁹/L 4; Normal, WBC =4.00–10.00 ×10⁹/L;
Leukocytosis, WBC >10.00×10⁹/L; all correlations were significant at P <0.05.
Abbreviations: WBC, white blood cells; mNE, mature neutrophil; LY, lympho- cyte; MO, monocyte; EO, eosinophil; BA, basophil; IG, immature granulocyte;
BL, blast.
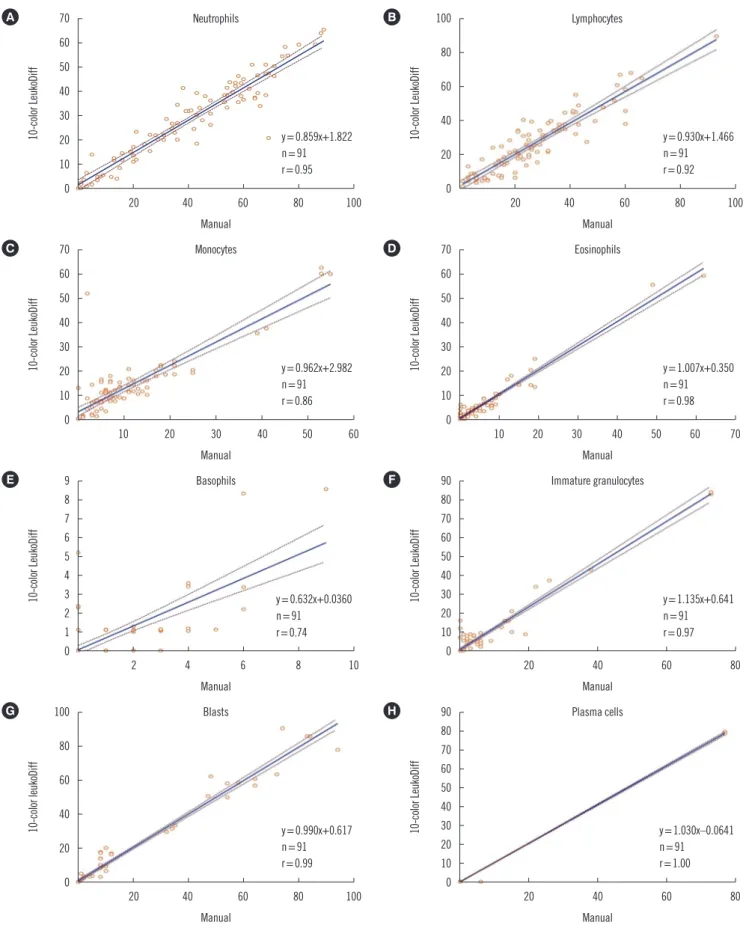
Fig. 2. Binomial scatter plots and correlations between manual differential count and 10-color LeukoDiff results for neutrophils (A), lym- phocytes (B), monocytes (C), eosinophils (D), basophils (E), immature granulocyte (F), blasts (G), and plasma cells (H).
70 60 50 40 30 20 10 0
20 40 60 80 100 Manual
y=0.859x+1.822 n=91 r=0.95
10-color LeukoDiff
A
70 60 50 40 30 20 10 0
70 60 50 40 30 20 10 0
10 20 30 40 50 60 10 20 30 40 50 60 70
Manual Manual
y=0.962x+2.982 n=91 r=0.86
y=1.007x+0.350 n=91 r=0.98
10-color LeukoDiff 10-color LeukoDiff
C D
9 8 7 6 5 4 3 2 1 0
90 80 70 60 50 40 30 20 10 0
90 80 70 60 50 40 30 20 10 0
2 4 6 8 10 20 40 60 80
20 40 60 80
Manual Manual
Manual y=0.632x+0.0360
n=91 r=0.74
y=1.135x+0.641 n=91 r=0.97
y=1.030x–0.0641 n=91 r=1.00
10-color LeukoDiff 10-color LeukoDiff10-color LeukoDiff
E F
100 H
80
60
40
20
0
20 40 60 80 100 Manual
y=0.990x+0.617 n=91 r=0.99
10-color leukoDiff
G
100
80
60
40
20
0
20 40 60 80 100 Manual
y=0.930x+1.466 n=91 r=0.92
10-color LeukoDiff
B
Monocytes Eosinophils
Lymphocytes Neutrophils
Basophils Immature granulocytes
Plasma cells Blasts
samples, with a linear relationship of y=0.859x+1.822 (Fig. 2).
Correlation coefficients varied according to the NE counts: r=
0.93 in the case of neutropenia ( <1.50 ×10⁹/L), r =0.95 for normal NE count (1.50–7.50 ×10⁹/L), and r =0.91 for neutro- philia (>7.50×10⁹/L).
The correlation of LY counts between manual diff and 10-color LeukoDiff for all 91 samples was strong (r =0.92, P <0.001), with a linear relationship of y=0.930x+1.466 (Fig. 2). The spe- cific characteristics of LY cases were as follows: there were two lymphocytosis cases with LY >10.00×10⁹/L, including one CLL case and one B-ALL case. The CLL case was of a 64-year-old male with a WBC count of 23.99×10⁹/L. The manual diff results showed 3% mNE, 93% LY, 3% MO, and 1% BA, and the 10-color LeukoDiff results showed 8% mNE, 90% LY, and 2%
MO. The CD5+CD19+ co-expressing cells accounted for 71% in 10-color LeukoDiff (Fig. 1H). The B-ALL case was of a 29-year- old male with a WBC count of 157.64×10⁹/L. The manual diff results showed 5% mNE, 20% LY, 1% MO, and 74% BL, and the results for 10-color LeukoDiff were 2% mNE, 6% LY, 1%
MO, and 91% BL. Compared with the manual diff method, there was a 14% difference in the LY count and a 17% differ- ence in the BL count (data not shown). In this case, the BL population was CD34-positive, which confirmed that the results of 10-color LeukoDiff were correct.
There was a strong correlation (r=0.86; P <0.001; y=0.962x+
2.982) between the manual diff and 10-color LeukoDiff for the MO counts of all 91 samples (Fig. 2). However, when the MO count was <1.00×10⁹/L (74 cases), the correlation coefficient was reduced to r =0.59, and when it was >1.00 ×10⁹/L (17 cases), it was increased to r=0.97.
The correlation of EO counts between the two methods was very strong (r =0.98; P <0.001; y =1.007x+0.350) for all 91 samples (Fig. 2). The correlation coefficient varied according to the EO count. When the EO count was >0.50×10⁹/L (eosino- philia), the correlation coefficient was 0.98, whereas it was 0.88 in other cases.
The correlation was moderate for the BA count between the two methods (r=0.74; P <0.001; y=0.632x+0.0360; Fig. 2). In four basophilia cases (>0.50×10⁹/L), the correlation coefficient was 0.77; however, in samples with <0.50×10⁹/L BA, the cor- relation coefficient was the lowest, at 0.57. The 10-color Leuko- Diff result was lower than the manual diff result in 25 cases.
There was a very strong correlation for the IG count (r=0.97;
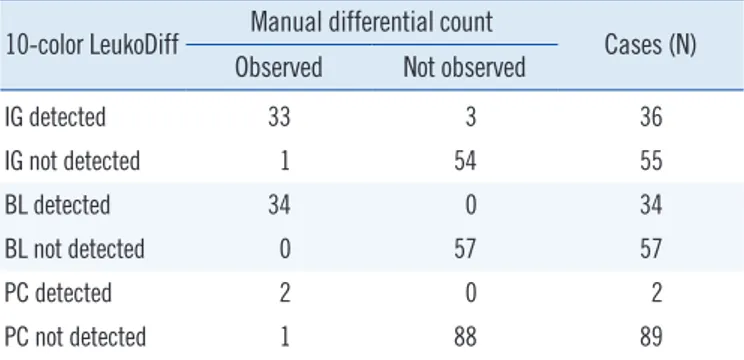
P <0.001; y =1.135x+0.641) for all 91 samples (Fig. 2). The sensitivity of 10-color LeukoDiff was 97.1%, and the specificity was 94.7% at the cut-off value of 1% (Table 4). Furthermore,
Table 4. Concordance between manual differential count and 10-color LeukoDiff for IG, BL, and PC
10-color LeukoDiff Manual differential count
Cases (N) Observed Not observed
IG detected 33 3 36
IG not detected 1 54 55
BL detected 34 0 34
BL not detected 0 57 57
PC detected 2 0 2
PC not detected 1 88 89
Abbreviations: IG, immature granulocyte; BL, blast; PC, plasma cell.
there were no significant differences in the average comparison.
In ROC curve analysis, the area under the curve (AUC) was 0.871. In the manual diff, IG was detected in 34 samples, rang- ing from 1% to 73%. The 10-color LeukoDiff detected IG rang- ing from 1% to 85%. There was a significant difference in the correlation coefficient, which increased with the increase in the WBC count (Table 3). This pattern was also applicable to mNE, LY, BA, EO, and IG, but not to MO and BL (Table 3). There were three cases, in which IG was not observed with manual diff but was detected with only 10-color LeukoDiff. All of these cases showed the presence of BL in both the second manual diff and 10-color LeukoDiff. Additional microscopic examinations showed a significant number of IG gathered at the edge of the slides.
The concordance results of IG are summarized in Table 4.
BL and PC
The two methods showed a strong correlation for BL count (r=0.99; P <0.001; linear regression, y=0.990x+0.617) for all 91 samples (Fig. 2). There was no difference in the correlation coefficients according to WBC counts (Table 3). Thirty-four samples showed BL in the manual diff method, ranging from 1% to 94%. When the cut-off value of BL was set to 1% in 10-color LeukoDiff, BL was detected in all 34 cases. There was no discrepancy between 10-color LeukoDiff and manual diff in detecting BL. Binomial scatter plots of correlations between the two methods are shown in Fig. 2. There was also no significant difference between the methods in the average comparison.
The sensitivity and specificity of 10-color LeukoDiff were both 100% at the 1% cut-off. The concordance results of BL are summarized in Table 4.
Two patients showed PC in the manual diff; they were diag- nosed as having MM and Waldenstrom’s macroglobulinemia, respectively. The 10-color LeukoDiff was performed repeatedly
on the sample of the patient diagnosed as having MM. The first measurement revealed a count of 15% mNE, 5% LY, and 80%
PC, while the second measurement revealed 16% mNE, 5% LY, and 79% PC. This finding was quite acceptable in terms of re- producibility. Although three cases showed PC in the manual diff, they showed a remarkably strong correlation (r=1.00; P <
0.001; linear regression, y =1.030x−0.0641) (Fig. 2). There were no significant differences in the average comparison. Inter- estingly, there was one discrepant case (the patient diagnosed as having Waldenstrom’s macroglobulinemia) between the two methods, in which approximately 6% of the PC was observed in only manual diff. We investigated the manual slide and 10-color LeukoDiff data to determine the plasmacytoid cell lineage, and no CD138-expressing cells were observed in 10-color LeukoDiff.
It suggested that these cells should be regarded as LY rather than as PC.
DISCUSSION
Several recent studies have discussed the application of FCM for WBC differential counts [7, 8, 11, 12]. We validated 10-color LeukoDiff FCM, which is time-saving in comparison with previ- ous FCM methods, with a hands-on time of only 20 minutes for analyzing samples from 20 cases.
The key to this method lies in the identification of 17 different cell populations using 10 colors and 11 antibodies in a single tube. The ability to analyze more antigens on the cell membrane increases the accuracy of FCM differential counts. Analyzing the same number of antibodies in a single tube, rather than in mul- tiple tubes, markedly increases the power of cell differentiation due to the ability to uncover the presence of multiple antigen- expressing cells. Our newly developed protocol for a gate strat- egy for the detection of 17 cell populations using 11 antibodies greatly reduces the need for additional adjustment of LY, EO, IG, and BL gates, which was required in previous methods [7, 8].
We used several gates for counting each type of WBC. For ex- ample, the BL population was defined by CD45 expression and the SS plot using the relative position of other granulocytes (i.e., mNE, BA, EO), MO, and LY determined in previous studies [8, 11]. However, the morphology of BL is highly variable, and some BL are found out of the range of this region, while other cells are also frequently contaminated in this region [6, 8].
Therefore, we searched for BL in all three large gates and then excluded mature cells using the antigen expression profile in a step-by-step manner. Most BL would be included in the (B) gate, although other BL located in the (A) and (C) gates could
be detected using CD34. The total BL count represents the sum of BL in the three gates. Other types of WBC populations, such as mNE, MO, and BA, were also calculated from the sum of two or more large gates. Theoretically, there was no missed cell type.
The correlation of the 10-color LeukoDiff with manual diff was overall quite strong. There were three discrepant cases, in which IG was not counted in the manual diff but was detected in 10-color LeukoDiff. Through additional microscopic inspec- tion, IG aggregations were observed at the edge of the slide.
Therefore, we confirmed that the 10-color LeukoDiff results were correct; 10-color LeukoDiff counted not only the normal LY subpopulation but also CD5+CD19+ CLL cells using CD5 and CD19. Because there are many conditions associated with lym- phocytosis, it is important to be able to suggest CLL based on routine complete blood count. In addition, 10-color LeukoDiff reports LY subset results. Therefore, this method will be useful in various clinical settings, such as for monitoring immune sta- tus before and after bone marrow and organ transplantations [13-17].
The MO count was derived from the (A) and (C) gates and di- vided into CD16+ MO and CD16- MO populations, because their clinical significance has been reported [18]. The EO count was derived from only the (A) gate, because EO shows high side scatter and is predicted to reside in the (A) gate. The BA count was derived from the (B) and (C) gates. The correlation of the 10-color LeukoDiff BA count with the manual diff BA count was weaker than that of other cell populations possibly because their count was very low.
The most important aspect of 10-color LeukoDiff is its ability to detect BL more accurately and to further differentiate the BL lineages. There were 37 cases showing BL in the manual diff with various hematologic malignancies, such as AML, ALL, CML, MDS, and CLL. The 10-color LeukoDiff showed BL in all of these cases, but none in the remaining 54 cases. There was no discrepancy in BL detection between the manual diff and the 10-color LeukoDiff counts. Furthermore, the 10-color Leu- koDiff count showed the BL lineage, which is very important for the diagnosis of hematologic malignancies [19-22]. The 10-color LeukoDiff reports BL lineages as My BL, B BL, T BL, and My+B BL. Although this method cannot completely replace FCM analysis of BL, it is helpful for making an initial diagnosis in patients showing BL. This discrimination is valuable for moni- toring patients with MM.
Although 10-color LeukoDiff requires various types of antibod- ies and skilled workers to carry out the complex operations and
quality control, the technology could be simplified by employing a premixed reagent and by developing an analysis algorithm for automation in the future.
A limitation of our study was that we could not compare our data with those obtained with an automated hematology ana- lyzer. Application of this method might have improved the un- derstanding of the variable expression of CD markers among cells and the development of FCM gating strategy designs. In summary, 10-color LeukoDiff provided accurate and extended WBC differential counts. The system has considerable clinical value, especially for monitoring patients with hematologic dis- eases, such as acute leukemia, CLL, and MM.
Authors’ Disclosures of Potential Conflicts of Interest
No potential conflicts of interest relevant to this article were re- ported.
Acknowledgements
This work was supported by the Technology Innovation Program (No: 10049771, Development of Highly-Specialized Platform for IVD Medical Devices) funded by the Ministry of Trade, Industry
& Energy, Korea.
REFERENCES
1. Meintker L, Ringwald J, Rauh M, Krause SW. Comparison of automated differential blood cell counts from Abbott Sapphire, Siemens Advia 120, Beckman Coulter DxH 800, and Sysmex. XE-2100 in normal and path- ological samples. Am J Clin Pathol 2013;139:641-50.
2. Eilertsen H, Vøllestad NK, Hagve TA. The usefulness of blast flags on the Sysmex XE-5000 is questionable. Am J Clin Pathol 2013;139:633-40.
3. Barnes PW, McFadden SL, Machin SJ, Simson E, International Consen- sus Group For Hematology. The International Consensus Group for He- matology review: suggested criteria for action following automated CBC and WBC differential analysis. Lab Hematol 2005;11:83-90.
4. Novis DA, Walsh M, Wilkinson D, St Louis M, Ben-Ezra J. Laboratory productivity and the rate of manual peripheral blood smear review: a College of American Pathologists Q-Probes study of 95,141 complete blood count determinations performed in 263 institutions. Arch Pathol Lab Med 2006;130:596-601.
5. Kim AH, Lee W, Kim M, Kim Y, Han K. White blood cell differential counts in severely leukopenic samples: a comparative analysis of different so- lutions available in modern laboratory hematology. Blood Res 2014;49:
120-6.
6. Faucher JL, Lacronique-Gazaille C, Frebet E, Trimoreau F, Donnard M, Bordessoule D, et al. “6 markers/5 colors” extended white blood cell
differential by flow cytometry. Cytometry A 2007;71:934-44.
7. Jo Y, Kim SH, Koh K, Park J, Shim YB, Lim J, et al. Reliable, accurate determination of the leukocyte differential of leukopenic samples by us- ing Hematoflow method. Korean J Lab Med 2011;31:131-7.
8. Kahng J, Kim Y, Kim M, Oh EJ, Park YJ, Han K. Flow cytometric white blood cell differential using CytoDiff is excellent for counting blasts. Ann Lab Med 2015;35:28-34.
9. Cossarizza A, De Biasi S, Gibellini L, Bianchini E, Bartolomeo R, Nasi M, et al. Cytometry, immunology, and HIV infection: three decades of strong interactions. Cytometry A 2013;83:680-91.
10. Ratei R, Karawajew L, Lacombe F, Jagoda K, Del Poeta G, Kraan J, et al. Discriminant function analysis as decision support system for the di- agnosis of acute leukemia with a minimal four color screening panel and multiparameter flow cytometry immunophenotyping. Leukemia 2007;21:1204-11.
11. Allou K, Vial JP, Bene MC, Lacombe F. The routine leukocyte differential flow cytometry HematoFlow method: a new flagging system for auto- matic validation. Cytometry B Clin Cytom 2015;88:375-84.
12. Im M, Chae H, Kim T, Park HH, Lim J, Oh EJ, et al. Comparative quan- titative analysis of cluster of differentiation 45 antigen expression on lymphocyte subsets. Korean J Lab Med 2011;31:148-53.
13. Buhlmann L, Buser AS, Cantoni N, Gerull S, Tichelli A, Gratwohl A, et al. Lymphocyte subset recovery and outcome after T-cell replete alloge- neic hematopoietic SCT. Bone Marrow Transplant 2011;46:1357-62.
14. Fernandez-Ruiz M, Silva JT, Lopez-Medrano F, Allende LM, San Juan R, Cambra F, et al. Post-transplant monitoring of NK cell counts as a sim- ple approach to predict the occurrence of opportunistic infection in liver transplant recipients. Transpl Infect Dis 2016;18:552-65.
15. Fujimaki K, Maruta A, Yoshida M, Kodama F, Matsuzaki M, Fujisawa S, et al. Immune reconstitution assessed during five years after allogeneic bone marrow transplantation. Bone Marrow Transplant 2001;27:1275- 81.
16. Rueff J, Medinger M, Heim D, Passweg J, Stern M. Lymphocyte subset recovery and outcome after autologous hematopoietic stem cell trans- plantation for plasma cell myeloma. Biol Blood Marrow Transplant 2014;
20:896-9.
17. van de Berg PJ, Hoevenaars EC, Yong SL, van Donselaar-van der Pant KA, vanTellingen A, Florquin S, et al. Circulating lymphocyte subsets in different clinical situations after renal transplantation. Immunology 2012;
136:198-207.
18. Ziegler Heitbrock L. The CD14+ CD16+ blood monocytes: their role in infection and inflammation. J Leukoc Biol 2007;81:584-92.
19. Kalina T, Flores-Montero J, Lecrevisse Q, Pedreira CE, van der Velden VH, Novakova M, et al. Quality assessment program for EuroFlow proto- cols: summary results of four-year (2010-2013) quality assurance rounds. Cytometry A 2015;87:145-56.
20. Matarraz S, Almeida J, Flores-Montero J, Lecrevisse Q, Guerri V, Lopez A, et al. Introduction to the diagnosis and classification of monocytic-lin- eage leukemias by flow cytometry. Cytometry B Clin Cytom 2017;92:
218-27.
21. van Dongen JJ, Lhermitte L, Bottcher S, Almeida J, van der Velden VH, Flores-Montero J, et al. EuroFlow antibody panels for standardized n-di- mensional flow cytometric immunophenotyping of normal, reactive and malignant leukocytes. Leukemia 2012;26:1908-75.
22. Zare H, Bashashati A, Kridel R, Aghaeepour N, Haffari G, Connors JM, et al. Automated analysis of multidimensional flow cytometry data im- proves diagnostic accuracy between mantle cell lymphoma and small lymphocytic lymphoma. Am J Clin Pathol 2012;137:75-85.