ISSN 2234-3806 • eISSN 2234-3814
http://dx.doi.org/10.3343/alm.2016.36.5.489
Multiplex Assay of Second-Line Anti-Tuberculosis Drugs in Dried Blood Spots Using Ultra-Performance Liquid Chromatography-Tandem Mass Spectrometry
Kyunghoon Lee, M.D.1,2, Sun-Hee Jun, M.T.3, Minje Han, M.D.1,4, Sang Hoon Song, M.D.1,2, Jong Sun Park, M.D.5, Jae Ho Lee, M.D.5, Kyoung Un Park, M.D.1,3, and Junghan Song, M.D.1,3
Department of Laboratory Medicine1, Seoul National University College of Medicine, Seoul; Department of Laboratory Medicine2, Seoul National University Hospital, Seoul; Department of Laboratory Medicine3, Seoul National University Bundang Hospital, Seongnam; Department of Laboratory Medicine4, Sheikh Khalifa Specialty Hospital, Ras Al Khaimah, United Arab Emirates; Department of Internal Medicine5, Seoul National University Bundang Hospital, Seongnam, Korea
As dried blood spots (DBSs) have various advantages over conventional venous blood sampling, some assays for detection of one or two anti-tuberculosis (TB) drugs in DBSs have been developed. However, there are no assays currently available for the simultane- ous measurement of three or more anti-TB drugs in DBSs. In this study, we developed and evaluated a multiplex method for detecting nine anti-TB drugs including streptomy- cin, kanamycin, clarithromycin, cycloserine, moxifloxacin, levofloxacin, para-aminosalicylic acid, prothionamide, and linezolid in DBSs by using ultra-performance liquid chromatog- raphy-tandem mass spectrometry (UPLC-MS/MS). Seventy-nine patient samples of DBS were analyzed on the UPLC-MS/MS system. All drug concentrations were determined within 4 min, and assay performance was evaluated. All drugs were clearly separated without ion suppression. Within-run and between-run precisions were 1.7-13.0% and 5.7- 17.0%, respectively, at concentrations representing low and high levels for the nine drugs.
Lower limits of detection and quantification were 0.06-0.6 and 0.5-5.0 μg/mL, respec- tively. Linearity was acceptable at five level concentrations for each drug. Correlations be- tween drug concentrations in plasma and DBSs by using Passing-Bablock regression and Pearson’s rho (ρ, 0.798-0.989) were acceptable. In conclusion, we developed a multiplex assay to measure nine second-line anti-TB drugs in DBSs successfully. This assay pro- vided convenient and rapid drug quantification and could have applications in drug moni- toring during treatment.
Key Words: Anti-tuberculosis drug, Tandem mass spectrometry, Dried blood spot, Multi- plex analysis, Therapeutic drug monitoring
Received: February 4, 2016 Revision received: March 9, 2016 Accepted: May 23, 2016
Corresponding author: Junghan Song Department of Laboratory Medicine, Seoul National University Bundang Hospital, 82 Gumi-ro 173 Beon-gil, Bundang-gu, Seongnam 13620, Korea
Tel: +82-2-2228-2442 Fax: +82-2-364-1583 E-mail: [email protected]
© The Korean Society for Laboratory Medicine This is an Open Access article distributed under the terms of the Creative Commons Attribution Non-Commercial License (http://creativecom- mons.org/licenses/by-nc/4.0) which permits unrestricted non-commercial use, distribution, and reproduction in any medium, provided the original work is properly cited.
Therapeutic drug monitoring (TDM) of second-line anti-tubercu- losis (TB) drugs becomes increasingly important to assess pa- tients with multidrug-resistant (MDR) or extensively drug-resis- tant (XDR) TB due to current complex treatments [1, 2]. Inap- propriate dosing due to pharmacokinetic variability of anti-TB drugs is a main casual factor in the emergence of drug-resistant Mycobacterium tuberculosis strains [3, 4]. We recently reported
on a multiplex assay for nine second-line anti-TB drugs, namely, streptomycin, kanamycin, clarithromycin, cycloserine, moxiflox- acin, levofloxacin, para-aminosalicylic acid (PAS), prothion- amide, and linezolid, in human sera by using ultra-performance liquid chromatography-tandem mass spectrometry (UPLC-MS/
MS) [5]. Dried blood spots (DBSs) have various advantages over conventional venous blood sampling, including easier sampling,
storage, and transportation, thereby enabling TDM even in re- mote areas [6]. Owing to these advantages, assays with DBSs for one or two anti-TB drugs like moxifloxacin, linezolid, rifampi- cin and clarithromycin have been developed [7-9]. However, an assay for simultaneously measuring three or more anti-TB drugs in DBSs is currently unavailable. We developed an UPLC-MS/
MS method for simultaneously measuring concentrations of these nine second-line anti-TB drugs in DBSs.
Standard plasma were prepared by spiking stock solutions into blank plasma. Standard whole-blood with six drug concen- trations (streptomycin, kanamycin, cycloserine, and PAS at 0, 5, 10, 20, 40, and 100 μg/mL; clarithromycin and prothionamide at 0, 0.5, 1, 2, 4, and 10 μg/mL; and moxifloxacin, levofloxacin, and linezolid at 0, 1, 2, 4, 8, and 20 μg/mL) were prepared by mixing equal amounts of standard plasma and blank packed red blood cells. For standard DBSs, 100 μL of six standard whole-blood was added dropwise onto Whatman 903 filter pa- per by using an adjustable pipette [10, 11]. After samples were dried for 12 hr at room temperature, they were stored in a
sealed bag at -20°C.
Total 79 DBS patient samples were prepared with similar method to that of plasma with some modifications [5]. In brief, two 3.2-mm diameter punched-out DBSs made by the same process as the standards were extracted by using 100 μL 50%
methanol in distilled water with 50 μL internal standard in the same mixed solution except for streptomycin and kanamycin.
For these drugs, 5 μL of 3M HCl were also added. After 20 min of sonication, mixtures were centrifuged at 15,700g for 5 min;
90 µL supernatant was mixed with 90 μL methanol. In the case of two drugs, 5 μL of 1M NaOH was added to the mixtures. Af- ter centrifugation at 15,700g for 5 min, the supernatants were injected into a UPLC system. Plasma samples were prepared as described previously [5].
All samples were analyzed on an LC-30A Nexera UPLC sys- tem (Shimadzu Co., Kyoto, Japan) with an AQUITY Waters HSS T3 column (50.0×2.1 mm, 1.8 μm; Waters, Watford, UK). The flow rate was 0.25 mL/min. The mobile phase was a gradient of a mixture of 10 mM ammonium formate in 0.1% formic acid
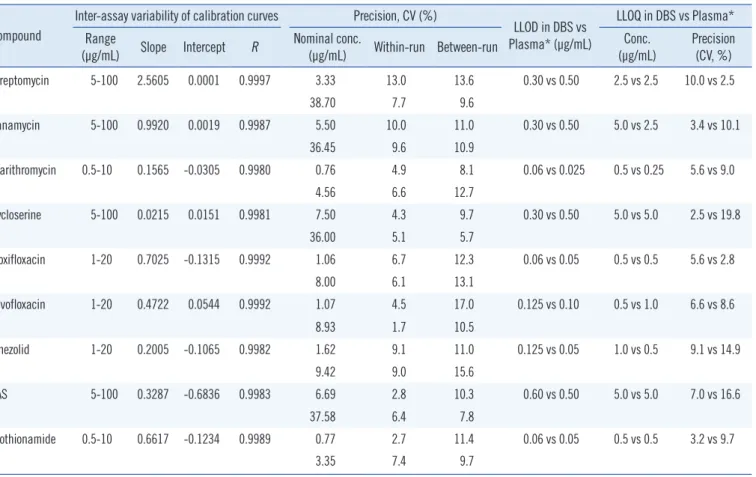
Table 1. Inter-assay variability of calibration curves, within-run and between-run precision, lower limit of detection, and lower limit of quan- tification for UPLC-MS/MS assay for second line anti-tuberculosis drugs in dried blood spots
Compound
Inter-assay variability of calibration curves Precision, CV (%)
LLOD in DBS vs Plasma* (µg/mL)
LLOQ in DBS vs Plasma*
Range
(µg/mL) Slope Intercept R Nominal conc.
(µg/mL) Within-run Between-run Conc.
(µg/mL) Precision (CV, %)
Streptomycin 5-100 2.5605 0.0001 0.9997 3.33 13.0 13.6 0.30 vs 0.50 2.5 vs 2.5 10.0 vs 2.5
38.70 7.7 9.6
Kanamycin 5-100 0.9920 0.0019 0.9987 5.50 10.0 11.0 0.30 vs 0.50 5.0 vs 2.5 3.4 vs 10.1
36.45 9.6 10.9
Clarithromycin 0.5-10 0.1565 -0.0305 0.9980 0.76 4.9 8.1 0.06 vs 0.025 0.5 vs 0.25 5.6 vs 9.0
4.56 6.6 12.7
Cycloserine 5-100 0.0215 0.0151 0.9981 7.50 4.3 9.7 0.30 vs 0.50 5.0 vs 5.0 2.5 vs 19.8
36.00 5.1 5.7
Moxifloxacin 1-20 0.7025 -0.1315 0.9992 1.06 6.7 12.3 0.06 vs 0.05 0.5 vs 0.5 5.6 vs 2.8
8.00 6.1 13.1
Levofloxacin 1-20 0.4722 0.0544 0.9992 1.07 4.5 17.0 0.125 vs 0.10 0.5 vs 1.0 6.6 vs 8.6
8.93 1.7 10.5
Linezolid 1-20 0.2005 -0.1065 0.9982 1.62 9.1 11.0 0.125 vs 0.05 1.0 vs 0.5 9.1 vs 14.9
9.42 9.0 15.6
PAS 5-100 0.3287 -0.6836 0.9983 6.69 2.8 10.3 0.60 vs 0.50 5.0 vs 5.0 7.0 vs 16.6
37.58 6.4 7.8
Prothionamide 0.5-10 0.6617 -0.1234 0.9989 0.77 2.7 11.4 0.06 vs 0.05 0.5 vs 0.5 3.2 vs 9.7
3.35 7.4 9.7
*LLOD and LLOQ data in plasma samples were obtained by the previous study [5].
Abbreviations: LLOD, lower limit of detection; LLOQ, lower limit of quantification; Conc., concentration; PAS, para-aminosalicylic acid.
(solvent A) and acetonitrile in 0.1% formic acid (solvent B). The total running time was 4 min. All drug concentrations were de- termined by using an AB Sciex API 6500 triple quadrupole tan- dem mass spectrometer (AB Sciex Pte., Ltd., Framingham, MA, USA).
All drugs and internal standards were clearly separated in the UPLC-MS/MS system, as in our previous study [5]. Ion suppres- sion, evaluated by the post-column infusion model method [12], was not observed at the retention time for any of the com- pounds.
Inter-assay calibration variability data were collected on five consecutive days. Linear and reproducible curves were ob- tained in the observed analytical ranges (Table 1). According to the CLSI EP6-A guideline [13], linearity was acceptable at five
concentrations for each drug (R >0.9990).
Values of within-run precision, determined by using 10 repli- cated analyses of quality control samples, were 2.7-13.0% at low concentrations and 1.7-9.6% at high concentrations. Values of between-run precisions, determined by measuring controls for 10 consecutive days, were 8.1-17.0% at low concentrations and 5.7-15.6% at high concentrations.
The lower limit of detection (LLOD) and lower limit of quantifi- cation (LLOQ) were defined as the lowest concentration with a signal-to-noise ratio of >3.0 and the lowest concentration with precision <20% and an accuracy within ±20%, respectively.
The LLOD and LLOQ were 0.06-0.30 and 0.5-5.0 μg/mL, re- spectively (Table 1). Compared with our previous study in plasma [5], LLOQs of DBSs were generally higher. According to the phar-
Fig. 1. Passing-Bablok regression with regression equations, Pearson’s rho, significance levels and Bland-Altman plots between measure- ments in DBS and plasma for second-line anti-TB drugs: kanamycin, cycloserine, moxifloxacin, levofloxacin, prothionamide, PAS, linezolid, and clarithromycin.
Abbreviations: DBS, dried blood spot; PAS, para-aminosalicylic acid.
macokinetic study of second-line anti-TB drugs [14], Cmax values of streptomycin, kanamycin, cycloserine, PAS, moxifloxacin, le- vofloxacin, and prothionamide were within linear ranges, and at least five times higher than the LLOQ for each drug.
All standard DBSs were tested again after being kept in a sealed bag at -20°C over 6 months, to assess their stability. Dif- ferences between the time points were within ±10%, except for streptomycin at low levels and prothionamide at both low and high levels.
Plasma and DBSs for the comparison study were obtained from residual samples of TB patients. This research was ap- proved by the Seoul National University Bundang Hospital Insti- tutional Review Board, and was conducted in accordance with the Declaration of Helsinki. Passing-Bablok regression analysis revealed strong similarity between drug concentrations in DBSs and in plasma (Fig. 1). For streptomycin, only two residual sam- ples were tested, and the results were 4.8/3.6 μg/mL and 2.1/2.7 μg/mL (plasma/DBS) respectively. The Pearson’s rho (ρ) of drugs ranged from 0.798 to 0.989 (P <0.0015). Although these values were lower than those of published single or dual drug assays [7-9], they are acceptable for TDM in MDR/XDR management. The concentration of each drug in DBSs showed a degree of negative bias compared with that in plasma, except for levofloxacin. Several factors cause a mismatch of drug con- centration between plasma and venous whole blood, including differential partition between red blood cells and plasma, and individual hematocrit variations [6]. Nevertheless, a very high positive correlation for clarithromycin, cycloserine, and PAS and high positive correlation for the other drugs were observed [15].
At first, the corresponding plasma values could be calculated from the DBSs by using the conversion equations for clarithro- mycin, cycloserine and PAS.
This study had some limitations. First, concentrations of more than a half of the samples were lower than the Cmax value be- cause most samples were not originally intended for TDM. Fur- ther studies into TDM should use samples collected immedi- ately before the test to assess and optimize such multiplex as- says. Second, we did not measure hematocrit and hence could not correct for the effect of hematocrit. This may cause differ- ences between plasma and DBS concentrations in some sam- ples. It is possible to measure the hematocrit directly from DBSs: potassium could be used to predict the hematocrit of DBS [16]. Third, our procedure is not universally applicable be- cause a 100-μL spotted volume cannot be drawn from a finger prick, and a falling drop of blood has volume of 30-50 μL. In addition, there were no paired samples obtained by finger prick
and venous puncture. Nevertheless, we successfully developed a method to measure nine second-line anti-TB drugs in DBSs simultaneously using UPLC-MS/MS.
So far, a few methods of TDM for second-line anti-TB drugs in plasma or DBSs have been developed [7-9]. Our study is the first description of a method for the simultaneous measurement of nine second-line anti-TB drugs in DBSs. The performance of our detection technique in DBSs, comparable with those of cur- rently applied methods using plasma, was feasible for applica- tion of TDM of second-line anti-TB drugs. We expect that such TDM of second-line anti-TB drugs using DBSs will be crucial in the identification and management of MDR/XDR TB.
Authors’ Disclosures of Potential Conflicts of Interest
No potential conflicts of interest relevant to this article were re- ported.
Acknowledgments
This work was supported by a grant from the Korean Health Technology R&D Project of the Ministry of Health & Welfare, Re- public of Korea (HI13C0892).
REFERENCES
1. Sotgiu G, Alffenaar JW, Centis R, D’Ambrosio L, Spanevello A, Piana A, et al. Therapeutic drug monitoring: how to improve drug dosage and patient safety in tuberculosis treatment. Int J Infect Dis 2015;32:101-4.
2. Park JS, Lee JY, Lee YJ, Kim SJ, Cho YJ, Yoon HI, et al. Serum levels of antituberculosis drugs and their effect on tuberculosis treatment out- come. Antimicrob Agents Chemother 2015;60:92-8.
3. Srivastava S, Pasipanodya JG, Meek C, Leff R, Gumbo T. Multidrug-re- sistant tuberculosis not due to noncompliance but to between-patient pharmacokinetic variability. J Infect Dis 2011;204:1951-9.
4. Pasipanodya JG, Srivastava S, Gumbo T. Meta-analysis of clinical stud- ies supports the pharmacokinetic variability hypothesis for acquired drug resistance and failure of antituberculosis therapy. Clin Infect Dis 2012;55:169-77.
5. Han M, Jun SH, Lee JH, Park KU, Song J, Song SH. Method for simul- taneous analysis of nine second-line anti-tuberculosis drugs using UPLC-MS/MS. J Antimicrob Chemother 2013;68:2066-73.
6. Vu DH, Alffenaar JW, Edelbroek PM, Brouwers JR, Uges DR. Dried blood spots: a new tool for tuberculosis treatment optimization. Curr Pharm Des 2011;17:2931-9.
7. Vu DH, Koster RA, Alffenaar JW, Brouwers JR, Uges DR. Determination of moxifloxacin in dried blood spots using LC-MS/MS and the impact of the hematocrit and blood volume. J Chromatogr B Analyt Technol Biomed Life Sci 2011;879:1063-70.
8. Vu DH, Bolhuis MS, Koster RA, Greijdanus B, de Lange WC, van Altena R, et al. Dried blood spot analysis for therapeutic drug monitoring of li-
nezolid in patients with multidrug-resistant tuberculosis. Antimicrob Agents Chemother 2012;56:5758-63.
9. Vu DH, Koster RA, Bolhuis MS, Greijdanus B, Altena RV, Nguyen DH, et al. Simultaneous determination of rifampicin, clarithromycin and their metabolites in dried blood spots using LC-MS/MS. Talanta 2014;121:9- 17.
10. Kim B, Lee MN, Park HD, Kim JW, Chang YS, Park WS, et al. Dried blood spot testing for seven steroids using liquid chromatography-tan- dem mass spectrometry with reference interval determination in the Korean population. Ann Lab Med 2015;35:578-85.
11. Legnini E, Orsini JJ, Mühl A, Johnson B, Dajnoki A, Bodamer OA. Anal- ysis of acid sphingomyelinase activity in dried blood spots using tandem mass spectrometry. Ann Lab Med 2012;32:319-23.
12. Annesley TM. Ion suppression in mass spectrometry. Clin Chem 2003;
49:1041-4.
13. Clinical Laboratory Standards Institute. Evaluation of the linearity of quantitative measurement procedures: a statistical approach; approved guideline. CLSI Document EP6-A. Wayne, PA: Clinical Laboratory Stan- dards Institute, 2003.
14. Park SI, Oh J, Jang K, Yoon J, Moon SJ, Park JS, et al. Pharmacokinet- ics of second-line antituberculosis drugs after multiple administrations in healthy volunteers. Antimicrob Agents Chemother 2015;59:4429-35.
15. Mukaka MM. Statistics corner: A guide to appropriate use of correlation coefficient in medical research. Malawi Med J 2012;24:69-71.
16. Capiau S, Stove VV, Lambert WE, Stove CP. Prediction of the hematocrit of dried blood spots via potassium measurement on a routine clinical chemistry analyzer. Anal Chem 2013;85:404-10.