서 론
만성질환은 세계적으로 사망 원인의 60% 이상, 장애 원인의 50%
이상을 차지하고, 가파른 비용의 증가로 관심이 집중되고 있는 질병 의 분야이며1) 국내에서도 사망의 60% 이상이 만성질환에 기인하고 있다.2)
심뇌혈관질환, 당뇨병 및 악성종양과 같은 만성질환의 예방 및 관 리를 위해서는 소위 Big 4 건강행동으로 불리는 ‘식이, 신체활동, 흡 연, 음주’를 건강한 방향으로 수정하는 것이 가장 효과적인 개입으 로 알려져 있다.3) 2013년 세계보건기구(World Health Organization)는
액션플랜 2013–2020을 채택하여 금연, 알코올 섭취 감소, 신체활동 증가 및 건강 식이를 만성질환의 예방과 관리를 위한 중요 전략으로 강조하고 있으며4) 시뮬레이션 모델 연구에 따르면 신체활동을 활발 하게 하고, 담배를 피우지 않으며, 적당한 음주와 과일을 충분히 섭 취한다면 만성질환 사망률을 적어도 25%는 줄일 수 있는 것으로 추 정되고 있다.5)
Big 4 중에서도 식이는 문화, 산업, 사회경제 및 심리 요소들이 관 련된 가장 복잡한 건강행동이지만 평가의 측면에서 자료수집 및 타 당성에 관한 논쟁거리가 많았던 부분이었으나, 오랜 검증을 거치면 서 지속적인 개선이 이루어지고 있다. 또한 최근의 식이-질병 관련
Original Article
40세 이상 성인에서 식이패턴과 대사증후군의 관련성
강동우, 김성희*, 조윤정, 김은미
대구가톨릭대학교병원 가정의학과
Dietary Patterns Associated with the Metabolic Syndrome in Adults over 40 Years
Dong-Woo Kang, Sung-Hee Kim*, Yoon Jeong Cho, Eun-Mi Kim
Department of Family Medicine, Daegu Catholic University Medical Center, Daegu, Korea
Background: Changing health behaviors is the most effective intervention to prevent and manage chronic diseases. Of the health behaviors, which include diet, physical activity, and smoking, diet are the most influential factors over the entire life. In this study, we investigated the association between diet and chronic diseases as well as the association between diet and metabolic syndrome.
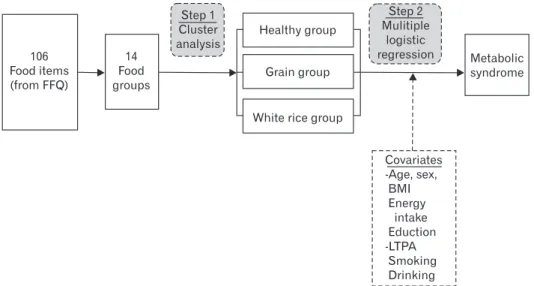
Methods: Using city-based cohort data for the years 2004–2008, we collected information about health behaviors using a structured questionnaire- based interview and performed anthropometric measurements and blood tests. We collected data on food consumption using a quantitative food frequency questionnaire. Subjects were divided into three groups based on dietary pattern (Healthy, Grain, and White rice), after K-means clustering analysis, and metabolic syndrome was defined according to the National Cholesterol Education Program-Adult Treatment Panel III (NCEP-ATPIII, 2006). Multivariate logistic regression analysis was performed to examine the relationship between metabolic syndrome and dietary patterns.
Results: The Healthy, Grain, and White rice dietary pattern groups represented 6.5%, 49.1%, and 44.5% of the subjects, respectively. Adults in urban areas generally had Grain or White rice dietary patterns. The Healthy pattern consisted of plenty of fruits, vegetables, legumes, and fish. With metabolic syndrome as the outcome and the Healthy pattern as the reference group, the odds ratios for Grain and White rice patterns were 1.42 (95% confidence interval [CI], 1.21–1.67) and 1.47 (95% CI, 1.25–1.73), respectively.
Conclusion: A dietary pattern consisting of greater intake of fruits, vegetables, legumes, and fish reduces the risk of metabolic syndrome.
Keywords: Dietary Pattern; Health Behavior; Metabolic Syndrome
http://dx.doi.org/10.21215/kjfp.2016.6.4.227 eISSN 2233-9116Korean J Fam Pract. 2016;6(4):227-234
KJFP
Korean Journal of Family PracticeReceived January 27, 2016 Revised April 22, 2016 Accepted May 5, 2016 Corresponding author Sung-Hee Kim
Tel: +82-53-650-4247, Fax: +82-53-650-4242 E-mail: [email protected]
Copyright © 2016 The Korean Academy of Family Medicine
This is an open-access article distributed under the terms of the Creative Commons At- tribution Non-Commercial License (http://creativecommons.org/licenses/by-nc/4.0) which permits unrestricted noncommercial use, distribution, and reproduction in any medium, provided the original work is properly cited.
Dong-Woo Kang, et al. Dietary Patterns and Metabolic Syndrome
Korean Journal of Family Practice
KJFP
연구 경향은 개별 영양소 중심에서 식품군 섭취의 유사성에 근거한 식이패턴 중심으로 이동하고 있는데6) 식이패턴 연구는 질병 관련성 에 관한 예측력이 높고, 영양소들의 복합적 관련성 파악이 용이하 며, 실제적인 식이 섭취를 반영하기 때문에 구체적인 연구와 가이드 라인 개발에 유용하다. 식이패턴의 정의 및 분류를 위한 다변량 분 석법으로는 요인분석과 군집분석이 주로 사용되고 있다.7)
많은 연구에서 식이는 비만, 대사증후군(metabolic syndrome, MetS), 당뇨, 심혈관질환, 악성질환 등의 예방 가능한 만성질환의 중 요 위험인자로 보고되고 있으며 MetS는 복부비만, 지질이상, 고혈압, 인슐린 저항성이 포함된 당뇨 및 심혈관질환 위험인자들의 집합체 로서 이들 질병의 선행 단계라고 할 수 있다.8) 세계적으로 MetS는 급 격한 증가 추세로서9) 한국에서도 1998년 24.9%에서 2007년 31.3%로 증가를 보인다.10) 이는 에너지 섭취는 증가하지만 신체활동량이 감 소되는 건강행동의 변화에 의한 것으로 추정하고 있다.
국내의 식이 관련 연구들도 이미 개별 영양소에서 식이패턴으로 변화하고 있으나 질병 관련 분야에서는 아직 제한적이다.11-13) 따라서 본 연구는 한국인 유전체역학조사사업의 도시기반 코호트 자료를 이 용하여 Big 4 중에서 식이와 MetS와의 관련성을 알아보고자 하였으며, 이에 더하여 식이와 나머지 건강행동 사이의 관련성을 분석하였다.
방 법
1. 연구대상
한국인 유전체역학조사사업의 여러 세부 코호트 중에서 도시기 반 코호트(2004–2008년 1–4차연도) 자료를 이용하였다. 전국 7개 대 학병원 및 종합병원(서울, 인천, 대구, 울산, 부산, 마산, 춘천)에서 연 구에 동의한 40세 이상 70세 미만의 성인 41,728명 중에서 먼저 MetS 자료가 결측되거나 심혈관질환의 과거력이 있는 2,447명(MetS 결측 1,510명, 뇌졸중 191명, 심근경색증 561명, 당뇨병 185명)을 제외하고 이후, 식이자료에 결측치가 있는 9,263명을 제외한 30,018명(남자 52.7%, 15,810명; 여자 47.3%, 14,208명)을 연구대상으로 하였다(대구 가톨릭대학교병원 IRB 승인 번호 06-52, 07-28, 08-726).
2. 식이 및 건강행동
구조화된 설문지를 이용한 개별 면담 조사를 시행하여 건강행동 에 관한 자료를 수집하였다.
1) 식이 자료
신뢰도와 타당도가 확인된 106개의 식품항목으로 구성된 정량적 식품 빈도 조사지(quantitative food frequency questionnaire, FFQ)를14)
이용하였다. FFQ는 지난 1년간의 평균 식품섭취를 측정하기 위하여 설계되었으며, 1개월 평균 표준화된 음식량을 섭취 빈도에 따라, 전 혀 안 먹음(0)에서 매일 3회 이상(9) 범위에서 측정하였다. 106개 식품 항목의 1일 섭취량(g/d)은 Computer Aided Nutritional Analysis Pro- gram (CAN-PRO 4.0; The Korean Nutrition Society, Seoul, Korea)을 이 용하여 구하였고, 이후 영양적 유사성이 있는 식품항목끼리 통합하 여 14개의 식품군으로는 흰쌀밥(white rice), 기타 잡곡밥(other grain), 국수/만두(noodle/dumpling), 떡(rice cake), 빵(bread), 스낵(snack), 콩 (legume), 난류(egg), 채소류/김치와 비김치(vegetable, non-kimchi/
kimchi), 붉은 육류(red meat), 생선(fish), 우유 및 유제품(milk & dairy product), 과일(fruit)로 분류하였다.
이후 식품군 섭취 특성에 따라서 야채, 과일, 콩류, 생선 섭취를 많 이 하는 Healthy 식이패턴, 잡곡밥 섭취가 많은 Grain 식이패턴, 쌀밥 섭취가 두드러진 White rice 식이패턴의 세 집단으로 구분하였다.
2) 기타 건강행동 및 교육수준
기타 건강행동에는 흡연, 음주, 신체활동을 포함하여 정량적 추 정과 유해 건강행동 여부에 대한 정성적 추정을 같이 하였다. 흡연에 관해서는 1일 평균 흡연 양에 흡연기간을 곱하여 생애 총 흡연량 (pack year, PYR)을 추정하였고 이를 기반으로 생애 총 PYR이 5 PYR (100개비 PYR) 이상이면 흡연군으로, 5 PYR 미만인 경우 비흡연군으 로 구분하였다.
음주는 지난 1년간 월 음주 횟수, 1회 음주 시 평균 음주량(잔)을 구하여 1일 평균 알코올 섭취량을 구하였고, 1일 알코올 섭취량이 10 g/d 미만을 적정음주군, 이를 초과하는 경우를 음주군로 구분하였다.
여가시간 신체활동량(leisure-time physical activity, LTPA)은 Min- nesota Leisure-Time Physical Activity Questionnaire (MLTPAQ)를 바탕 으로 한국어판 MLTPAQ15)를 이용하였고, 신체활동마다 고유한 에 너지소비량( metabolic equivalent of task)값을 이용하여 1일 소비 칼로 리(kcal/d)를 계산하였다. 규칙적 운동 여부는 약간 땀이 날 정도의 운동을 주 3회 이상 하는 경우를 기준으로 규칙적 운동군으로 하였 고 그렇지 않은 경우를 비규칙적 운동군으로 구분하였다.
교육수준은 무학력, 초등학교 중퇴, 초등학교 졸업 또는 중학교 중퇴, 중학교 졸업 또는 고등학교 중퇴, 고등학교 졸업, 전문대학교 졸업, 대학교 중퇴, 대학교 졸업, 대학원 이상의 9단계로 구분하였다.
3) 신체계측 및 혈액검사
신체계측은 직립자세에서 신장, 체중을 측정하여 체질량지수 (body mass index, BMI; kg/m2)를 구하였다. 허리둘레는 직립 자세에 서 늑골 최하단부와 장골능 최상단부의 중간지점에서 측정하였다.
강동우 외. 식이패턴에 따른 건강행동 특성 및 대사성 증후군 Korean Journal of Family Practice
KJFP
혈압은 최소 5분 이상 휴식 후, 자동혈압계를 이용하여 수축기, 이완 기 혈압을 측정하였으며, 2회 이상 반복측정 후 평균값을 구하였다.
혈액검사는 8시간 이상의 공복 후 채혈을 실시하였으며, 공복 혈당, 중성지방, high density lipoprotein (HDL) 콜레스테롤을 측정하였다.
3. 대사증후군의 정의
MetS는 modified National Cholesterol Education Program Adult Treatment Panel-lll 2007 (NCEP ATP-lll) 기준에 따라 정의하였고16) 다 음 다섯 가지 항목 중 세 가지 이상을 만족하는 경우로 하였다.
1) 복부 비만(허리둘레: 남성 ≥90 cm, 여성 ≥80 cm) 2) 중성지방 ≥150 mg/dL 또는 약물치료
3) 고밀도지단백 콜레스테롤: 남성 <40 mg/dL, 여성 <50 mg/dL 또 는 약물치료
4) 고혈압 ≥130/85 mmHg 또는 약물치료 5) 공복혈당 ≥110 mg/dL 또는 약물치료
4. 통계분석
집단의 수(K)를 먼저 지정한 후, 섭취식품들 사이의 유사성을 기 준으로 개별 대상자를 K개의 군집으로 묶어 주는 K-means 군집분 석(반복시행 20회)을 시행하였는데, 본 연구에서 K를 3으로 지정하 여 세 집단의 식이패턴으로 분류하였다.17)
식이패턴에 따른 조사대상자들의 일반적 특징은 범주형 변수에 대해서는 chi-square test를 시행하였고 연속형 변수는 analysis of vari- ance (ANOVA) 분석을 시행하였다. 식이패턴과 MetS의 관련성은 다 변량 로지스틱 회귀분석을 시행하였으며, 연령, 성별, 교육수준, 칼로 리 섭취(kcal/d), 생애 총 PYR, 1일 음주량(g/d), LTPA (kcal/d)를 공변 량으로 보정하였다. 통계분석은 IBM SPSS Statistics ver. 20.0 (IBM Co.,
Armonk, NY, USA)을 이용하였고 유의성 검정은 P<0.05로 하였다.
결 과
1. 조사대상자들의 식이패턴
조사대상자들을 식이패턴의 주요 특징에 따라서 Healthy, Grain, White rice로 구분하였고, 각각의 백분율은 6.5% (1,940명), 49.1%
(14,734명), 44.5% (13,344명)였다. Healthy는 지중해식이(Mediterranean diet) 및 미국의 건강식이(healthy diet)에서 권고하는 과일, 야채, 콩류, 생선 등의 섭취가 많았는데 특히 과일 섭취가 월등하였고, 그 외에 도 항산화, 항염증 관련 미세영양소 섭취가 많았다. Grain, White rice 둘 다 Healthy 식이패턴에 비해서 전반적 식이섭취가 저조한 편이었 으며, 특히 White rice에서 붉은 육류를 제외한 대부분의 섭취량이 적었다(Figure 1, Table 1).
2. 식이패턴에 따른 일반적 특성, 기타 건강행동 특성 및 대 사증후군 유병률
조사대상자들의 성별 분포는 남자 52.7% (15,810명), 여자 47.3%
(14,208명)였고 연령별 분포는 40대 41.8% (12,549명), 50대 39.2% (11,760 명), 60대 19.0% (5,709명)였다. 일반적 특성은 Healthy의 경우 상대적 으로 나이가 적고, 여성이 많으며, 교육수준이 높고, BMI가 양호하 였다. Grain과 White rice 비교에서는 Grain이 나이가 많고, 여성이 많 고, 교육수준은 낮은 편이었다. 건강행동은 Healthy에서 규칙적 운 동을 더 많이 하고, 흡연 및 음주가 양호하였다. Grain과 White rice의 비교에서는 White rice에서 흡연, 음주, 신체활동 등의 건강행동이 보 다 저조하였다.
전체의 MetS 유병률은 17.6%였으며 식이패턴 별로 Healthy, Grain,
106 Food items (from FFQ)
14 Food groups
Step 1 Cluster analysis
Step 2 Mulitiple
logistic regression Healthy group
Grain group
White rice group
Metabolic syndrome
Covariates -Age, sex,
BMI Energy
intake Eduction -LTPA
Smoking Drinking
Figure 1. Visual depiction of cluster analysis for dietary patterns and multi- variate logistic regression analysis for the relationship between diet pattern and metabolic syndrome. FFQ, food frequency questionnaire; BMI, body mass index; LTPA, leisure-time physical activity.
Dong-Woo Kang, et al. Dietary Patterns and Metabolic Syndrome
Korean Journal of Family Practice
KJFP
White rice에서 각각 11.6%, 17.8%, 18.3%로 Healthy에서 가장 낮았고 White rice에서 가장 높았다. 또한 허리둘레, 혈압, 중성지방, HDL, 공 복혈당과 같은 MetS 요소에서도 Healthy, Grain, white rice 순으로 위 험도가 증가하였다(Table 2).
3. 식이패턴에 따른 신체활동부족, 흡연, 음주과다 위험도 비교
식이와 나머지 건강행동들 사이의 관련성을 알아보기 위하여, 식 이패턴에 따른 위험 건강행동 교차비를 구하였다. 위험 건강행동에 대한 조작적 정의는 비규칙적 운동, 흡연자, 1일 알코올 섭취량이 >10 g/d인 경우로 정하였다.식이패턴에 따른 비규칙적 운동 교차비는 Healthy의 1.0과 비교하 여, Grain, White rice의 교차비는 공변량을 보정하지 않은 Model 1에 서는 1.34 (95% confidence interval [CI] 1,23–1.50), 1.91 (95% CI 1.73–
2.10)이었고, 연령, 성별, 교육수준, BMI를 보정한 Model 2에서는 1.35 (95% CI 1.23–1.50), 1.91 (95% CI 1.73–2.11), 흡연, 음주를 추가로 보정 한 Model 3에서는 1.37 (95% CI 1.24–1.53), 1.94 (95% CI 1.75–2.15)였다.
식이패턴에 따른 흡연 교차비는 Healthy의 1.0과 비교하여 Grain, White rice의 교차비는 Model 1에서 각각 2.38 (95% CI 2.05–2.76), 3.52 (95% CI 3.04–4.09), Model 2에서는 1.20 (95% CI 0.98–1.46), 1.30 (95% CI 1.08–1.60), Model 3에서는 1.12 (95% CI 0.91–1.37), 1.17 (95% CI 0.95–
1.44)이었다. 식이패턴에 따른 음주과다 교차비는 ‘Healthy’ 교차비 1.0과 비교하여 Grain, White rice는 Model 1에서 각각 2.43 (95% CI 2.06–2.86), 3.52 (95% CI 2.98–4.14), Model 2에서는 1.51 (95% CI 1.26–
1.82), 1.64 (95% CI 1.36–1.98), Model 3에서는 1.56 (95% CI 1,29–1.89), 1.70 (95% CI 1.41–2.07)이었다(Table 3).
4. 식이패턴에 따른 대사증후군 위험도 비교
식이패턴과 MetS의 관련성을 알아보기 위하여 Healthy의 MetS 교 차비를 1.0으로 두었을 때, 공변량을 보정하지 않은 상태인 Model 1 에서 Grain, White rice의 교차비는 각각 1.65 (95% CI 1.43–1.91), 1.71 (95% CI 1.48–1.98)이었고, 연령, 성별, 1일 에너지 섭취량, 교육수준을 공변량으로 보정한 후인 Model 2에서는 1.48 (95% CI 1.27–1.73), 1.60 Table 1. Mean foods and nutrient intakes in the three dietary patterns
Characteristic Healthy (n=1,940) Grain (n=14,734) White rice (n=13,344) P-value
Food group (g/d)
White rice 48.0±156.7 0.0 289.5±324.7 <0.001
Other grain 305.2±51.6 605.7±153.3 13.3±272.9 <0.001
Noodle/dumpling 59.8±139.4 49.1±86.8 58.2±92.8 <0.001
Rice cake 14.4±34.8 8.6±21.8 7.9±19.5 <0.001
Bread 17.8±40.9 9.4±23.1 10.8±25.2 <0.001
Snack 57.7±84.4 28.6±34.4 28.1±36.4 <0.001
Legume 81.56±121.8 40.2±51.4 36.6±48.6 <0.001
Egg 5.8±6.7 4.2±4.8 4.0±4.7 <0.001
Vegetable (non-kimchi) 249.4±181.6 115.7±124.1 106.2±121.2 <0.001
Vegetable (kimchi) 203.8±269.5 114.8±105.2 136.1±105.1 <0.001
Red meat 46.5±108.8 37.8±46.9 41.4±56.7 <0.001
Fish 64.5±97.7 30.7±32.2 28.7±33.1 <0.001
Milk & dairy product 241.2±277.2 113.7±134.7 101.9±132.1 <0.001
Fruit 834.5±450.1 164.9±128.5 144.9±125.5 <0.001
Energy intake (kcal/d) 2,258.5±719.7 1,784.8±49±9.6 1,639.7±532.1 <0.001
Macronutrient (g/d)
Protein 88.3±63.1 59.3±25.0 54.5±26.9 <0.001
Lipid 42.9±38.7 26.0±17.2 26.6±19.3 <0.001
Carbonydrate 421.7±170.2 324.0±87.7 286.0±98.4 <0.001
Micronutrient (mg/d)
Potassium 4,561.9±2,380.3 2,322.0±1,034.9 2,083.6±1,034,2 <0.001
Calcium 871.9±603.9 442.6±259.2 405.4±255.3 <0.001
Vitamin C 307.9±162.1 107.6±62.6 98.8±61.5 <0.001
Vitamin B1 1.7±0.9 1.0±0.4 0.9±0.5 <0.001
Vitamin B2 1.7±1.1 0.9±0.5 0.9±0.5 <0.001
Folic acid (μg/d) 432.2±264.7 216.4±117.3 195.0±115.5 <0.001
β-carotene (μg/d) 4,861.0±3,845.9 2,309.2±1,805.4 2,149.4±1,793.0 <0.001
Zinc 11.7±10.2 7.9±3.7 7.1±4.0 <0.001
Values are presented as mean±standard deviation. Healthy: helthy dietary pattern, have eaten lots of fruits, vegetables, legumes, and fishes, relatively; Grain: grain di- etary pattern, have eaten lots of grain, relatively; White rice: white rice dietary diet pattern, have eaten white rice, relatively.
강동우 외. 식이패턴에 따른 건강행동 특성 및 대사성 증후군 Korean Journal of Family Practice
KJFP
(95% CI 1.36–1.87), 흡연, 음주, 신체활동량을 추가로 보정한 Model 3 에서는 1.42 (95% CI 1.21–1.67), 1.47 (95% CI 1.25–1.73)이었다. Healthy, Grain, White rice의 순으로 MetS의 위험이 증가하였다.
식사패턴 이외의 신체활동, 흡연, 음주에 대한 Mets 위험도를 분석 하였다. 규칙적 운동의 교차비를 1.0으로 두었을 때, 비규칙적 운동 군의 교차비는 Model 1 (crude), Model 2 (연령, 성별, BMI, 교육수준을 보정), Model 3 (음주, 흡연량을 추가보정)에서 각각 1.20 (95% CI 1.14–
1.27), 1.27 (95% CI 1.19–1.36), 1.24 (95% CI 1.17–1.32)로 신체활동은 MetS 위험을 감소시켰다(Table 4).
고 찰
본 연구는 전국 7개 도시지역에 거주하는 40–70세 사이의 30,018 명을 연구대상으로 식이패턴을 Healthy, Grain, White rice의 세 군으 로 분류하여, 식이패턴과 MetS와의 관련성을 분석하고자 하였다. 연 구결과 Healthy에서 Grain, White rice에 비하여 유의한 MetS 위험도 감소가 있었다.
보다 구체적으로 본 연구는 세 가지 정도의 주안점을 두었다. 우선 식이패턴을 분류하여 도시지역 40세 이상 성인의 식이특성을 알아 보고자 하였고, 두 번째로 식이패턴과 나머지 건강행동들과의 관련 성을 알아보고, 마지막으로는 식이패턴과 MetS와의 관련성을 분석 Table 2. General characteristics and health behaviors of participants in the three dietary patterns
Variable Healthy (n=1,940) Grain (n=14,734) White rice (n=13,344) P-value
Age (y)
40–49 949 (48.9) 5,555 (37.7) 6,045 (45.3) <0.001
50–59 745 (38.4) 6,011 (40.8) 5,004 (37.5)
60–70 246 (12.7) 3,168 (21.5) 2,295 (17.2)
Sex
Men 248 (12.8) 10,491 (71.2) 5,071 (38.0) <0.001
Women 1,692 (87.2) 4,243 (28.8) 8,273 (62.0)
Education (y)
<12 446 (23.0) 5,083 (34.5) 4,377 (32.8) <0.001
12–14 964 (49.7) 6,276 (42.6) 5,591 (41.9)
≥15 530 (27.3) 3,375 (22.9) 3,376 (25.3)
Height (cm) 159.0±6.4 159.5±7.7 161.1±8.1 <0.001
Weight (kg) 59.8±8.4 61.1±9.6 62.1±9.9 <0.001
Body mass index (kg/m2) 23.6±2.7 23.9±2.8 23.9±2.8 <0.001
Leisure-time physical activity (kcal/d) 229.3±256.7 193.9±223.1 150.8±199.7 <0.001
Regular exercise
No 710 (36.6) 6,468 (43.9) 6,992 (52.4) <0.001
Yes 1,230 (63.4) 8,266 (56.1) 6,352 (47.6)
Whole life smoking (pack year) 1.6±6.0 4.4±10.9 6.1±12.8 <0.001
Smoking status
Current 81 (4.2) 1,385 (9.4) 1,948 (14.6) <0.001
Past 122 (6.3) 184 (1.2) 1961 (14.7)
None 1,737 (89.5) 13,165 (89.4) 9,435 (70.7)
Daily alcohol intake (g/d) 3.6±13.4 8.5±22.1 12.1±27.8 <0.001
Drinking status (g/d)
>20 101 (5.2) 1,798 (12.2) 2,255 (16.9) <0.001
10–20 66 (3.4) 943 (6.4) 1,054 (7.9)
<10 1,773 (91.4) 11,993 (81.4) 10,035 (75.2)
Prevalence of metabolic syndrome 225 (11.6) 2,622 (17.8) 2,442 (18.3) <0.001
Waist circumference (cm) 78.7±8.1 80.7±8.4 81.2±8.6 <0.001
Blood pressure (mmHg) 118.8±15.5 122.3±15.9 121.9±15.9 <0.001
Diastolic (mmHg) 73.9±10.1 75.8±10.4 76.0±10.5 <0.001
Triglyceride (mg/dL) 107.9±73.7 119.9±85.8 124.3±89.4 <0.001
High density lipoprotein (mg/dL) 56.7±13.2 54.0±12.4 53.9±12.7 <0.001
Fasting blood sugar (mg/dL) 90.4±12.0 91.7±17.4 91.8±16.6 <0.001
Values are presented as number (%) or mean±standard deviation. Healthy: helthy dietary pattern, have eaten lots of fruits, vegetables, legumes, and fishes, relatively;
Grain: grain dietary pattern, have eaten lots of grain, relatively; White rice: white rice dietary diet pattern, have eaten white rice, relatively.
Dong-Woo Kang, et al. Dietary Patterns and Metabolic Syndrome
Korean Journal of Family Practice
KJFP
하는 것이었다.
본 연구에서는 군집분석을 시행하여 식이패턴을 Healthy, Grain, White rice로 구분하였고, Healthy, Grain, White rice의 백분율은 각각 6.5%, 49.1%, 44.5%였다. 따라서 도시지역 성인의 일반적인 식이패턴 은 Grain과 White rice로 볼 수 있으며, MetS 위험을 낮추는 Healthy는 소수에 국한되었다.
Big 4에 포함되는 식이, 신체활동, 흡연, 음주 등의 건강행동은 상 호관련성이 있다. 국내외 연구들에서도 식이패턴이 나쁠수록 흡연 을 많이 하고, 규칙적 운동을 하지 않으며 음주량이 많았다.18-20) 본 연구에서도 식이패턴이 나쁠수록 흡연, 음주, 신체활동 등의 건강행 동이 악화되고, 식이패턴이 양호하면 다른 건강행동들도 개선되는 결과를 나타내는 건강행동의 동조화(synchronization) 경향을 보이 었으며, 이는 심리적, 사회경제적, 환경 요인 등이 건강행동 결정에 영
향을 미치기 때문으로21) 추정된다. Poverty-place model은 빈곤과 거 주 지역을 결합하여 건강행동의 형성 과정을 설명하는데, 이에 따르 면 낮은 소득에 의한 구매력 부족과 좋은 식료품가게 및 생활 체육 시설이 충분치 않은 사회 환경 요인이 건강행동 개선을 저해하는 접 근성의 제한요인으로 작동하며 이를 neighborhood effect라고 한다.22) 미국의 2015 Dietary Guideline Advisory Committee (DGAC)에서는 다양한 색상의 채소, 과일, 콩류, 생선 및 통곡물 등을 충분히 섭취 하는 것이 만성질환의 예방과 관리를 위한 효과적인 방법으로 권고 하고 있다.23) 2015년 US News and World Report에서 건강을 위한 최 상위 식이패턴으로 평가된 Diet Approach for Stop Hypertension과 지 중해식이패턴에서도 과일, 채소, 콩류, 생선 등의 식품군이 공통적 으로 권고되고 있다.24) 또한 미국 국립암센터의 식이패턴 프로젝트 (Dietary Patterns Methods Project)에서도 조기사망을 낮추기 위한 식 이지표를 개발하였는데, 이 지표의 공통적인 식이요인이 통곡물, 야 채, 과일, 식물성 단백질이었다.25) 이로서 식이와 만성질환의 관련성 이 이미 확고한 과학적 통념으로 자리 잡고 있음을 알 수 있으며, 다 수의 대규모 코호트 연구와 무작위할당 임상실험에서도 식이패턴 이 암,26) 당뇨병 및 심혈관 질환27)과 같은 만성질환 발생의 원인 중 하 나임이 입증되었다. 미국과 유럽의 전향적 연구에서 채소, 과일, 생선 및 식물성 단백질을 많이 섭취하는 경우 암, 심혈관질환, 당뇨병 등 의 발병률이 공통적으로 감소하였고,28) 전체 사망률도 15%–30% 감 소하였다.29) 국내의 단면연구들에서도 과일, 야채, 생선, 콩류를 섭취 하는 식이패턴에서 MetS 위험이 감소하였으며,11) 고령자인 경우 인지 능력이 양호하고,12) 당뇨병 위험이 감소하였다.13)
식이패턴 분류는 군집분석을 이용하였는데, 군집분석은 자체에 Table 3. Odds ratio (95% confidence interval) for health behaviors (regular exercise, smoking, and drinking) according to dietary pattern
Dietary pattern Model 1 Model 2 Model 3
Insufficient physical activity
White rice 1.91 (1.73–2.10) 1.91 (1.73–2.11) 1.94 (1.75–2.15)
Grain 1.34 (1.23–1.50) 1.35 (1.23–1.50) 1.37 (1.24–1.52)
Healthy 1 1 1
P-trend <0.001 <0.001 <0.001
Smoking
White rice 3.52 (3.04–4.09) 1.30 (1.08–1.60) 1.17 (0.95–1.44)
Grain 2.38 (2.05–2.76) 1.20 (0.98–1.46) 1.12 (0.91–1.37)
Healthy 1 1 1
P-trend <0.001 0.008 0.226
Excessive drinking
White rice 3.52 (2.98–4.14) 1.64 (1.36–1.98) 1.70 (1.41–2.07)
Grain 2.43 (2.06–2.86) 1.51 (1.26–1.82) 1.56 (1.29–1.89)
Healthy 1 1 1
P-trend <0.001 <0.001 <0.001
Values are presented as odds ratio (95% confidence interval). Model 1: crude; Model 2: adjusted by age, sex, education, energy intake; Model 3: adjusted by age, sex, education, energy intake, leisure time physical activity, pack year, daily alcohol intake. Healthy: healthy dietary pattern, have eaten lots of fruits, vegetables, legumes, and fishes, relatively; Grain: grain dietary pattern, have eaten lots of grain, relatively; White rice: white rice dietary diet pattern, have eaten white rice, relatively.
Table 4, Odds ratio (95% confidence interval) for metabolic syndrome according to health behaviors (dietary pattern, regular exercise, smok- ing, and drinking)
Variable Model 1 Model 2 Model 3
Diet pattern
White rice 1.71 (1.48–1.98) 1.60 (1.36–1.87) 1.47 (1.25–1.73) Grain 1.65 (1.43–1.91) 1.48 (1.27–1.73) 1.42 (1.21–1.67)
Healthy 1 1 1
P-trend <0.001 <0.001 <0.001
Values are presented as odds ratio (95% confidence interval). Model 1: crude;
Model 2: adjusted by age, sex, education, energy intake; Model 3: adjusted by age, sex, education, energy intake, leisure time physical activity, pack year, daily alcohol intake. Healthy: healthy dietary pattern, have eaten lots of fruits, vegeta- bles, legumes, and fishes, relatively; Grain: grain dietary pattern, have eaten lots of grain, relatively; White rice: white rice dietary diet pattern, have eaten white rice, relatively.
강동우 외. 식이패턴에 따른 건강행동 특성 및 대사성 증후군 Korean Journal of Family Practice
KJFP
내재하는 주관성 때문에 분류의 객관성이 부족하다는 점이 지적되 고 있으며, 이를 보완하기 위하여 다양한 K값을 적용하여 가장 적절 한 K를 구하는 방법이 추천되고 있다.14) 군집분석은 주관적이라는 제한점이 있지만 강점은 실제 자료에 근거한 분류라는 점으로, 본 연 구에서는 K는 3에서 가장 적합하였다.
본 연구 결과에서 Healthy의 경우 유익한 식이를 충분하게 하였으 나, 붉은 육류, 나트륨(김치), 탄수화물 및 지방 등의 유해 식이섭취도 많았다. 2015년 DGAC에서는 에너지 섭취의 제한범위 내에서 건강 에 유익한 식품군을 충분히 먹을 것을 권고하였는데, Healthy의 에 너지 섭취는 2010년 한국인 영양섭취 권장량을 상회하는 수준이었 다. 따라서 에너지 섭취 과다와 FFQ에 내재하는 비방향성 측정오차 를 보정하기 위하여30) 식이패턴과 MetS의 관련성 분석에서는 BMI 대신 1일 에너지 섭취량을 공변량으로 대체하였다.
본 연구의 제한점은 우선, 식이패턴 분류의 근거가 취약하다는 점 으로, 식이평가를 위해서는 FFQ와 24시간 회상법을 같이 활용하는 것이 필요한데 FFQ 단독으로는 평가가 충분하지 않다는 점과 군집 분석 자체의 주관성 때문에 식이패턴 분류의 건전성이 취약해지는 측면이 있다. 두 번째로는 건강검진 방문자를 대상으로 코호트 등록 이 진행되어서, 질병으로 인한 방문은 아니지만 병원이라는 선택편 견이 작용할 수 있고, 마지막으로는 단면연구여서 식이패턴과 MetS 사이의 인과관계 설정이 어렵고 혼란요인의 통제가 충분하지 않은 점을 고려해볼 수 있다. 그러나 위의 제한점에도 불구하고 본 연구의 의의는 조사대상자가 대규모이고, 식이 이외의 다른 건강행동의 영 향을 충분히 보정한 상태에서, 심혈관질환 위험을 낮추는 식이패턴 의 대략적인 모습을 알 수 있었다는 점이다. 향후 보다 견고한 건강 식이패턴을 규명하기 위해서는 다양한 전향적 연구가 필요하다.
요 약
연구배경:
건강행동 개선은 만성질환의 예방과 관리에 가장 효과적 인 개입으로 알려져 있다. 식이, 신체활동, 흡연, 음주 등의 건강행동 들 중에서도 식이는 모두가, 평생 동안, 중단 없이 반복하는 가장 중 요한 건강행동이다. 따라서 본 연구에서는 식이와 만성질환의 관련 성을 알아보고자 하였으며, 만성질환을 대신하여 대사증후군과의 관련성을 분석하였다.방법:
도시기반 코호트(1–4차연도: 2004–2008년) 자료를 이용하여, 구조화된 설문지를 이용한 면담조사를 통하여 건강행동 자료를 수 집하였고, 신체계측과 혈액검사를 시행하였다. 식품 빈도 조사지 (quantitative food frequency questionnaire)를 이용하여 식품섭취에 대 한 자료를 수집하였고, 이후 K-평균 군집분석을 시행하여 세 가지 식이패턴(Healthy, Grain, White rice)으로 분류하였다. 대사증후군 Na- tional Cholesterol Education Program—Adult Treatment Panel III 2006 (NCEP—ATPIII) 정의를 이용하였다. 다변량 로지스틱 회귀분석을 시행하여 식이패턴과 대사증후군의 관련성을 분석하였다.
결과:
Healthy, Grain, White rice의 백분율은 6.5%, 49.1%, 44.5%로 도 시지역 성인의 일반적 식이패턴은 Grain, White rice였다. Healthy의 경우 과일, 야채, 콩류 및 생선이 섭취가 많았으며 대사증후군의 교 차비를 1.0으로 하였을 때, Grain, White rice의 교차비는 각각 1.42 (95% confidence interval [CI] 1.21–1.67), 1.47 (95% CI 1.25–1.73)이었다.결론:
과일, 야채, 콩류 및 생선 섭취가 많은 식이패턴에서 대사증후 군의 위험이 감소하였다.중심단어:
식이패턴; 건강행동; 대사증후군REFERENCES
1. Ali MK, Jaacks LM, Kowalski AJ, Siegel KR, Ezzati M. Noncommunicable diseases: three decades of global data show a mixture of increases and de- creases in mortality rates. Health Aff (Millwood) 2015; 34: 1444-55.
2. Korean Statistical Information Service. Causes of death [Internet]. Daejeon:
Korean Statistical Information Service; 2013 [cited 2014 Oct 2]. Available from: http://www.kosis.kr.
3. Woolf SH, Jonas S, Kaplan-liss E. Health promotion and disease prevention in clinical practice. 2nd ed. Philadelphia: Lippincott Williams & Wilkins;
2008. p. 5-7.
4. World Health Organization. Draft action plan for the prevention and con- trol of noncommunicable diseases 2013-2020. WHO 66th Health Assembly.
Provisional agenda item 2013. Geneva: World Health Organization; 2013.
5. Cecchini M, Sassi F, Lauer JA, Lee YY, Guajardo-Barron V, Chisholm D.
Tackling of unhealthy diets, physical inactivity, and obesity: health effects and cost-effectiveness. Lancet 2010; 376: 1775-84.
6. Conry MC, Morgan K, Curry P, McGee H, Harrington J, Ward M, et al. The clustering of health behaviours in ireland and their relationship with mental health, self-rated health and quality of life. BMC Public Health 2011; 11: 692.
7. Hoffmann K, Schulze MB, Schienkiewitz A, Nöthlings U, Boeing H. Appli- cation of a new statistical method to derive patterns in nutritional epidemi- ology. Am J Epidemiol 2004; 159: 935-44.
8. Lakka HM, Laaksonen DE, Lakka TA, Niskanen LK, Kumpusalo E, Tu- omilehto J, et al. The metabolic syndrome and total cardiovascular disease mortality in middle-aged men. JAMA 2002; 288: 2709-16.
9. Ford ES, Giles WH, Dietz WH. Prevalence of the metabolic syndrome among US adults: findings from the third National Health and Nutrition Examination Survey. JAMA 2002; 287: 356-9.
10. Lim S, Shin H, Song JH, Kwak SH, Kang SM, Won Yoon J, et al. Increasing prevalence of metabolic syndrome in Korea: the Korean National Health and Nutrition Examination Survey for 1998-2007. Diabetes Care 2011; 34:
1323-8.
11. Song Y, Joung H. A traditional Korean dietary pattern and metabolic syn-
Dong-Woo Kang, et al. Dietary Patterns and Metabolic Syndrome
Korean Journal of Family Practice
KJFP
drome abnormalities. Nutr Metab Cardiovasc Dis 2012; 22: 456-62.
12. Kim J, Yu A, Choi BY, Nam JH, Kim MK, Oh DH, et al. Dietary patterns de- rived by cluster analysis are associated with cognitive function among Kore- an older adults. Nutrients 2015; 7: 4154-69.
13. Paek KW, Chun KH, Lee SJ. A factor of fasting blood glucose and dietary patterns in Korean adults using data from the 2007, 2008 and 2009 Korea National Health and Nutrition Examination Survey. J Prev Med Public Health 2011; 44: 93-100.
14. Ahn Y, Kwon E, Shim JE, Park MK, Joo Y, Kimm K, et al. Validation and re- producibility of food frequency questionnaire for Korean genome epidemi- ologic study. Eur J Clin Nutr 2007; 61: 1435-41.
15. Kim DH. Effect of Job and leisure time physical activity on the risk of colorectal cancer: a case-control study [dissertation]. Seoul: Seoul National Univ.; 1997. Korean.
16. Alberti KG, Eckel RH, Grundy SM, Zimmet PZ, Cleeman JI, Donato KA, et al. Harmonizing the metabolic syndrome a joint interim statement of the international diabetes federation task force on epidemiology and preven- tion; national heart, lung, and blood institute; American Heart Association;
World Heart Federation; International Atherosclerosis Society; and Interna- tional Association for the Study of Obesity. Circulation 2009; 120: 1640-5.
17. Linoff GS, Berry Michael JA. Data mining techniques for marketing, sales, and customer relationship management. 2nd ed. Seoul: Hankyungsa; 2012.
p. 362-6.
18. Millen BE, Quatromoni PA, Copenhafer DL, Demissie S, O’Horo CE, D’Agostino RB. Validation of a dietary pattern approach for evaluating nu- tritional risk: the Framingham Nutrition Studies. J Am Diet Assoc 2001;
101: 187-94.
19. Suh SY, Lee JH, Park SS, Seo AR, Ahn HY, Bae WK, et al. Less healthy dietary pattern is associated with smoking in Korean men according to nationally representative data. J Korean Med Sci 2013; 28: 869-75.
20. Kim J, Yu A, Choi BY, Nam JH, Kim MK, Oh DH, et al. Dietary patterns de-
rived by cluster analysis are associated with cognitive function among Kore- an older adults. Nutrients 2015; 7: 4154-69.
21. Hu D, Taylor T, Blow J, Cooper TV. Multiple health behaviors: patterns and correlates of diet and exercise in a Hispanic college sample. Eat Behav 2011;
12: 296-301.
22. Gaskin DJ, Thorpe RJ Jr, McGinty EE, Bower K, Rohde C, Young JH, et al.
Disparities in diabetes: the nexus of race, poverty, and place. Am J Public Health 2014; 104: 2147-55.
23. McGuire S. Scientific report of the 2015 dietary guidelines advisory com- mittee. Washington, DC: US departments of agriculture and health and hu- man services, 2015. Adv Nutr 2016; 7: 202-4.
24. US News & World Report. Best Diets-Health [Internet]. Washington: US News & World Repor; 2015 [cited 2016 Apr 14]. Available from: http://
health.usnews.com/best-diet/.
25. Reedy J, Krebs-Smith SM, Miller PE, Liese AD, Kahle LL, Park Y, et al. Higher diet quality is associated with decreased risk of all-cause, cardiovascular dis- ease, and cancer mortality among older adults. J Nutr 2014; 144: 881-9.
26. Cottet V, Touvier M, Fournier A, Touillaud MS, Lafay L, Clavel-Chapelon F, et al. Postmenopausal breast cancer risk and dietary patterns in the E3N- EPIC prospective cohort study. Am J Epidemiol 2009; 170: 1257-67.
27. Brunner EJ, Mosdøl A, Witte DR, Martikainen P, Stafford M, Sipley MJ, et al.
Dietary patterns and 15-y risks of major coronary events, diabetes, and mortality. Am J Clin Nutr 2008; 87: 1414-21.
28. Imamura F, Lichtenstein AH, Dallal GE, Meigs JB, Jacques PF. Generalizabil- ity of dietary patterns associated with incidence of type 2 diabetes mellitus.
Am J Clin Nutr 2009; 90: 1075-83.
29. Kant AK. Dietary patterns: biomarkers and chronic disease risk. Appl Physi- ol Nutr Metab 2010; 35: 199-206.
30. Kipnis V, Subar AF, Midthune D, Freedman LS, Ballard-Barbash R, Troiano RP, et al. Structure of dietary measurement error: results of the OPEN bio- marker study. Am J Epidemiol 2003; 158: 14-21.