D I A B E T E S & M E T A B O L I S M J O U R N A L
This is an Open Access article distributed under the terms of the Creative Commons At- tribution Non-Commercial License (http://creativecommons.org/licenses/by-nc/3.0/) which permits unrestricted non-commercial use, distribution, and reproduction in any medium, provided the original work is properly cited.
Factors Associated with Health-Related Quality of Life among Saudi Patients with Type 2 Diabetes Mellitus:
A Cross-Sectional Survey
Ayman A. Al Hayek, Asirvatham A. Robert, Abdulghani Al Saeed, Aus A. Alzaid, Fahad S. Al Sabaan
Department of Endocrinology and Diabetes, Diabetes Treatment Center, Prince Sultan Military Medical City, Riyadh, Saudi Arabia
Background: Diabetes mellitus (DM) is associated with high mortality, morbidity, poor general health, and loss of health-related quality of life (HRQOL). The objective of the study was to assess the factors associated with HRQOL among patients with type 2 diabetes mellitus (T2DM).
Methods: This was a cross sectional study conducted among 283 T2DM patients during June 2011 and September 2012 at a ma- jor tertiary hospital in Riyadh, Saudi Arabia. The respondents were purposively and conveniently selected according to their availability during their routine visit to the outpatient clinics and they were interviewed using the Arabic version of the Short- Form 36-item survey (SF-36) to assess the HRQOL.
Results: The mean age of the participants was 56.4±13.2 years. Around 63% (178) were males and 37% (105) were females. Gly- cosylated hemoglobin level was found to be significantly higher among female and HRQOL was higher among male. Respon- dents who were more than 50 years old had poor HRQOL than less than 50 years age group. Poor economic status, reported dia- betic complications and longer duration of diabetes were significantly associated with poor HRQOL. The respondents treated with combination of therapies (oral medication plus insulin) indicated better HRQOL than patients with insulin therapy alone.
Multivariate analysis indicated that gender, economic status (except subscale energy), and complications of DM (except subscale energy) as independent risk factor for HRQOL.
Conclusion: Gender, economic status, and complication of DM were independent risk factors for majority of the subscales of HRQOL.
Keywords: Anxiety; Diabetes mellitus; Quality of life; Saudi Arabia
Corresponding author: Ayman A. Al Hayek
Department of Endocrinology and Diabetes, Diabetes Education Unit, Diabetes Treatment Center, Prince Sultan Military Medical City, P.O. Box 7897, Riyadh 11159, Saudi Arabia
INTRODUCTION
The World Health Organization (WHO) and International Diabetes Federation (IDF) have projected that the number of diabetes cases will increase to 366 million by 2030, an increase of 214% compared to the year 2006 [1]. Diabetes mellitus (DM) is associated with multiple medical complications that decrease the health-related quality of life (HRQOL) and con- tribute to suboptimal physical and mental functioning and
earlier mortality [2,3]. Coronary heart disease, depression, and unhealthy eating habits have significant negative effects on quality of life (QOL) of DM patients [2,4,5].
The IDF reported that five of the top 10 countries with the highest prevalence rates of diabetes in the world are situated within the Gulf region including Saudi Arabia [6]. There has been a changing pattern of lifestyle among the Saudi popula- tion towards urbanization and dietary habits [7]. The chronic consumption of high energy, high fat diets, and low levels of http://dx.doi.org/10.4093/dmj.2014.38.3.220
pISSN 2233-6079 · eISSN 2233-6087
physical activity lead to changes in energy balance with con- servation of energy stored as fat. Such excess energy consump- tion per se promotes insulin resistance even before significant weight gain occurs [7]. The WHO projects a 3-fold increase in the number of people with DM from 890,000 in 2000 to 2,523,000 in 2030 in Saudi Arabia [8].
HRQOL refers to the physical, psychological, and social do- mains of health that are influenced by a person’s experiences, beliefs, expectations, and perceptions; therefore, health care providers should strive to understand the physical, emotional, and social impacts of chronic disease such as DM [9]. In order to improve the day-to-day functions and HRQOL, patient- centered knowledge can be incorporated into chronic disease treatment strategies that may lead to lesser office visits, hospi- talizations and reduced health care costs [10]. Studies have shown that HRQOL among diabetics are much lower than those reported among nondiabetics [4,11].
There are multifactorial reasons for lower QOL among dia- betics. Diabetics are more likely to be older, overweight, less likely to exercise, and more likely to have comorbidities such as hypertension, coronary artery disease, hypercholesterol- emia [12]; and are more likely to have complications such as retinopathy, nephropathy, painful polyneuropathy, upper gas- trointestinal symptoms, impotence, amputations, symptomat- ic hyperglycemia, and hypoglycemia [4]. Lower health related QOL scores are associated with all these aspects. In addition, the cost of managing diabetic patients is twice as costly as managing nondiabetic patients, mainly due to the high costs associated with management of diabetic complications [13].
The objective of the present study was to assess the factors as- sociated with HRQOL among patients with type 2 diabetes mellitus (T2DM).
METHODS
This was a cross sectional study conducted among 283 type 2 diabetic patients at a major tertiary hospital, Riyadh, Saudi Arabia between June 2011 and September 2012. The respon- dents were purposively and conveniently selected according to their availability during their routine visit to the outpatient clinics. Inclusion criteria were: age range of 18 to 70 years; dia- betes identified as type 2; diabetes diagnosed ≥1 year and Sau- di national. Patients who had history of psychopathology, medical instability, visual, hearing, or cognitive impairment, type 1 diabetes, and gestational diabetics were excluded from
the study. The demographic and the history of the DM were also collected.
Definitions of demographic variables and measurements The patients were classified as poor if their monthly income was ≤5,000 Saudi Arabian Riyal (SAR), monthly income SAR
>5,000 to 10,000 were classified as middle and monthly in- come SAR >10,000 were considered as high income group.
Diabetes related complications including diabetic nephrop- athy, diabetic neuropathy, retinopathy, diabetic cardiomyopa- thy, coronary artery disease, peripheral vascular disease, and stroke detail were collected. Diabetic nephropathy was diag- nosed by the nephrologists (the presence of microalbuminuria which defined as, the presence of microalbuminuria ≥30 to 299 mg/24 hours urine collection sample or the presence of macro albuminuria ≥300 mg/24 hours urine collection sam- ple) was obtained from the patient’s record. Diabetic neuropa- thies are heterogeneous, affecting different parts of the ner- vous system that present with diverse clinical manifestations.
They may be focal or diffuse. Retinopathy was defined accord- ing to the American Academy of Ophthalmology. Patients were classified into nonproliferative diabetic retinopathy and proliferative diabetic retinopathy.
Blood pressure was measured using a standardized sphyg- momanometer. A trained nurse performed the procedure while the subject was in a sitting position, with the arm at the level of the heart and after 5 minutes rest. Hypertension was defined as elevated systolic (≥140 mm Hg) or diastolic (≥90 mm Hg) blood pressure. Glycosylated hemoglobin (HbA1c) was ana- lyzed using high-performance liquid chromatography method (Bio-Rad, Hercules, CA, USA).
The definition of control of lipid profile components used in this study is according to National Cholesterol Educational Program Adult Treatment Panel ΙΙΙ and American Diabetes Association recommendations. Family history DM was de- fined as the presence of DM in first-degree relatives.
HADS
The anxiety and depression symptom’s measurements were as- sessed for the patients using hospital anxiety and depression scale (HADS), Arabic version [14]. This scale is very simple and easy to use by most people with no major language problems, and has no cultural or psychological sensitive questions. In ad- dition, it is known to have very high validity and reliability.
The HADS consists of seven items for anxiety (HADS-A)
and seven for depression (HADS-D). The items were scored on a 4-point scale from 0 (not present) to 3 (considerable). The item scores are added, giving subscale scores on the HADS- anxiety and the HADS-depression from 0 to 21 [14].
SF-36
Patients were interviewed using the Arabic version of the Short-Form 36-item survey (SF-36) to assess the HRQOL. In- terviews were conducted in a separate room in order to main- tain privacy and confidentiality. It was revealed that there were no significant mean differences between Arabic and English SF-36 questionnaires in Saudi Cultures [15]. The SF-36 in- cludes eight health concepts: physical functioning, bodily pain, role limitations due to physical health problems, role limitations due to personal or emotional problems, emotional well-being, social functioning, energy/fatigue, and general health perceptions. It also includes a single item that provides an indication of perceived change in health. These 36 items were adapted from longer instruments completed by patients participating in the Medical Outcomes Study, an observational study of variations in physician practice styles and patient out- comes in different systems of health care delivery [16]. Sub- scale scores are calculated according to standard procedures, yielding score values of 0 to 100, where higher scores indicate better HRQOL. Questionnaires for illiterate subjects were filled in the presence of two witnesses.
The SF-36 Health Survey items and scales were constructed using the Likert method of summated ratings. Answers to each questions were scored (some items need to be recoded).
These scores were then summed to produce raw scale scores for each health concept which were then transformed to a 0 to 100 scale with higher scores indicating better functioning, well-being, and state of health. Reliability and validity of the SF-36 have been demonstrated for both type 1 diabetes pa- tients and type 2 diabetes patients.
Statistical analysis
Data analysis was carried out using Microsoft Excel 2002 (Mi- crosoft Corp., Seattle, WA, USA) and SPSS version 16 (SPSS Inc., Chicago, IL, USA). In addition to the descriptive analysis t-test, one way analysis of variance, and Tukey post hoc tests were conducted to look at differences carried out for making comparisons among test groups. Multivariate linear regression analysis was done to understand the variables associated with HRQOL. P value of <0.05 was considered to be statistically
significant.
RESULTS
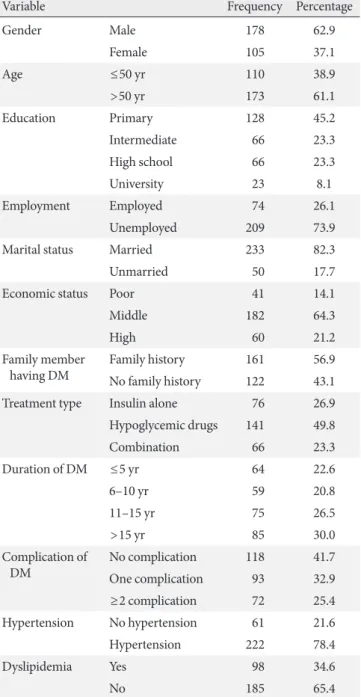
The demographic data (gender, age, marital status, level of ed- ucation, income, and employment) are presented in Table 1.
The mean age of the study participants was 56.4±13.2 years.
Table 1. Demographic and history of diabetes mellitus of the study population
Variable Frequency Percentage
Gender Male 178 62.9
Female 105 37.1
Age ≤50 yr 110 38.9
>50 yr 173 61.1
Education Primary 128 45.2
Intermediate 66 23.3
High school 66 23.3
University 23 8.1
Employment Employed 74 26.1
Unemployed 209 73.9
Marital status Married 233 82.3
Unmarried 50 17.7
Economic status Poor 41 14.1
Middle 182 64.3
High 60 21.2
Family member
having DM Family history 161 56.9
No family history 122 43.1
Treatment type Insulin alone 76 26.9
Hypoglycemic drugs 141 49.8
Combination 66 23.3
Duration of DM ≤5 yr 64 22.6
6–10 yr 59 20.8
11–15 yr 75 26.5
>15 yr 85 30.0
Complication of
DM No complication 118 41.7
One complication 93 32.9
≥2 complication 72 25.4
Hypertension No hypertension 61 21.6
Hypertension 222 78.4
Dyslipidemia Yes 98 34.6
No 185 65.4
DM, diabetes mellitus.
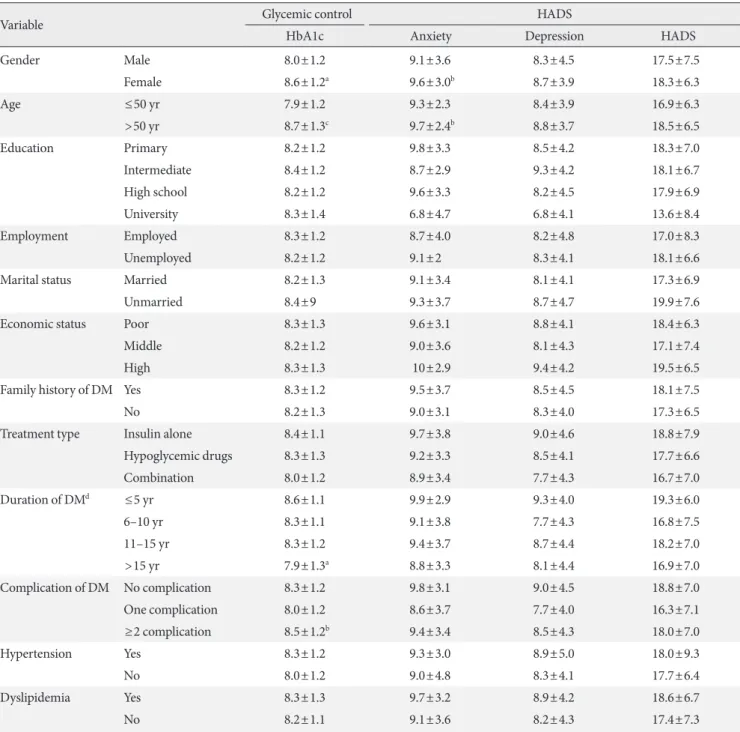
One hundred and seventy-eight were males (62.9%) and 105 were females (37.1%). The mean duration of diagnosis of DM was 11.8±8.4 years. Table 2 presents the levels of glycemic control, anxiety, and depression of the study population. Com- pared to male, female had significantly higher HbA1c (P<
0.01) and anxiety level (P<0.05). Likewise, the group with over 50 years of age had significantly higher HbA1c (P<0.001) and anxiety level (P<0.05) than ≤50 years of age group. Also, significant differences were found on HbA1c level of pro- longed duration DM patients (P<0.01) and patients with ≥2
Table 2. Glycemic control, anxiety, and depression differences in the study population
Variable Glycemic control HADS
HbA1c Anxiety Depression HADS
Gender Male 8.0±1.2 9.1±3.6 8.3±4.5 17.5±7.5
Female 8.6±1.2a 9.6±3.0b 8.7±3.9 18.3±6.3
Age ≤50 yr 7.9±1.2 9.3±2.3 8.4±3.9 16.9±6.3
>50 yr 8.7±1.3c 9.7±2.4b 8.8±3.7 18.5±6.5
Education Primary 8.2±1.2 9.8±3.3 8.5±4.2 18.3±7.0
Intermediate 8.4±1.2 8.7±2.9 9.3±4.2 18.1±6.7
High school 8.2±1.2 9.6±3.3 8.2±4.5 17.9±6.9
University 8.3±1.4 6.8±4.7 6.8±4.1 13.6±8.4
Employment Employed 8.3±1.2 8.7±4.0 8.2±4.8 17.0±8.3
Unemployed 8.2±1.2 9.1±2 8.3±4.1 18.1±6.6
Marital status Married 8.2±1.3 9.1±3.4 8.1±4.1 17.3±6.9
Unmarried 8.4±9 9.3±3.7 8.7±4.7 19.9±7.6
Economic status Poor 8.3±1.3 9.6±3.1 8.8±4.1 18.4±6.3
Middle 8.2±1.2 9.0±3.6 8.1±4.3 17.1±7.4
High 8.3±1.3 10±2.9 9.4±4.2 19.5±6.5
Family history of DM Yes 8.3±1.2 9.5±3.7 8.5±4.5 18.1±7.5
No 8.2±1.3 9.0±3.1 8.3±4.0 17.3±6.5
Treatment type Insulin alone 8.4±1.1 9.7±3.8 9.0±4.6 18.8±7.9
Hypoglycemic drugs 8.3±1.3 9.2±3.3 8.5±4.1 17.7±6.6
Combination 8.0±1.2 8.9±3.4 7.7±4.3 16.7±7.0
Duration of DMd ≤5 yr 8.6±1.1 9.9±2.9 9.3±4.0 19.3±6.0
6–10 yr 8.3±1.1 9.1±3.8 7.7±4.3 16.8±7.5
11–15 yr 8.3±1.2 9.4±3.7 8.7±4.4 18.2±7.0
>15 yr 7.9±1.3a 8.8±3.3 8.1±4.4 16.9±7.0
Complication of DM No complication 8.3±1.2 9.8±3.1 9.0±4.5 18.8±7.0
One complication 8.0±1.2 8.6±3.7 7.7±4.0 16.3±7.1
≥2 complication 8.5±1.2b 9.4±3.4 8.5±4.3 18.0±7.0
Hypertension Yes 8.3±1.2 9.3±3.0 8.9±5.0 18.0±9.3
No 8.0±1.2 9.0±4.8 8.3±4.1 17.7±6.4
Dyslipidemia Yes 8.3±1.3 9.7±3.2 8.9±4.2 18.6±6.7
No 8.2±1.1 9.1±3.6 8.2±4.3 17.4±7.3
Values are presented as mean±standard deviation (t-test, one way analysis of variance, and Tukey post hoc test).
HADS, hospital anxiety and depression scale; HbA1c, glycosylated hemoglobin; DM, diabetes mellitus.
aP<0.01, bP<0.05, cP<0.001, d≤5 years vs.>15 years.
complication of DM (P<0.05) compared to ≤5 years duration of DM and DM patients without any complication respective- ly. Table 3 presents the scores of the SF-36 domains/subscales among the type 2 diabetic subjects. The HRQOL was found to be significantly lower among female on subscale physical functioning, role emotional, energy, emotional, social, and pain than to their counterpart. The group with over 50 years of age also showed significantly lower HRQOL on subscale, physical functioning (P<0.001), role of emotional (P<0.01), and energy (P<0.001) than the group with under 50 years of age. When compared to those with poor economic status, pa- tients with middle and high economic status had significantly
higher HRQOL in all subscales (P<0.05). However, there was no significant difference found between middle and high eco- nomic status patients (P>0.05). Table 4 shows the scores of SF- 36 domains/subscales among type 2 diabetic subjects which are presented based on diabetes complication and associated diseases. Compared to patients who used insulin alone, patient treated with combination of treatments i.e., insulin+hypogly- cemic drug showed significantly higher HRQOL on all the subscales (P<0.05) except pain (P>0.05). However, no signifi- cant difference was observed between patients who had hypo- glycemic drug and combination of treatments other than physical functioning. The patients who reported having DM Table 3. Influence of demographic variables on health related quality of life of the study population
Variable
Quality of life Physical
functioning Role physical
health Role
emotional Energy Emotional Social Pain General
health Health change Gender
Male 73.4±20.0 83.3±30.8 76.2±33.6 54.3±9.5 60.2±11.2 71.0±17.5 74.3±19.6 64.9±20.6 64.4±26.4 Female 40.8±18.1a 57.2±8.4 44.9±41.4a 36.1±12.1a 52.6±13.6a 58.2±18.2a 59.8±22.2a 45.6±22.3 28.5±23.1 Age, yr
≤50 63.2±19.2 76.3±28.3 67.2±26.8 56.4±11.2 61.4±11.2 71.4±16.5 64.2±21.3 65.4±23.4 52.5±26.5 >50 45.5±17.5a 53.1±8.4 47.9±38.7b 34.5±13.5a 57.3±14.3 65.6±18.2 62.1±24.5 41.5±18.9 46.7±27.3 Education
Primary 62.3±26.4 73.5±37.1 63.5±39.3 48.0±13.5 57.9±12.9 65.1±17.9 70.4±22.1 59.5±23.1 52.1±31.0 Intermediate 57.7±72.7 36.7±65.6 65.6±42.9 47.2±14.4 56.1±12.1 67.8±18.7 67.3±20.3 52.7±23.0 51.1±30.5 High school 62.9±24.2 75.5±35.1 64.3±39.0 47.0±14.3 56.8±13.5 65.3±21.6 66.1±23.1 56.7±23.3 47.2±28.8 University 61.5±23.6 72.8±32.7 68.1±35.5 47.6±11.3 60.1±10.5 71.2±14.8 73.8±19.0 65.5±22.0 56.5±33.8 Employment
Employed 60.1±24.6 75.3±34.9 68.0±38.7 49.1±13.7 59.3±12.3 68.2±17.8 70.2±20.8 60.2±22.4 51.3±30.5 Unemployed 61.7±25.1 73.0±36.5 63.3±39.9 47.0±13.7 56.7±12.8 65.6±19.2 68.5±22.1 56.9±23.4 51.0±30.5 Marital status
Married 62.3±24.7 74.8±36.0 65.9±38.8 48.4±13.7 58.0±12.2 66.1±18.5 69.5±21.1 57.9±23.0 51.8±30.3 Unmarried 56.8±26.0 68.1±36.2 58.3±43.1 43.7±12.9 54.3±14.4 67.0±20.4 66.1±24.3 57.1±24.2 47.9±31.9 Economic status
Poor 36.9±16.3 27.4±29.4 17.0±30.8 39.0±12.2 44.6±12.8 46.6±17.0 47.9±18.8 30.3±15.6 23.7±23.6 Middle 64.1±22.9a 79.8±31.8a 72.0±35.9a 48.4±13.4a 58.7±11.3a 70.1±17.2a 71.6±19.3a 60.9±21.1a 54.0±29.5a High 69.4±26.0a 86.6±27.4a 74.4±32.6a 51.0±13.5a 62.2±11.2c 68.1±16.6a 75.2±22.5a 67.0±20.0a 60.8±27.7a Family history of DM
Yes 60.9±24.6 71.8±36.6 62.6±40.8 47.3±13.6 56.4±13.1 64.9±19.1 68.8±22.1 56.6±23.8 51.0±31.5 No 61.9±25.4 76.0±35.4 67.2±38.0 47.9±13.8 58.7±12.0 68.1±18.4 69.2±21.4 59.3±22.3 51.2±29.4 Values are presented as mean±standard deviation (t-test, one way analysis of variance, and Tukey post hoc test).
DM, diabetes mellitus.
aP<0.001, bP<0.01, cP<0.05.
for longer duration (>15 years) had significantly higher risk of subscale, physical functioning, role of physical health, role emotional, general health, and health change. When com- pared to diabetic patients with no complication, patients ≥2 complication had significantly higher risk of subscale, physical functioning, role of physical health, role emotional, energy, emotional, social, pain, general health, and health change. Sig- nificant differences were also observed in patients with ≥2 complication on all subscales of HRQOL except energy when compared to patients with one complication. Table 5 demon- strates the results of regression analyses with β-coefficient and 95% confidence interval for SF-36 dimensions adjusted for significant confounders gender, age, economic status, treat-
ment type, duration of DM, and complication of DM. Gender, economic status (except subscale energy) and complications of DM (except subscale energy) were the independent risk fac- tor for HRQOL.
DISCUSSION
The prevalence of DM is steadily increasing in Saudi Arabia due to population growth, aging, urbanization, increasing prevalence of obesity and physical inactivity. HRQOL refers to the physical, psychological, and social domains of health that are influenced by a person’s experiences, beliefs, expectations, and perceptions [8]. According to the previous study, poor Table 4. Diabetes and its complications on health related quality of life of the study population
Variable
Quality of life Physical
functioning Role physi-
cal health Role
emotional Energy Emotional Social Pain General
health Health change Treatment type
Insulin alone 52.3±24.9 68.2±37.2 62.4±41.1 47.1±14.0 56.6±12.3 64.0±18.7 68.8±21.6 54.9±23.7 49.7±29.6 Hypoglycemic
drugs 58.4±23.9a 71.0±37.6 64.3±32.4 49.8±13.7 57.4±11.5 69.2±14.3 67.4±24.7 57.9±21.1 52.4±26.7 Combination of
drugs (insulin+
hypoglycemic drug)
74.4±21.7b 83.2±30.3b 75.0±35.3a 51.4±11.6c 60.4±12.6b 72.3±18.5c 71.4±21.3 64.8±21.3c 59.5±31.3a
Duration of DM, yrd
≤5 68.9±23.9 81.7±28.7 72.4±36.3 49.9±12.5 59.6±11.9 70.8±17.6 68.2±22.3 62.0±22.4 59.3±29.3 6–10 62.5±25.1 77.5±35.8 68.9±36.5 49.4±14.0 59.4±12.2 66.9±17.1 71.2±20.1 62.1±21.0 48.3±31.4 11–15 61.6±25.0 73.3±38.4 65.7±39.1 47.2±12.9 57.1±12.7 66.0±18.6 71.6±21.2 58.3±22.5 53.6±30.1 >15 54.5±24.1c 65.1±37.8a 54.6±43.0a 44.8±14.7 54.5±13.1 62.6±20.4 65.6±22.7 51.1±24.5a 44.6±30.1a Complication
of DMe
No complication 68.6±24.6 86.2±27.1 74.4±32.4 49.2±13.5 60.9±11.2 68.7±17.3 73.6±22.0 64.9±19.8 58.4±28.0 One complication 62.8±23.1 78.2±33.4 72.0±37.5 48.4±13.5 57.8±12.4 70.9±17.7 69.2±20.8 60.9±21.5 52.9±30.3 ≥2 complication 47.3±22.2b,f 38.8±42.2b,f 41.7±84.5b,f 43.8±13.6a 51.0±13.1b,f 56.2±19.1b,f 60.9±20.4b,g 42.0±23.3b,f 36.8±30.5b,h Hypertension
No HTN 64.3±24.3 77.4±34.0 69.9±37.3 49.5±12.8 59.2±11.3 67.4±19.5 70.1±22.6 59.0±22.4 52.0±27.4 HTN 60.5±25.1 72.6±36.6 63.1±40.2 47.0±13.9 56.9±13.0 65.9±18.7 68.6±21.5 57.4±23.4 50.8±31.4 Dyslipidemia
No dyslipidemia 61.0±25.0 74.8±35.7 66.3±39.9 47.5±13.3 57.6±12.3 67.2±18.3 69.3±21.8 57.5±23.1 50.9±29.8 Dyslipidemia 61.9±24.9 71.4±36.8 61.3±39.1 47.7±14.4 57.0±13.3 64.4±19.7 68.3±21.6 58.2±23.4 51.4±32.1 Values are presented as mean±standard deviation (t-test, one way analysis of variance, and Tukey post hoc test).
DM, diabetes mellitus; HTN, hypertension.
aP<0.05, bP<0.001, cP<0.01, d≤ 5 years vs. >15 years, eNo complication vs. ≥2 complications, fP<0.001, gP<0.05, hP<0.01, one complication vs. ≥2 complication.
glycemic control is reported among more than half of Saudi populations with T2DM [17].
Patients with T2DM were generally found to be overweight, obese, sedentary, and frequently found to be hypertensive. It is, therefore, suggested that patients need to pay attention to
their weight by participating in weight reduction programmes and improving their physical activity levels to reduce the risk of developing the complications associated with type 2 diabe- tes [11]. A comprehensive approach that include, diabetes ed- ucation, life style modification, good glycemic control, mini- Table 5. Results of regression analyses with β-coefficient and 95% confidence interval for SF-36 dimensions adjusted for signifi- cant confounders gender, age, economic status, treatment type, duration of diabetes mellitus, and complication of diabetes melli- tus (n=283)
Variable
Physical functioning Role physical health Role emotional
β 95% CI
P value β 95% CI
P value β 95% CI
P value
Lower Upper Lower Upper Lower Upper
Gender –22.5 –27.1 –17.8 <0.001 –17.3 –24.9 –9.72 <0.001 –22.1 –30.8 –13.3 <0.001 Age 0.001 –0.148 0.150 0.986 –0.050 –0.294 0.194 0.686 –0.067 –0.347 0.214 0.639 Economic
status 7.60 3.65 11.5 <0.001 16.4 10.0 22.9 <0.001 15.7 8.36 23.2 <0.001 Treatment
type 0.808 –2.31 3.92 0.611 1.43 –3.66 6.53 0.580 0.079 –5.79 5.95 0.979
Duration of
DM –1.01 –2.99 0.958 0.311 –1.65 –4.89 1.58 0.315 –1.15 –4.87 2.56 0.541
Complica
tion of DM –6.31 –9.19 –3.44 <0.001 –11.4 –16.1 –6.70 <0.001 –10.4 –15.8 –4.98 <0.001
Energy Emotional Social
Gender –9.94 –12.8 –7.07 <0.001 4.63 –7.54 –1.72 0.002 –9.72 –14.1 –5.28 <0.001
Age 0.019 –0.073 0.111 0.682 0.015 –0.078 0.109 0.744 –0.003 –0.145 0.139 0.971
Economic
status 1.45 –0.987 3.88 0.242 5.68 3.21 8.15 <0.001 5.32 1.56 9.09 0.006
Treatment
type 1.01 –0.911 2.94 0.300 0.163 –1.78 2.11 0.869 –0.430 –3.40 2.54 0.776
Duration of
DM –1.54 –2.76 –0.323 0.013 –0.511 –1.74 0.726 0.417 –0.870 –2.75 1.01 0.364
Complica
tion of DM 0.868 –0.910 2.64 0.337 –2.81 –4.61 –1.01 0.002 –3.04 –5.79 –0.304 0.030
Pain General health Health change
Gender –10.6 –15.6 –5.57 <0.001 –13.2 –18.1 –8.26 <0.001 –31.5 –37.7 –25.2 <0.001 Age –0.092 –0.254 0.070 0.265 0.012 –0.146 0.170 0.882 –0.010 –0.211 0.191 0.921 Economic
status 9.33 5.05 13.62 <0.001 10.6 6.48 14.8 <0.001 7.59 2.27 12.9 0.005 Treatment
type 1.85 –1.53 5.23 0.283 –0.713 –4.02 2.59 0.672 –0.954 –5.15 3.24 0.655
Duration of
DM 1.43 –0.710 3.58 0.189 –0.838 –2.93 1.25 0.432 –0.429 –3.09 2.23 0.751
Complica
tion of DM –3.57 –6.70 –0.453 0.025 –6.63 –9.68 –3.58 <0.001 –4.96 –8.84 –1.09 0.012 Multivariate linear regression analysis.
CI, confidence interval; DM, diabetes mellitus.
mization of cardiovascular risk, avoidance of drugs that can aggravate glucose or lipid metabolism, and screening for dia- betes complications are essential for the management of pa- tients with T2DM. QOL can also be improved by delaying the advancement of diabetes complications through a comprehen- sive diabetes management [18].
Over the past decade, differences between men and women with T2DM have been intensively investigated, revealing that the women with diabetes appeared to have worse HRQOL and mental well-being than the men with diabetes [13,19]. The present study also reported that female with diabetes appeared to have worse HRQOL and mental well-being than their counterpart. The multivariate analysis indicated gender as in- dependent risk factor of HRQOL. Therefore, identifying strat- egies to improve self-rated health and HRQOL among diabet- ic patients, especially among Saudi women, is of great impor- tance.
Age has been another parameter which has an effect on the HRQOL of diabetic patients [20]. Hanninen et al. [21] report- ed that age has no effect on diabetic patient’s HRQOL; howev- er, another study reported that patients who are less than 40 years of age have significantly better QOL than other age groups [22]. The present study found a negative correlation between age and HRQOL. In addition, it is understood that men and women with diabetes face different challenges in the management of their condition [23].
Low socioeconomic status and patients with a high school education or less had a strong negative impact on HRQOL of diabetes patients especially in the younger age group [24,25].
The present study also found that patients with a low econom- ic status and high school education or less had at least one poor HRQOL outcome. However, multivariate linear regres- sion analysis indicated only economic status as independent risk factor for HRQOL in diabetes patients.
Many studies reported an association between increased duration of diabetes and poor HRQOL, in both types of diabe- tes [26,27]. On the other hand, there are also contradicting findings about the association between duration of diabetes and HRQOL. In this present study we found a negative associ- ation between diabetes duration and HRQOL. The longer du- ration of diabetes is associated with the poor HRQOL.
Studies reported that insulin treatment was one of the im- portant factors associated with HRQOL. Insulin-treated dia- betic patients reported reduced impact on HRQOL than tab- lets/diet-treated patients [28,29]. This study also observed a
significantly better HRQOL among insulin treated patients than oral hypoglycemic drugs treated patients. In addition, the combination of insulin and oral hypoglycemic drugs treated patients had better HRQOL than those treated with insulin alone. However, multivariate analysis indicated no significant association between type of type of treatment and HRQOL.
Diabetes patients are more susceptible to macro or micro- angiopathic complications, such as myocardial infarction, stroke, and peripheral arterial occlusive disease than those without T2DM. Literature also suggested a link between dia- betic microvascular complications such as retinopathy, ne- phropathy, and neuropathy, and cardiovascular diseases. There is now extensive evidence that microalbuminuria, a marker of nephropathy, is also a strong predictor of total and cardiovas- cular mortality in patients with T2DM [11,30]. The American Diabetic Association has estimated that 75% to 80% of adult diabetic patients will ultimately die as a result of macrovascu- lar complications due to their underlying disease [31]. The in- cidence of diabetic complications has been shown to have a significant impact on QOL in a number of studies [32]. The long-term complications, particularly microvascular disease, have been directly related to poor glycemic control [33]. As many patients are likely to remain undiagnosed for several years before symptoms appear, many will show evidence of di- abetic complications at diagnosis [34,35]. The present study indicated a significantly lower HRQOL among patients with diabetes complication than the patients with diabetes alone.
Further, multivariate analysis indicated complication of DM as an independent risk factor for all subscales of SF36 except energy.
In conclusion, the result of this study indicates a significant association between DM and HRQOL. Gender, economic sta- tus, diabetes treatment type and complication of DM were in- dependent risk factors for majority of the subscales of HRQOL.
Understanding the effect of diabetes on QOL is important for day-to-day clinical management and also for public health policy initiatives in order to improve the QOL and health out- comes of those with diabetes.
CONFLICTS OF INTEREST
No potential conflict of interest relevant to this article was re- ported.
REFERENCES
1. Agarwal S, Raman R, Paul PG, Rani PK, Uthra S, Gayathree R, McCarty C, Kumaramanickavel G, Sharma T. Sankara nethra- laya-diabetic retinopathy epidemiology and molecular genetic study (SN-DREAMS 1): study design and research methodol- ogy. Ophthalmic Epidemiol 2005;12:143-53.
2. Cong JY, Zhao Y, Xu QY, Zhong CD, Xing QL. Health-related quality of life among Tianjin Chinese patients with type 2 dia- betes: a cross-sectional survey. Nurs Health Sci 2012;14:528- 34.
3. Scollan-Koliopoulos M, Bleich D, Rapp KJ, Wong P, Hofmann CJ, Raghuwanshi M. Health-related quality of life, disease se- verity, and anticipated trajectory of diabetes. Diabetes Educ 2013;39:83-91.
4. Daniele TM, Bruin VM, Oliveira DS, Pompeu CM, Forti AC.
Associations among physical activity, comorbidities, depres- sive symptoms and health-related quality of life in type 2 dia- betes. Arq Bras Endocrinol Metabol 2013;57:44-50.
5. Egede LE, Hernandez-Tejada MA. Effect of comorbid depres- sion on quality of life in adults with type 2 diabetes. Expert Rev Pharmacoecon Outcomes Res 2013;13:83-91.
6. Alzaid A. Diabetes: a tale of two cultures. Br J Diabetes Vasc Dis 2012;12:57.
7. Al-Hayek AA, Robert AA, Alzaid AA, Nusair HM, Zbaidi NS, Al-Eithan MH, Sam AE. Association between diabetes self- care, medication adherence, anxiety, depression, and glycemic control in type 2 diabetes. Saudi Med J 2012;33:681-3.
8. Wild S, Roglic G, Green A, Sicree R, King H. Global preva- lence of diabetes: estimates for the year 2000 and projections for 2030. Diabetes Care 2004;27:1047-53.
9. Camacho F, Anderson RT, Bell RA, Goff DC Jr, Duren-Win- field V, Doss DD, Balkrishnan R. Investigating correlates of health related quality of life in a low-income sample of patients with diabetes. Qual Life Res 2002;11:783-96.
10. Genovese S, Tedeschi D. Effects of vildagliptin/metformin therapy on patient-reported outcomes: work productivity, pa- tient satisfaction, and resource utilization. Adv Ther 2013;30:
152-64.
11. Oguntibeju OO, Odunaiya N, Oladipo B, Truter EJ. Health be- haviour and quality of life of patients with type 2 diabetes at- tending selected hospitals in south western Nigeria. West Indi- an Med J 2012;61:619-26.
12. Myers VH, McVay MA, Brashear MM, Johannsen NM, Swift DL, Kramer K, Harris MN, Johnson WD, Earnest CP, Church
TS. Exercise training and quality of life in individuals with type 2 diabetes: a randomized controlled trial. Diabetes Care 2013;
36:1884-90.
13. Mikailiukstiene A, Juozulynas A, Narkauskaite L, Zagminas K, Salyga J, Stukas R. Quality of life in relation to social and dis- ease factors in patients with type 2 diabetes in Lithuania. Med Sci Monit 2013;19:165-74.
14. Zigmond AS, Snaith RP. The hospital anxiety and depression scale. Acta Psychiatr Scand 1983;67:361-70.
15. Al Abdulmohsin SA, Coons S, Draugalis JR, Hays RD. Trans- lation of the RAND 36-item health survey 1.0 (aka SF-36) into Arabic. Santa Monica: Rand; 1997.
16. Hays RD, Shapiro MF. An overview of generic health-related quality of life measures for HIV research. Qual Life Res 1992;1:
91-7.
17. Al-Nuaim AR, Mirdad S, Al-Rubeaan K, Al-Mazrou Y, Al-At- tas O, Al-Daghari N. Pattern and factors associated with glyce- mic control of Saudi diabetic patients. Ann Saudi Med 1998;18:109-12.
18. Imam K. Management and treatment of diabetes mellitus. Adv Exp Med Biol 2012;771:356-80.
19. Unden AL, Elofsson S, Andreasson A, Hillered E, Eriksson I, Brismar K. Gender differences in self-rated health, quality of life, quality of care, and metabolic control in patients with dia- betes. Gend Med 2008;5:162-80.
20. Song SH. Emerging type 2 diabetes in young adults. Adv Exp Med Biol 2012;771:51-61.
21. Hanninen J, Takala J, Keinanen-Kiukaanniemi S. Quality of life in NIDDM patients assessed with the SF-20 questionnaire.
Diabetes Res Clin Pract 1998;42:17-27.
22. Al-Maskari MY, Al-Shookri AO, Al-Adawi SH, Lin KG. As- sessment of quality of life in patients with type 2 diabetes mel- litus in Oman. Saudi Med J 2011;32:1285-90.
23. Grant JF, Hicks N, Taylor AW, Chittleborough CR, Phillips PJ;
North West Adelaide Health Study Team. Gender-specific epi- demiology of diabetes: a representative cross-sectional study.
Int J Equity Health 2009;8:6.
24. Eljedi A, Mikolajczyk RT, Kraemer A, Laaser U. Health-related quality of life in diabetic patients and controls without diabetes in refugee camps in the Gaza strip: a cross-sectional study.
BMC Public Health 2006;6:268.
25. Wubben DP, Porterfield D. Health-related quality of life among North Carolina adults with diabetes mellitus. N C Med J 2005;
66:179-85.
26. Glasgow RE, Ruggiero L, Eakin EG, Dryfoos J, Chobanian L.
Quality of life and associated characteristics in a large national sample of adults with diabetes. Diabetes Care 1997;20:562-7.
27. Redekop WK, Koopmanschap MA, Stolk RP, Rutten GE, Wolffenbuttel BH, Niessen LW. Health-related quality of life and treatment satisfaction in Dutch patients with type 2 diabe- tes. Diabetes Care 2002;25:458-63.
28. Bradley C, Todd C, Gorton T, Symonds E, Martin A, Plowright R. The development of an individualized questionnaire mea- sure of perceived impact of diabetes on quality of life: the AD- DQoL. Qual Life Res 1999;8:79-91.
29. Holmanova E, Ziakova K. Audit diabetes-dependent quality of life questionnaire: usefulness in diabetes self-management ed- ucation in the Slovak population. J Clin Nurs 2009;18:1276-86.
30. Dinneen SF, Gerstein HC. The association of microalbumin- uria and mortality in non-insulin-dependent diabetes mellitus.
A systematic overview of the literature. Arch Intern Med 1997;
157:1413-8.
31. American Diabetes Association. Detection and management of lipid disorders in diabetes. Diabetes Care 1993;16:828-34.
32. Lloyd A, Sawyer W, Hopkinson P. Impact of long-term com- plications on quality of life in patients with type 2 diabetes not using insulin. Value Health 2001;4:392-400.
33. UK Prospective Diabetes Study (UKPDS) Group. Intensive blood-glucose control with sulphonylureas or insulin com- pared with conventional treatment and risk of complications in patients with type 2 diabetes (UKPDS 33). Lancet 1998;
352:837-53.
34. UK Prospective Diabetes Study 6. Complications in newly di- agnosed type 2 diabetic patients and their association with dif- ferent clinical and biochemical risk factors. Diabetes Res 1990;
13:1-11.
35. Harris MI, Klein R, Welborn TA, Knuiman MW. Onset of NI- DDM occurs at least 4-7 yr before clinical diagnosis. Diabetes Care 1992;15:815-9.