Endocrinol Metab 2019;34:406-414 https://doi.org/10.3803/EnM.2019.34.4.406 pISSN 2093-596X · eISSN 2093-5978
Original Article
Impact of the Dynamic Change of Metabolic Health Status on the Incident Type 2 Diabetes: A Nationwide Population- Based Cohort Study
Jung A Kim1, Da Hye Kim2, Seon Mee Kim3, Yong Gyu Park2, Nan Hee Kim1, Sei Hyun Baik1, Kyung Mook Choi1, Kyungdo Han2, Hye Jin Yoo1
1Division of Endocrinology and Metabolism, Department of Internal Medicine, Korea University College of Medicine;
2Department of Biostatistics, College of Medicine, The Catholic University of Korea; 3Department of Family Medicine, Korea University College of Medicine, Seoul, Korea
Background: Metabolically healthy obese (MHO) is regarded as a transient concept. We examined the effect of the dynamic change of metabolic health status on the incidence of type 2 diabetes mellitus (T2DM) both in obese and normal weight individuals.
Methods: We analyzed 3,479,514 metabolically healthy subjects aged over 20 years from the Korean National Health Screening Program, who underwent health examination between 2009 and 2010, with a follow-up after 4 years. The relative risk for T2DM in- cidence until the December 2017 was compared among the four groups: stable metabolically healthy normal weight (MHNW), un- stable MHNW, stable MHO, and unstable MHO.
Results: During the 4 years, 11.1% of subjects in the MHNW group, and 31.5% in the MHO group converted to a metabolically un- healthy phenotype. In the multivariate adjusted model, the unstable MHO group showed the highest risk of T2DM (hazard ratio [HR], 4.67; 95% confidence interval [CI], 4.58 to 4.77). The unstable MHNW group had a higher risk of T2DM than stable MHO group ([HR, 3.23; 95% CI, 3.16 to 3.30] vs. [HR, 1.81; 95% CI, 1.76 to 1.85]). The stable MHO group showed a higher risk of T2DM than the stable MHNW group. The influence of the transition into a metabolically unhealthy phenotype on T2DM incidence was greater in subjects with aged <65 years, women, and those with weight gain.
Conclusion: Metabolically healthy phenotype was transient both in normal weight and obese individuals. Maintaining metabolic health was critical for the prevention of T2DM, irrespective of their baseline body mass index.
Keywords: Obesity; Metabolic syndrome; Diabetes mellitus, type 2
Received: 25 September 2019, Revised: 23 October 2019, Accepted: 25 November 2019
Corresponding authors: Kyungdo Han
Department of Biostatistics, College of Medicine, The Catholic University of Korea, 222 Banpo-daero, Seocho-gu, Seoul 06591, Korea
Tel: +82-2-2258-7226, Fax: +82-2-2258-7226, E-mail: [email protected] Hye Jin Yoo
Division of Endocrinology and Metabolism, Department of Internal Medicine, Korea University Guro Hospital, Korea University College of Medicine, 148 Gurodong-ro, Guro-gu, Seoul 08308, Korea
Tel: +82-2-2626-3045, Fax: +82-2-2626-1096, E-mail: [email protected]
Copyright © 2019 Korean Endocrine Society
This is an Open Access article distributed under the terms of the Creative Com- mons Attribution Non-Commercial License (http://creativecommons.org/
licenses/by-nc/4.0/) which permits unrestricted non-commercial use, distribu- tion, and reproduction in any medium, provided the original work is properly cited.
pISSN 2093-596X · eISSN 2093-5978
INTRODUCTION
Although obesity is a well-known risk factor for type 2 diabetes mellitus (T2DM), many recent studies have focused on sub- groups that show a non-linear relationship between body mass index (BMI) and adverse clinical outcome, such as metabolical- ly healthy obese (MHO) and metabolically unhealthy normal weight (MUNW) phenotypes. In a previous study, the preva- lence of MHO individuals ranged from 3.3% to 43.0% in Cau- casian populations, and 11.9% to 49.0% in Asian populations [1]. The MHO individuals were characterized by preserved in- sulin sensitivity, low visceral fat accumulation, low inflamma- tory activity, and a lack of metabolic and cardiovascular compli- cations [2]. Nevertheless, there have been conflicting studies re- garding the MHO phenotype on the development of T2DM and cardiovascular disease (CVD) [3,4]. These inconsistent out- comes are partly due to the lack of consensus on the definition of metabolic abnormality and changes in body size and meta- bolic phenotype during the follow-up period [5-7]. Recently, large cohort studies have demonstrated that the MHO status represents a transient condition which involves a temporal ex- pression of the dynamics in continuous variables [8]. In the Nurses’ Health Study (NHS), during the median follow-up of 24 years, a substantial percentage of metabolically healthy women converted to unhealthy phenotypes (84% of women with obesity and 68% women with normal weight) [9]. From the 6,809 subjects of the Multi-Ethnic Study of Atherosclerosis (MESA), almost half of the baseline MHO group progressed to a metabolically unhealthy status during the 12.2-year follow-up;
this group also exhibited an increased risk of CVD compared to the stable MHO group (odds ratio, 1.60; 95% confidence inter- val [CI], 1.14 to 2.25) [10]. Considering that the clinical mean- ing of the MHO phenotype becomes more critical during a lon- ger follow-up period [11], the MHO phenotype is regarded as an intermediate stage between a healthy, normal weight and un- healthy, obese individuals.
Metabolic health is also recognized as a transient phenotype among normal weight individuals. In the NHS, only 15% of normal weight women remained metabolically healthy after 30 years of follow-up [9]. MUNW subjects exhibited significantly increased risks of T2DM and CVD [3,12]. One of the underly- ing mechanisms that places MUNW individuals at a higher metabolic risk includes the predominant visceral and ectopic fat accumulation relative to BMI [13]. Therefore, in order to identi- fy individuals with an increased risk of T2DM, continuous as- sessment for metabolic risk should be monitored both in normal
weight and obese subjects.
In the present study, in order to analyze the effect of the dy- namic transition of metabolic health status on the incidence of T2DM both in obese and normal weight individuals, we classi- fied subjects into four groups as follows: (1) stable metabolical- ly healthy normal weight (MHNW) individuals, who main- tained a metabolically healthy phenotype; (2) unstable MHNW, who changed into metabolically unhealthy phenotype; (3) stable MHO; and (4) unstable MHO. We then compared the relative risk (RR) of T2DM during 4.03 years of follow-up using the large-scale Korean National Health Insurance Service (NHIS) database.
METHODS
Data source and study population
The data was obtained from the NHIS and was recorded from January 2009 to December 2017. The NHIS covers almost the entire Korean population (97%) and recommends that all regis- tered people receive a health check-up every 1 or 2 years. The NHIS provides a socioeconomic database (e.g., age, sex, and income), a health exam database (e.g., height, weight, and labo- ratory variables), claims for the disease diagnosis codes of the International Classification of Diseases (ICD-10), and the hos- pital utilization database. Further details of this database, in- cluding validity, have been described in a previous report [14].
Our study protocol was approved by the Korea University Insti- tutional Review Board (IRB), and was in accordance with the Declaration of Helsinki of the World Medical Association (2019GR0106). An informed consent exemption was granted by the IRB since, for the purposes of this study, only anony- mous and de-identified information was provided by the NHIS.
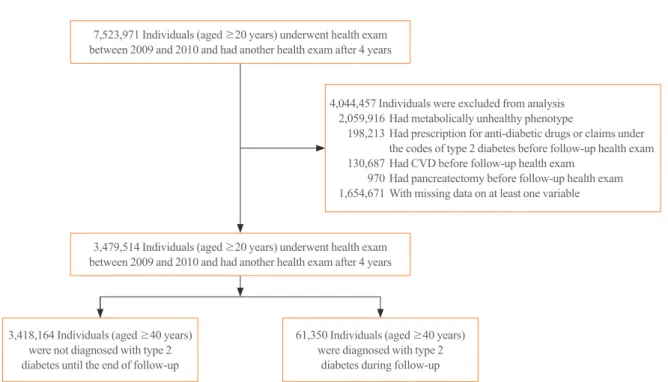
In this retrospective longitudinal study, we enrolled 7,523,971 participants aged ≥20 years who underwent a health exam be- tween 2009 and 2010 and had another health exam after 4 years.
We excluded subjects who met the following criteria: (1) de- fined a metabolically unhealthy at baseline (n=2,059,916); (2) claims of T2DM, stroke, myocardial infarction, congestive heart failure, and total or partial pancreatectomy (n=329,870); and (3) missing data (n=1,654,671) (Fig. 1). As a result, a total of 3,479,514 subjects were enrolled in the final analysis. The pri- mary outcome in the present study was the development of T2DM during the median 4.03-year (interquartile range, 3.34 to 4.42) follow-up duration. The study population was followed from baseline until the date of death, development of T2DM, or December 31, 2017, whichever came first.
Definitions
T2DM was defined as at least one claim per year for the pre- scription of anti-diabetes medication or a fasting glucose level
≥126 mg/dL under ICD-10 codes (E11-14). Subjects who had claims under ICD-10 code E10 were excluded in order to rule out the possibility of type 1 diabetes. Hypertension was defined as systolic blood pressure (SBP) ≥140 mm Hg or diastolic blood pressure (DBP) ≥80 mm Hg, or the presence of claims of anti-hypertensive medications under ICD-10 codes I10-13, 15.
Dyslipidemia was defined as total cholesterol level ≥240 mg/dL or the presence of claims of anti-hyperlipidemic medications under ICD-10 code E78. Myocardial infarction was defined as a claim of ICD I21-22 at least twice, or once if hospitalization oc- curred. Ischemic stroke was defined as a claim of ICD I63-64 with hospitalization and a claim for brain imaging modalities.
Heart failure was defined as at least one hospitalization under ICD-10 code I50. Alcohol consumption was defined as drinking more than 30 g of alcohol per day, and current smoker was de- fined according to the questionnaire. Regular exercise was de- fined as moderate intensity physical activity for more than 30 minutes at least 5 days a week, and high intensity physical ac- tivity for more than 20 minutes at least 3 days a week. A low in- come level was defined from registration in the Medical Aid program as the lowest income population or the lowest one-fifth of the rest of the population in the National Health Insurance program based on monthly household income. The plasma glu-
cose level and lipid profiles were measured from venous sam- ples obtained after an overnight fast. These health check-ups were only carried out at hospitals that were certified by the NHIS.
Body phenotype and metabolic status
The body size and metabolic status were examined at baseline and follow-up. The BMI was calculated as weight (kg) divided by height squared (m2), and normal weight was defined as a BMI of 18 to 25 kg/m2, while obesity was defined as a BMI ≥ 25 kg/m2 [15]. Subjects were considered as metabolically un- healthy if they met three or more of the following criteria based on the definition of metabolic syndrome [16]: (1) waist circum- ference ≥90 cm in men and ≥85 cm in women; (2) SBP ≥130 mm Hg or DBP ≥85 mm Hg or on antihypertensive medica- tion; (3) fasting plasma glucose (FPG) ≥100 mg/dL or claim for T2DM or on anti-diabetic medications; (4) hypertriglyceri- demia ≥150 mg/dL or on lipid medications; and (5) high densi- ty lipoprotein cholesterol <40 mg/dL in men and <50 mg/dL in women, or medication use.
The subjects were stratified into four groups according to baseline body size and whether a metabolically unhealthy phe- notype occurred after 4 years: (1) baseline MHNW, maintaining a metabolically healthy phenotype after 4 years (stable MHNW);
(2) MHNW with the development of a metabolically unhealthy phenotype (unstable MHNW); (3) MHO, maintaining a meta-
7,523,971 Individuals (aged ≥20 years) underwent health exam between 2009 and 2010 and had another health exam after 4 years
3,479,514 Individuals (aged ≥20 years) underwent health exam between 2009 and 2010 and had another health exam after 4 years
3,418,164 Individuals (aged ≥40 years) were not diagnosed with type 2 diabetes until the end of follow-up
61,350 Individuals (aged ≥40 years) were diagnosed with type 2
diabetes during follow-up
4,044,457 Individuals were excluded from analysis 2,059,916 Had metabolically unhealthy phenotype
198,213 Had prescription for anti-diabetic drugs or claims under the codes of type 2 diabetes before follow-up health exam 130,687 Had CVD before follow-up health exam
970 Had pancreatectomy before follow-up health exam 1,654,671 With missing data on at least one variable
Fig. 1. Study flow sheet. CVD, cardiovascular disease.
bolically healthy phenotype (stable MHO); and (4) MHO with the development of a metabolically unhealthy phenotype (un- stable MHO).
Statistical analysis
Data are expressed as mean±standard deviation, median (inter- quartile range), or number (percentage). The differences be- tween the four groups were assessed by one-way analysis of variance, Kruskal-Wallis H test, or chi-square test, and subse- quent comparisons were performed by the Bonferroni test. The incidence rate of T2DM was presented as 1,000 person-years.
Kaplan-Meier curves were conducted to estimate the cumula- tive incidence of T2DM and log-rank test was performed to an- alyze the difference between the four groups. Cox proportional hazards model was used to calculate the hazard ratios (HR) and
95% CI values for the incidence of T2DM according to baseline body size phenotype and metabolically unhealthy exposure:
model 1 was unadjusted; model 2 was adjusted for age and sex;
model 3 was adjusted for age, sex, smoking, alcohol consump- tion, regular exercise, and family history of T2DM; model 4 was adjusted for age, sex, smoking, alcohol consumption, regu- lar exercise, family history of T2DM, and mean FPG level, that mean average level of baseline and follow-up FPG values. Sen- sitivity analyses were also performed in order to exclude sub- jects with an FPG ≥100 mg/dL from the first to last health ex- amination, or to exclude subjects with cancer (ICD-10 codes C00-C97) either at or before follow-up. Furthermore, adjusted HRs and 95% CIs for the T2DM incidence rate in subjects with unstable MHNW and unstable MHO were compared to those with stable MHNW (reference group) and stable MHO (refer-
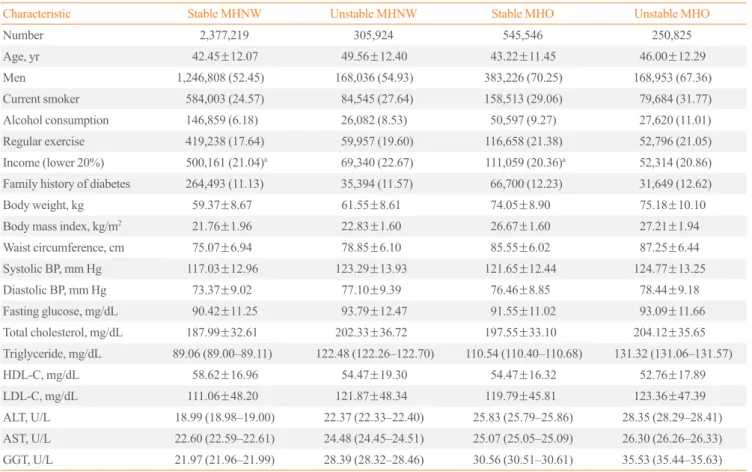
Table 1. Baseline Characteristics of Subjects According to Body Phenotype and Metabolic Stability
Characteristic Stable MHNW Unstable MHNW Stable MHO Unstable MHO
Number 2,377,219 305,924 545,546 250,825
Age, yr 42.45±12.07 49.56±12.40 43.22±11.45 46.00±12.29
Men 1,246,808 (52.45) 168,036 (54.93) 383,226 (70.25) 168,953 (67.36)
Current smoker 584,003 (24.57) 84,545 (27.64) 158,513 (29.06) 79,684 (31.77)
Alcohol consumption 146,859 (6.18) 26,082 (8.53) 50,597 (9.27) 27,620 (11.01)
Regular exercise 419,238 (17.64) 59,957 (19.60) 116,658 (21.38) 52,796 (21.05)
Income (lower 20%) 500,161 (21.04)a 69,340 (22.67) 111,059 (20.36)a 52,314 (20.86)
Family history of diabetes 264,493 (11.13) 35,394 (11.57) 66,700 (12.23) 31,649 (12.62)
Body weight, kg 59.37±8.67 61.55±8.61 74.05±8.90 75.18±10.10
Body mass index, kg/m2 21.76±1.96 22.83±1.60 26.67±1.60 27.21±1.94
Waist circumference, cm 75.07±6.94 78.85±6.10 85.55±6.02 87.25±6.44
Systolic BP, mm Hg 117.03±12.96 123.29±13.93 121.65±12.44 124.77±13.25
Diastolic BP, mm Hg 73.37±9.02 77.10±9.39 76.46±8.85 78.44±9.18
Fasting glucose, mg/dL 90.42±11.25 93.79±12.47 91.55±11.02 93.09±11.66
Total cholesterol, mg/dL 187.99±32.61 202.33±36.72 197.55±33.10 204.12±35.65
Triglyceride, mg/dL 89.06 (89.00–89.11) 122.48 (122.26–122.70) 110.54 (110.40–110.68) 131.32 (131.06–131.57)
HDL-C, mg/dL 58.62±16.96 54.47±19.30 54.47±16.32 52.76±17.89
LDL-C, mg/dL 111.06±48.20 121.87±48.34 119.79±45.81 123.36±47.39
ALT, U/L 18.99 (18.98–19.00) 22.37 (22.33–22.40) 25.83 (25.79–25.86) 28.35 (28.29–28.41) AST, U/L 22.60 (22.59–22.61) 24.48 (24.45–24.51) 25.07 (25.05–25.09) 26.30 (26.26–26.33) GGT, U/L 21.97 (21.96–21.99) 28.39 (28.32–28.46) 30.56 (30.51–30.61) 35.53 (35.44–35.63) Values are expressed as mean±standard deviation, number (%), or median (interquartile range). There were significant differences between the four groups in all of the baseline characteristic parameters (P<0.001).
MHNW, metabolically healthy normal weight; MHO, metabolically healthy obese; BP, blood pressure; HDL-C, high density lipoprotein cholesterol;
LDL-C, low density lipoprotein cholesterol; ALT, alanine aminotransferase; AST, aspartate aminotransferase; GGT, gamma-glutamyl transferase.
aThe results of post hoc analysis between the four groups were statistically significant in all of the baseline charatetristics with the exception of low in- come status (stable MHNW vs. unstable MHO, P=0.194).
ence group) in subgroups classified by age (<65 years vs. ≥65 years), sex, and weight changes between two health check-ups (weight loss <–5%, –5%≤ weight stable <5%, weight gain ≥ 5%), respectively. The stratified analysis and interaction testing were conducted using a likelihood ratio test to assess the poten- tial effect modification by the factors determining the sub- groups. Statistical analyses were performed using SAS version 9.4 (SAS Institute Inc., Cary, NC, USA), and P<0.05 were con- sidered as statistically significant.
RESULTS
Baseline characteristics of the study population
The characteristics of the subjects according to baseline body size phenotype and existence with change into a metabolic un- healthy profile during the 4-year follow-up period are presented in Table 1. In total 3,479,514 subjects aged over 20 years were enrolled; 2,377,219 (68.3%), 305,924 (8.8%), 545,546 (15.7%), and 250,825 (7.2%) subjects were categorized into the stable MHNW, unstable MHNW, stable MHO, and unstable MHO groups, respectively. The percentage of those that acquired met- abolically unhealthy phenotype after 4 years was 11.1% in the MHNW group and 31.5% in the MHO group. According to body size phenotype, the proportion of smoking, alcohol con- sumption, regular exercise, and family history of diabetes, aspar- tate aminotransferase (AST), alanine aminotransferase (ALT), gamma-glutamyl transferase (GGT) levels were higher in pa- tients with obesity than those with normal weight. Aspects of metabolic change, the unstable group showed a higher preva- lence of smoking, alcohol consumption, and family history of diabetes and higher blood pressure, fasting glucose, total cho- lesterol, triglyceride, low density lipoprotein cholesterol, AST, ALT, and GGT levels than the stable group in both in obese and normal weight subjects. There were significant differences be- tween the four groups in all of the baseline characteristic param- eters, with the exception of low-income status (stable MHNW vs. unstable MHO, P=0.194).
Risk of incident T2DM according to body size phenotype and metabolic stability
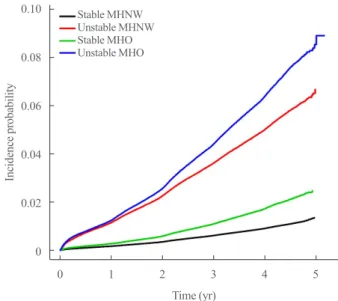
During the 13,502,376 person-years, a total of 61,350 subjects developed T2DM. Fig. 2 demonstrates the Kaplan-Meyer curves for the cumulative incidence of T2DM for each group.
Subjects in the unstable MHO group had the highest probability of developing T2DM, and the probabilities decreased consecu- tively for the unstable MHNW, stable MHO, and stable MHNW
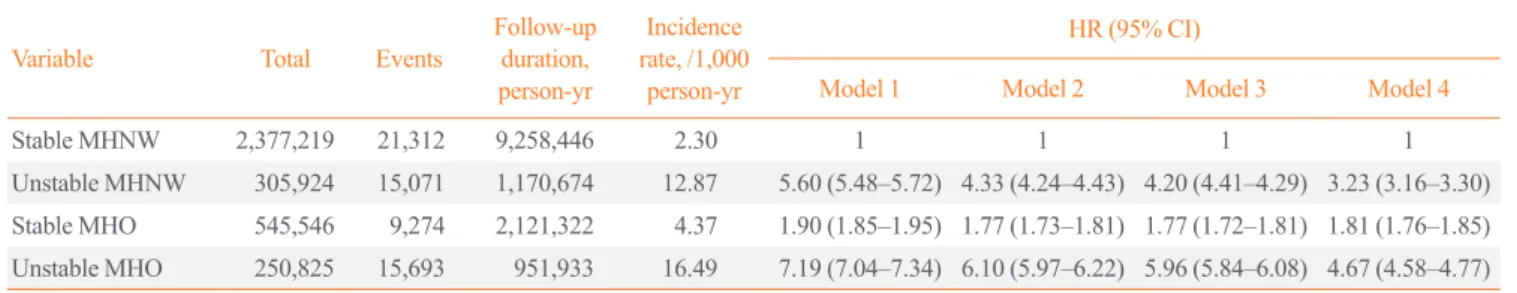
groups (log rank test, P<0.001). The incidence rate (number of events per 1,000 person-years) of T2DM was 2.3 in the stable MHNW group, 12.9 in the unstable MHNW group, 4.4 in the stable MHO group, and 16.5 in the unstable MHO group (Table 2). The adjusted HR for the incidence of T2DM was 1.81 (95%
CI, 1.76 to 1.85), 3.23 (95% CI, 3.16 to 3.30), and 4.67 (95%
CI, 4.58 to 4.77) in the stable MHO, unstable MHNW, and un- stable MHO groups respectively, when compared to the stable MHNW group after adjustment for age, sex, smoking, alcohol consumption, regular exercise, family history of T2DM, and mean FPG (Table 2). The association between metabolic stabili- ty, body size phenotype, and the development of T2DM was not significantly different after excluding subjects with an FPG ≥ 100 mg/dL (Supplemental Table S1) or previous history of any cancer (Supplemental Table S2).
Subgroup analysis
We performed stratified analysis and interaction testing to ana- lyze the effect of the transition into a metabolically unhealthy phenotype on the incidence of T2DM according to age, sex, and weight change (Fig. 3, Supplemental Table S3). We evaluated the HR for the incidence of T2DM in the metabolically unstable group compared to the metabolically stable healthy group in the normal weight and obesity groups, respectively. The effect of the metabolic change on T2DM was more obvious in the nor- mal weight group (HR, 3.11; 95% CI, 3.04 to 3.17) than the obesity group (HR, 2.68; 95% CI, 2.61 to 2.76). Furthermore,
0.10 0.08 0.06 0.04 0.02 0
Incidence probability
Time (yr)
0 1 2 3 4 5
Fig. 2. Cumulative incidence of type 2 diabetes according to body phenotype and metabolic stability. MHNW, metabolically healthy normal weight; MHO, metabolically healthy obese.
Stable MHNW Unstable MHNW Stable MHO Unstable MHO
the effect of a metabolically unhealthy status on the risk of T2DM was pronounced in individuals aged <65 years, women, and individuals with weight gain in both normal weight and obese groups (Fig. 3). With regards to the aspect of weight change, increased HR was most profound in individuals with weight gain, followed by individuals with stable weight and those with weight loss (P for interaction <0.001).
DISCUSSION
In this study, the proportion of subjects that developed metaboli-
cally unhealthy phenotype after a 4-year follow-up was 11.1%
in the MHNW group and 31.5% in the MHO group. Transition into a metabolically unhealthy phenotype significantly in- creased the risk of T2DM both in obese and normal weight groups. The unstable MHO group exhibited the highest risk of T2DM after adjusting for other confounding factors. Interest- ingly, the unstable MHNW group had a higher risk of T2DM than the stable MHO group, although the stable MHO subjects also showed an increase in the risk of T2DM.
The unique subgroup of obesity, MHO subjects exhibit a healthy metabolic profile and have reduced CVD risk factors.
Fig. 3. Hazard ratio (HR) and 95% confidence interval (CI) for the incidence of diabetes according to body weight change in the subjects with unstable metabolically healthy normal weight (MHNW) versus stable MHNW and in the subjects with unstable metabolically healthy obese (MHO) versus stable MHO. The reference group contains subjects who remained metabolically healthy over a 4-year follow-up, sta- ble MHNW and stable MHO.
Table 2. HR (95% CI) for the Incidence of Type 2 Diabetes According to Body Size Phenotype and Metabolic Stability Variable Total Events Follow-up
duration, person-yr
Incidence rate, /1,000
person-yr
HR (95% CI)
Model 1 Model 2 Model 3 Model 4
Stable MHNW 2,377,219 21,312 9,258,446 2.30 1 1 1 1
Unstable MHNW 305,924 15,071 1,170,674 12.87 5.60 (5.48–5.72) 4.33 (4.24–4.43) 4.20 (4.41–4.29) 3.23 (3.16–3.30) Stable MHO 545,546 9,274 2,121,322 4.37 1.90 (1.85–1.95) 1.77 (1.73–1.81) 1.77 (1.72–1.81) 1.81 (1.76–1.85) Unstable MHO 250,825 15,693 951,933 16.49 7.19 (7.04–7.34) 6.10 (5.97–6.22) 5.96 (5.84–6.08) 4.67 (4.58–4.77) Model 1: not adjusted; Model 2: adjusted for age and sex; Model 3: adjusted for model 2 plus smoking, alcohol consumption, regular exercise, and fami- ly history of type 2 diabetes; Model 4: adjusted for model 3 plus mean fasting plasma glucose.
HR, hazard ratio; CI, confidence interval; MHNW, metabolically healthy normal weight; MHO, metabolically healthy obese.
Recent longitudinal studies have demonstrated that the MHO phenotype is not a completely benign condition. In a meta-anal- ysis including 13 follow-up studies, MHO subjects had higher risk of CVD events than MHNW subjects (pooled RR, 1.45;
95% CI, 1.99 to 2.69) [17] and with respect to T2DM, individu- als with MHO had a substantially increased risk of T2DM than MHNW subjects (RR, 4.03; 95% CI, 2.66 to 6.09) [18]. Nowa- days, MHO is regarded as a dynamic condition that should be taken into account over time, and the rate of a metabolically un- healthy transition in MHO subjects was increased with the length of follow-up period. In the Whitehall II cohort study dur- ing the 20-year period, of a total of 66 MHO adults, 21 (31.8%), 27 (40.9%), and 34 (51.5%) participants transitioned to meta- bolically unhealthy obesity (MUO) after 5, 10, and 20 years, re- spectively [19]. Baseline BMI contributes such a change into metabolically unhealthy profiles. Mongraw-Chaffin et al. [10]
demonstrated that the cumulative exposure of obesity could in- crease in cardiometabolic risk. In the present study, stable MHO subjects also had a higher risk of T2DM compared to stable MHNW subjects during the follow-up period, suggesting that obesity itself could increase the risk of T2DM. Therefore, weight reduction in all obese individuals is important for the prevention of T2DM, even in subjects who are metabolically healthy.
Although obesity significantly increases the risk of T2DM, existence with metabolic unhealthiness was a much stronger predictor for incident T2DM than obesity itself. In the present study, the unstable MHO subjects exhibited the highest in- creased risk for T2DM, while the unstable MHNW subjects also had a higher risk for T2DM than the stable MHO subjects. Pre- viously, Navarro-Gonzalez et al. [20] showed that, among MHO subjects, a greater risk of diabetes was only found in those who progressed to an unhealthier status over time. Furthermore, Liu et al. [21] showed no significant differences in the risk of T2DM between different subjects with different BMI categories with the same number of metabolic abnormalities. A previous meta- analysis, including eight studies, all metabolic unhealthy groups demonstrated a similarly heightened risk of CVD in normal weight (RR, 3.14; 95% CI, 2.36 to 3.93), overweight (RR, 2.70;
95% CI, 2.08 to 3.30), and obese (RR, 2.65; 95% CI, 2.18 to 3.12) groups [22]. These results together with those of the cur- rent study suggest that metabolically unhealthiness is more criti- cal to the development of T2DM than obesity, not only in obese but also in normal weighted subjects [23]. In contrast to the conflicting results regarding the MHO phenotype, MUNW indi- viduals had a definite increased risk of cardiometabolic diseases
compared to MHNW individuals. We previously reported that the MUNW group had more severe carotid atherosclerosis and a greater risk of death from CVD than the MUO group [24,25].
Such a high risk in MUNW individuals is considered to be caused by an unfavorable body fat distribution [26], and the in- flammation of visceral adipose tissue and ectopic fat deposition are known to mediate metabolic disturbances regardless of gen- eralized obesity [13]. Asians especially have a relatively sub- stantial portion of visceral adipose tissue and ectopic fat deposi- tion compared to other ethnic populations with similar BMIs, thereby they are especially prone to cardiometabolic diseases in a normal range of weight [27,28]. In our study, the RR of T2DM in unstable MHNW subjects compared to stable MHNW sub- jects (HR, 3.11; 95% CI, 3.04 to 3.47) was greater than that of unstable MHO subjects compared to stable MHO subjects (HR, 2.68; 95% CI, 2.61 to 2.76); this suggests that the influence of the transition to a metabolically unhealthy phenotype on T2DM incidence was more profound in the MHNW group than the MHO group. Hence, in a clinical setting, it is important to focus on individuals with MUNW to make proper intervention to re- duce cardiometabolic disorders such as life style modification [29].
In the subgroup analysis, the detrimental effect of the transi- tion to a metabolically unhealthy status on the incidence of T2DM was more prominent in individuals aged <65 years, women, and subjects with weight gain. Similarly to this result, Kim et al. [30] showed that the long term risk of MHO for the development of T2DM was more prominent in younger patients (aged <45 years), and in the ATTICA cohort study, MHO status was an independent CVD risk factor only in women [31]. Al- though the underlying mechanism, that can explain the vulnera- bility to metabolic risk especially in young adults or women, could not be clarified in the present study, obesity might act as a primary risk for cardiometabolic disorders in women and young adults, whereas additional competing risk factors, such as sarco- penia, low cardio-respiratory fitness, and smoking may play a role in men or elderly individuals [32]. On the other hand, in the unstable MHNW and MHO groups, there was a significantly increased risk for T2DM even in individuals with weight loss;
however, the risk considerably increased in subjects with weight gain during the follow-up period (P for interaction among groups showing different weight changes <0.001). These re- sults emphasize the importance of continued weight control, es- pecially before the manifestation of metabolic unhealthy pro- files.
The current study had a number of limitations. First, because
of the inevitable limitation of our population based cohort study, the definition of T2DM was only based on claim data or the FPG level. Due to the lack of hemoglobin A1c value and the re- sults of the oral glucose tolerance test, the actual prevalence of T2DM may be different from that described in the current study.
Second, considering that the criteria of obesity in Asia are dif- ferent to that of Western countries, these results should be fur- ther validated in order to be able to generalize these findings to other ethnic groups. Despite these limitations, this study is the first of its kind to analyze the impact of dynamic transition of metabolic health status on the incidence of T2DM both in obese and normal weight individuals using a large-scale nationwide database that is standardized and validated by the Korean gov- ernment.
In this nationwide population-based longitudinal cohort study, we found that MHO and MHNW phenotypes were a very tran- sient concept, and that the change into metabolic unhealthiness was an important risk factor for the development of T2DM both in obese and normal weight subjects. Furthermore, although obesity has the potential to increase the risk of T2DM, the tran- sition into a metabolically unhealthy phenotype was a more sig- nificant risk factor. Therefore, primary prevention including continuous inhibition from metabolic risk as well as weight management is crucial for reducing the risk of T2DM.
CONFLICTS OF INTEREST
No potential conflict of interest relevant to this article was re- ported.
ACKNOWLEDGMENTS
This work was performed in cooperation with the National Health Insurance Service (NHIS). The National Health Infor- mation Database constructed by the NHIS was used, and the re- sults do not necessarily represent the opinion of the National Health Insurance Corporation.
AUTHOR CONTRIBUTION
Conception or design: S.M.K., N.H.K., K.H., H.J.Y. Acquisi- tion, analysis, or interpretation of data: J.A.K., D.H.K., Y.G.P., K.H., H.J.Y. Drafting the work or revising: J.A.K., S.H.B., K.M.C., H.J.Y. Final approval of the manuscript: K.H., H.J.Y.
ORCID
Jung A Kim https://orcid.org/0000-0002-6595-6551 Kyungdo Han https://orcid.org/0000-0002-6096-1263 Hye Jin Yoo https://orcid.org/0000-0003-0600-0266
REFERENCES
1. Ranasinghe P, Mathangasinghe Y, Jayawardena R, Hills AP, Misra A. Prevalence and trends of metabolic syndrome among adults in the Asia-Pacific region: a systematic re- view. BMC Public Health 2017;17:101.
2. Iacobini C, Pugliese G, Blasetti Fantauzzi C, Federici M, Menini S. Metabolically healthy versus metabolically un- healthy obesity. Metabolism 2019;92:51-60.
3. Hinnouho GM, Czernichow S, Dugravot A, Nabi H, Brun- ner EJ, Kivimaki M, et al. Metabolically healthy obesity and the risk of cardiovascular disease and type 2 diabetes: the Whitehall II cohort study. Eur Heart J 2015;36:551-9.
4. Aung K, Lorenzo C, Hinojosa MA, Haffner SM. Risk of de- veloping diabetes and cardiovascular disease in metaboli- cally unhealthy normal-weight and metabolically healthy obese individuals. J Clin Endocrinol Metab 2014;99:462-8.
5. Lassale C, Tzoulaki I, Moons KGM, Sweeting M, Boer J, Johnson L, et al. Separate and combined associations of obe- sity and metabolic health with coronary heart disease: a pan- European case-cohort analysis. Eur Heart J 2018;39:397- 406.
6. Wang B, Zhang M, Wang S, Wang C, Wang J, Li L, et al.
Dynamic status of metabolically healthy overweight/obesity and metabolically unhealthy and normal weight and the risk of type 2 diabetes mellitus: a cohort study of a rural adult Chinese population. Obes Res Clin Pract 2018;12:61-71.
7. Lavie CJ, Laddu D, Arena R, Ortega FB, Alpert MA, Kush- ner RF. Reprint of: healthy weight and obesity prevention:
JACC health promotion series. J Am Coll Cardiol 2018;72(23 Pt B):3027-52.
8. Soriguer F, Gutierrez-Repiso C, Rubio-Martin E, Garcia- Fuentes E, Almaraz MC, Colomo N, et al. Metabolically healthy but obese, a matter of time?: findings from the pro- spective Pizarra study. J Clin Endocrinol Metab 2013;98:
2318-25.
9. Eckel N, Li Y, Kuxhaus O, Stefan N, Hu FB, Schulze MB.
Transition from metabolic healthy to unhealthy phenotypes and association with cardiovascular disease risk across BMI categories in 90 257 women (the Nurses’ Health Study): 30
year follow-up from a prospective cohort study. Lancet Dia- betes Endocrinol 2018;6:714-24.
10. Mongraw-Chaffin M, Foster MC, Anderson CAM, Burke
GL, Haq N, Kalyani RR, et al. Metabolically healthy obesi- ty, transition to metabolic syndrome, and cardiovascular risk. J Am Coll Cardiol 2018;71:1857-65.
11. Roberson LL, Aneni EC, Maziak W, Agatston A, Feldman T, Rouseff M, et al. Beyond BMI: the “Metabolically healthy obese” phenotype & its association with clinical/subclinical cardiovascular disease and all-cause mortality: a systematic review. BMC Public Health 2014;14:14.
12. Meigs JB, Wilson PW, Fox CS, Vasan RS, Nathan DM, Sul- livan LM, et al. Body mass index, metabolic syndrome, and risk of type 2 diabetes or cardiovascular disease. J Clin En- docrinol Metab 2006;91:2906-12.
13. Bluher M. The distinction of metabolically ‘healthy’ from
‘unhealthy’ obese individuals. Curr Opin Lipidol 2010;21:38- 43.
14. Lee YH, Han K, Ko SH, Ko KS, Lee KU; Taskforce Team of Diabetes Fact Sheet of the Korean Diabetes Association.
Data analytic process of a nationwide population-based study using national health information database established by National Health Insurance Service. Diabetes Metab J 2016;
40:79-82.
15. Oh SW. Obesity and metabolic syndrome in Korea. Diabe- tes Metab J 2011;35:561-6.
16. World Health Organization. The Asia-Pacific perspective:
redefining obesity and its treatment. Sydney: Health Com- munications Australia; 2000. p. 55.
17. Eckel N, Meidtner K, Kalle-Uhlmann T, Stefan N, Schulze MB. Metabolically healthy obesity and cardiovascular events: a systematic review and meta-analysis. Eur J Prev Cardiol 2016;23:956-66.
18. Bell JA, Kivimaki M, Hamer M. Metabolically healthy obe- sity and risk of incident type 2 diabetes: a meta-analysis of prospective cohort studies. Obes Rev 2014;15:504-15.
19. Bell JA, Hamer M, Sabia S, Singh-Manoux A, Batty GD, Kivimaki M. The natural course of healthy obesity over 20 years. J Am Coll Cardiol 2015;65:101-2.
20. Navarro-Gonzalez D, Sanchez-Inigo L, Fernandez-Montero A, Pastrana-Delgado J, Alfredo Martinez J. Are all metaboli- cally healthy individuals with obesity at the same risk of di- abetes onset? Obesity (Silver Spring) 2016;24:2615-23.
21. Liu M, Tang R, Wang J, He Y. Distribution of metabolic/
obese phenotypes and association with diabetes: 5 years’ co- hort based on 22,276 elderly. Endocrine 2018;62:107-15.
22. Kramer CK, Zinman B, Retnakaran R. Are metabolically healthy overweight and obesity benign conditions?: a system- atic review and meta-analysis. Ann Intern Med 2013;159:
758-69.
23. Chan JC, Malik V, Jia W, Kadowaki T, Yajnik CS, Yoon KH, et al. Diabetes in Asia: epidemiology, risk factors, and patho- physiology. JAMA 2009;301:2129-40.
24. Choi KM, Cho HJ, Choi HY, Yang SJ, Yoo HJ, Seo JA, et al. Higher mortality in metabolically obese normal-weight people than in metabolically healthy obese subjects in elder- ly Koreans. Clin Endocrinol (Oxf) 2013;79:364-70.
25. Yoo HJ, Hwang SY, Hong HC, Choi HY, Seo JA, Kim SG, et al. Association of metabolically abnormal but normal weight (MANW) and metabolically healthy but obese (MHO) individuals with arterial stiffness and carotid athero- sclerosis. Atherosclerosis 2014;234:218-23.
26. Badoud F, Perreault M, Zulyniak MA, Mutch DM. Molecu- lar insights into the role of white adipose tissue in metaboli- cally unhealthy normal weight and metabolically healthy obese individuals. FASEB J 2015;29:748-58.
27. Eastwood SV, Tillin T, Dehbi HM, Wright A, Forouhi NG, Godsland I, et al. Ethnic differences in associations between fat deposition and incident diabetes and underlying mecha- nisms: the SABRE study. Obesity (Silver Spring) 2015;23:
699-706.
28. Rhee EJ. Being metabolically healthy, the most responsible factor for vascular health. Diabetes Metab J 2018;42:19-25.
29. Hermans MP, Amoussou-Guenou KD, Bouenizabila E, Sa- dikot SS, Ahn SA, Rousseau MF. The normal-weight type 2 diabetes phenotype revisited. Diabetes Metab Syndr 2016;
10(2 Suppl 1):S82-8.
30. Kim NH, Seo JA, Cho H, Seo JH, Yu JH, Yoo HJ, et al. Risk of the development of diabetes and cardiovascular disease in metabolically healthy obese people: the Korean Genome and Epidemiology Study. Medicine (Baltimore) 2016;95:e3384.
31. Kouvari M, Panagiotakos DB, Yannakoulia M, Georgouso- poulou E, Critselis E, Chrysohoou C, et al. Transition from metabolically benign to metabolically unhealthy obesity and 10-year cardiovascular disease incidence: the ATTICA co- hort study. Metabolism 2019;93:18-24.
32. Kim HK, Lee MJ, Kim EH, Bae SJ, Choe J, Kim CH, et al.
Longitudinal changes of body composition phenotypes and their association with incident type 2 diabetes mellitus during a 5-year follow-up in Koreans. Diabetes Metab J 2019;43:
627-39.