D I A B E T E S & M E T A B O L I S M J O U R N A L
This is an Open Access article distributed under the terms of the Creative Commons Attribution Non-Commercial License (http://creativecommons.org/licenses/by-nc/4.0/) which permits unrestricted non-commercial use, distribution, and reproduction in any medium, provided the original work is properly cited.
Association of Thigh Muscle Mass with Insulin
Resistance and Incident Type 2 Diabetes Mellitus in Japanese Americans
Seung Jin Han1,2, Edward J. Boyko2,3, Soo-Kyung Kim4, Wilfred Y. Fujimoto3, Steven E. Kahn3,5, Donna L. Leonetti6
1Department of Endocrinology and Metabolism, Ajou University School of Medicine, Suwon, Korea,
2Seattle Epidemiologic Research and Information Center, VA Puget Sound Health Care System, Seattle, WA,
3Department of Medicine, University of Washington School of Medicine, Seattle, WA, USA,
4Department of Internal Medicine, CHA Bundang Medical Center, CHA University School of Medicine, Seongnam, Korea,
5Hospital and Specialty Medicine Service, VA Puget Sound Health Care System, Seattle, WA,
6Department of Anthropology, University of Washington, Seattle, WA, USA
Background: Skeletal muscle plays a major role in glucose metabolism. We investigated the association between thigh muscle mass, insulin resistance, and incident type 2 diabetes mellitus (T2DM) risk. In addition, we examined the role of body mass index (BMI) as a potential effect modifier in this association.
Methods: This prospective study included 399 Japanese Americans without diabetes (mean age 51.6 years) who at baseline had an estimation of thigh muscle mass by computed tomography and at baseline and after 10 years of follow-up a 75-g oral glucose tolerance test and determination of homeostasis model assessment of insulin resistance (HOMA-IR). We fit regression models to examine the association between thigh muscle area and incidence of T2DM and change in HOMA-IR, both measured over 10 years.
Results: Thigh muscle area was inversely associated with future HOMA-IR after adjustment for age, sex, BMI, HOMA-IR, fasting plasma glucose, total abdominal fat area, and thigh subcutaneous fat area at baseline (P=0.033). The 10-year cumulative incidence of T2DM was 22.1%. A statistically significant interaction between thigh muscle area and BMI was observed, i.e., greater thigh muscle area was associated with lower risk of incident T2DM for subjects at lower levels of BMI, but this association diminished at higher BMI levels.
Conclusion: Thigh muscle mass area was inversely associated with future insulin resistance. Greater thigh muscle area predicts a lower risk of incident T2DM for leaner Japanese Americans.
Keywords: Body mass index; Diabetes mellitus; Insulin resistance; Muscle, skeletal; Thigh
Corresponding author: Seung Jin Han https://orcid.org/0000-0003-4783-6799 Department of Endocrinology and Metabolism, Ajou University School of Medicine, 164 World cup-ro, Yeongtong-gu, Suwon 16499, Korea
E-mail: [email protected]
INTRODUCTION
Type 2 diabetes mellitus (T2DM) is one of the most common metabolic disorders in the world, increasing in prevalence with age [1]. Muscle mass gradually decreases with age after the fourth decade of life, even if body weight or body fat mass is unchanged or slightly increased [2]. Skeletal muscle is a major
site for glucose uptake and deposition, and hence plays an im- portant role in the regulation of blood glucose levels [3]. There- fore, low muscle mass may affect the development of insulin resistance and T2DM.
Although a few cross-sectional studies support an inverse association between muscle mass and insulin resistance or T2DM prevalence [4-6], other studies have failed to show this https://doi.org/10.4093/dmj.2018.0022
pISSN 2233-6079 · eISSN 2233-6087
[7-9]. In a recent cross-sectional study, thigh muscle area di- rectly measured by computed tomography (CT) was negatively associated with T2DM in South Asians but not Europeans, sug- gesting the possibility of ethnic differences in this relationship [8]. To our knowledge, no longitudinal research exists on the association between thigh muscle area and change in insulin resistance.
There are three prospective investigations that have exam- ined the association between muscle mass and incident T2DM with conflicting results. First, overall muscle mass measured by dual-energy X-ray absorptiometry was not a risk factor for in- cident T2DM in an Australian community-dwelling cohort of men with 5-year follow-up in the Men Androgen Inflamma- tion Lifestyle Environment and Stress study [10]. In the Health ABC study of white and black participants ages 70 to 79 years, no association was observed between abdominal and thigh muscle area measured by CT and incident T2DM [11]. How- ever, there was a significant interaction with body mass index (BMI) for muscle mass in women, so that greater abdominal but not thigh muscle area predicted lower risk of incident T2DM for normal-weight women only, whereas higher thigh muscle mass was associated with greater risk of incident T2DM for overweight/obese women in adjusted models. On the contrary, Son et al. [12] reported low overall muscle mass was associated with a higher risk of T2DM in Korean adults using bioelectri- cal impedance for muscle measurement. These previous pro- spective studies have limitations, such as inclusion of male or elderly participants only, self-reported diagnosis of diabetes, and use of bioelectrical impedance, the accuracy of which can be affected by hydration status, age, medical conditions affect- ing fluid and electrolyte balance, and other factors [13].
The aim of this study was therefore to investigate the associa- tion of thigh muscle mass measured by CT imaging with insu- lin sensitivity and incident T2DM over a 10-year follow-up in a Japanese American cohort of men and women. We also ex- amined whether generalized adiposity as reflected by BMI mod- ifies the association between thigh muscle mass and incident T2DM.
METHODS
Study subjects
The study received approval from the University of Washing- ton Human Subjects Division and all subjects provided written informed consent (Institutional Review Board number: 34469).
Study subjects were from the Japanese American Community Diabetes Study, a cohort of second- and third-generation Japa- nese Americans of 100% Japanese ancestry. Details of the se- lection and recruitment of the study subjects have been de- scribed previously [14]. Briefly, study participants were select- ed as volunteers from a community-wide comprehensive mail- ing list and telephone directory that included almost 95% of the Japanese American population in King County, WA, USA.
Participants had follow-up visits 10 to 11 years after the base- line study visit. Among 658 subjects in the original cohort, 166 were excluded because they had diabetes at baseline. Addition- ally, we excluded 12 subjects who did not have CT measure- ments of thigh muscle at baseline and 81 subjects who did not complete follow-up examinations. Thus, a total of 399 subjects without diabetes mellitus at baseline were available for analysis.
Clinical and laboratory examination
Personal medical history and lifestyle factors were determined using a standardized questionnaire. Family history of diabetes was considered positive if any first-degree relative had diabe- tes. Smoking status was divided into two categories (current smoker, former/never smoker). Moderate alcohol consump- tion was defined as intake of more than 6 g of ethanol per day [15]. Physical activity level was estimated by the Paffenbarger physical activity index questionnaire (usual kilocalories spent weekly) [16], and regular physical activity was defined as more than moderate intensity physical activity.
Blood samples were obtained after an overnight fast of at least 10 hours. Insulin sensitivity was estimated by homeostasis model assessment of insulin resistance (HOMA-IR) index cal- culated as [fasting serum insulin (μU/mL)×fasting serum glu- cose (mg/dL)]/405 [17] and the quantitative insulin sensitivity check index (QUICKI) [18]. Diabetes was diagnosed by 75-g oral glucose tolerance test (OGTT), fasting glucose level ≥126 mg/dL or 2-hour post-glucose load ≥200 mg/day, or by treat- ment with oral glucose-lowering agents or insulin [19].
A single (1-cm) CT scan slice was obtained of the left thigh at a level halfway between the greater trochanter and the supe- rior margin of the patella and the abdomen at the level of the umbilicus [20]. CT scans were analyzed using density contour software. Tissue with a density of –250 to –50 Hounsfield units (HU) was classified as adipose tissue [20]. Total thigh and thigh subcutaneous fat cross-sectional areas (cm2) were measured and thigh muscle mass was estimated by calculating the differ- ence between total thigh area and thigh subcutaneous fat area
because directly measured thigh muscle area was unavailable.
This proxy measure of thigh muscle area has been shown to be highly correlated with directly measured thigh muscle area in a validation study conducted in a Korean population (r=0.98;
95% confidence interval, 0.88 to 1.00) [21].
Statistical analysis
Continuous variables are expressed as mean±standard devia- tion, and categorical variables are expressed as numbers and percentages. The distribution of HOMA-IR was skewed and was therefore normalized using a logarithmic transformation for all analyses. An independent t-test was used to compare differences between means for continuous variables, and the chi-square test was used for categorical data. Multiple linear regression analysis was used to determine independent associ- ations between insulin sensitivity at 10 years in relation to base- line thigh muscle mass area. Logistic regression analyses were conducted to estimate the associations between thigh muscle mass area and incident T2DM while adjusting for covariates.
Interactions by BMI and sex with thigh muscle mass in rela- tion to incident T2DM was assessed by insertion of first-order interaction terms into the logistic model. The data were ana-
lyzed using IBM SPSS Statistics for Windows version 22.0 (IBM Co., Armonk, NY, USA) and Stata version 14.2 (StataCorp, College station, TX, USA). A two-sided P<0.05 was consid- ered to indicate statistical significance.
RESULTS
Baseline clinical characteristics
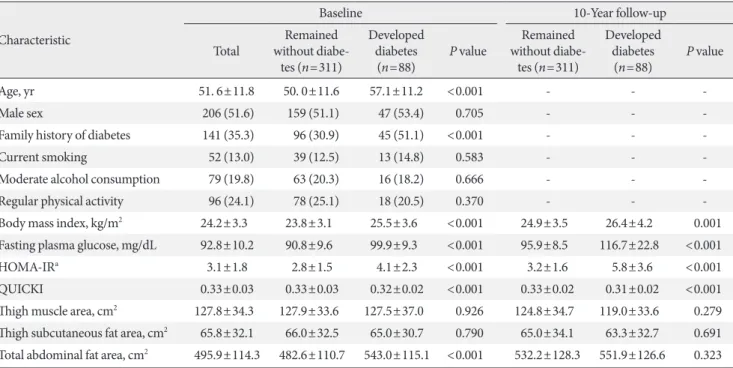
At baseline, study participants had a mean age of 51.6 years, 51.5% were men and they had a mean BMI of 24.2 kg/m2 (Ta- ble 1). Over a 10-year follow-up period, 88 of the 399 partici- pants (22.1%) developed T2DM. Those developing incident T2DM were older, had higher BMI, fasting plasma glucose, HOMA-IR, QUICKI, total abdominal fat area, and a higher prevalence of a family history of diabetes compared to those who remained nondiabetic.
The association between thigh muscle area and insulin resistance
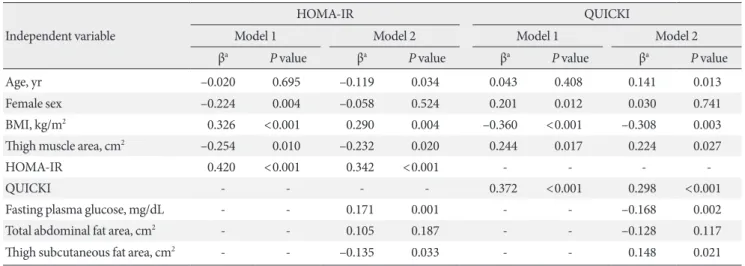
Table 2 lists the association of baseline thigh muscle area with HOMA-IR and QUICKI at 10-year follow-up. Thigh muscle area was inversely associated with future HOMA-IR after ad- Table 1. Clinical characteristics of study subjects by incident type 2 diabetes mellitus status at 10-year follow-up
Characteristic
Baseline 10-Year follow-up
Total Remained without diabe-
tes (n=311)
Developed diabetes
(n=88) P value Remained without diabe-
tes (n=311)
Developed diabetes
(n=88) P value
Age, yr 51. 6±11.8 50. 0±11.6 57.1±11.2 <0.001 - - -
Male sex 206 (51.6) 159 (51.1) 47 (53.4) 0.705 - - -
Family history of diabetes 141 (35.3) 96 (30.9) 45 (51.1) <0.001 - - -
Current smoking 52 (13.0) 39 (12.5) 13 (14.8) 0.583 - - -
Moderate alcohol consumption 79 (19.8) 63 (20.3) 16 (18.2) 0.666 - - -
Regular physical activity 96 (24.1) 78 (25.1) 18 (20.5) 0.370 - - -
Body mass index, kg/m2 24.2±3.3 23.8±3.1 25.5±3.6 <0.001 24.9±3.5 26.4±4.2 0.001
Fasting plasma glucose, mg/dL 92.8±10.2 90.8±9.6 99.9±9.3 <0.001 95.9±8.5 116.7±22.8 <0.001
HOMA-IRa 3.1±1.8 2.8±1.5 4.1±2.3 <0.001 3.2±1.6 5.8±3.6 <0.001
QUICKI 0.33±0.03 0.33±0.03 0.32±0.02 <0.001 0.33±0.02 0.31±0.02 <0.001
Thigh muscle area, cm2 127.8±34.3 127.9±33.6 127.5±37.0 0.926 124.8±34.7 119.0±33.6 0.279 Thigh subcutaneous fat area, cm2 65.8±32.1 66.0±32.5 65.0±30.7 0.790 65.0±34.1 63.3±32.7 0.691 Total abdominal fat area, cm2 495.9±114.3 482.6±110.7 543.0±115.1 <0.001 532.2±128.3 551.9±126.6 0.323 Values are presented as mean±standard deviation or number (%).
HOMA-IR, homeostasis model assessment of insulin resistance; QUICKI, quantitative insulin sensitivity check index.
aLog-transformed values were used for statistical comparisons. P values represent the difference between groups for each variable using inde- pendent t-tests and chi-square tests, as appropriate.
justment for age, sex, BMI, and baseline HOMA-IR (Model 1).
This association persisted after further adjustment for fasting plasma glucose, total abdominal fat area, and thigh subcutane- ous fat area (Model 2). In addition, thigh muscle area was in- dependently associated with QUICKI as another insulin sensi- tivity surrogate index.
The association between thigh muscle area and incident T2DM
When we investigated the association between thigh muscle
area and incident T2DM in multivariate logistic regression analysis, there was no significant association between thigh muscle area and incident T2DM after adjustment for age, sex, BMI, family history of diabetes, and HOMA-IR. However, when we examined an interaction between BMI and thigh muscle area using the first-order interaction terms inserted into the same logistic model, there was a significant positive interaction between BMI and estimated thigh muscle area (in- teraction term coefficient 0.003, P=0.022), with the coefficient for thigh muscle having a negative sign and being statistically Table 2. Multivariate linear regression analysis of the prediction of HOMA-IR and QUICKI at 10-year follow-up
Independent variable
HOMA-IR QUICKI
Model 1 Model 2 Model 1 Model 2
βa P value βa P value βa P value βa P value
Age, yr –0.020 0.695 –0.119 0.034 0.043 0.408 0.141 0.013
Female sex –0.224 0.004 –0.058 0.524 0.201 0.012 0.030 0.741
BMI, kg/m2 0.326 <0.001 0.290 0.004 –0.360 <0.001 –0.308 0.003
Thigh muscle area, cm2 –0.254 0.010 –0.232 0.020 0.244 0.017 0.224 0.027
HOMA-IR 0.420 <0.001 0.342 <0.001 - - - -
QUICKI - - - - 0.372 <0.001 0.298 <0.001
Fasting plasma glucose, mg/dL - - 0.171 0.001 - - –0.168 0.002
Total abdominal fat area, cm2 - - 0.105 0.187 - - –0.128 0.117
Thigh subcutaneous fat area, cm2 - - –0.135 0.033 - - 0.148 0.021
Model 1: adjusted for baseline traits (age, sex, BMI, thigh muscle area, and HOMA-IR); Model 2: model 1+fasting plasma glucose, total abdomi- nal fat area, and thigh subcutaneous fat area.
HOMA-IR, homeostasis model assessment of insulin resistance; QUICKI, quantitative insulin sensitivity check index; BMI, body mass index.
aData are expressed as standardized β.
Table 3. Multivariate logistic regression analysis of the prediction of incident type 2 diabetes mellitus at 10-year follow-up
Model 1 Model 2
Coefficient P value Coefficient P value
Age, yr 0.069 <0.001 0.041 0.021
Female sex –0.394 0.445 0.591 0.376
Family history of diabetes 0.848 0.002 0.800 0.006
HOMA-IR 0.333 <0.001 0.194 0.026
BMI, kg/m2 –0.289 0.064 –0.333 0.073
Thigh muscle area, cm2 –0.071 0.030 –0.075 0.029
BMI×thigh muscle area 0.003 0.018 0.003 0.018
Fasting plasma glucose, mg/dL - - 0.088 <0.001
Total abdominal fat area, cm2 - - 0.001 0.782
Thigh subcutaneous fat area, cm2 - - –0.005 0.425
Model 1: adjusted for baseline traits (age, sex, BMI, thigh muscle area, and HOMA-IR); Model 2: model 1+fasting plasma glucose, total abdomi- nal fat area, and thigh subcutaneous fat area.
HOMA-IR, homeostasis model assessment of insulin resistance; BMI, body mass index.
significant (–0.071; P=0.030) (Table 3, model 1). In addition, interaction between BMI and thigh muscle area remained sig- nificant after insertion of fasting plasma glucose, total abdomi- nal fat area, and thigh subcutaneous fat area as additional co- variates into the model of Table 3 (model 2). There was no sig- nificant interaction between sex and thigh muscle (interaction term coefficient, –0.024; P=0.159) when these interactions were inserted into the logistic model in Table 3.
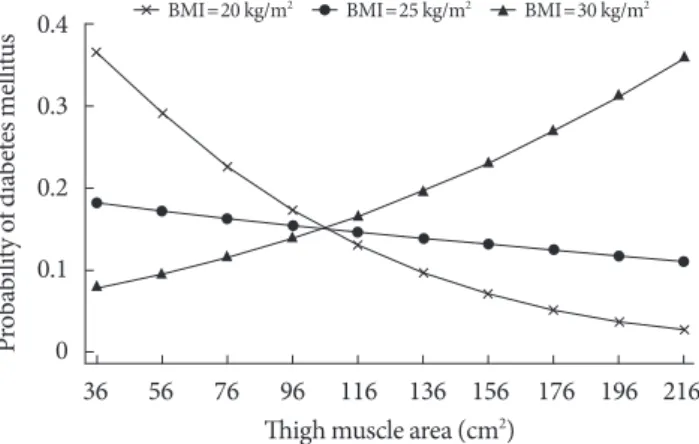
In Fig. 1, the calculated probability of incident T2DM from the logistic regression model from Table 3 that includes the thigh muscle×BMI interaction is shown across the range of thigh muscle area for three values of BMI, demonstrating that the protective effect exists for lower levels of BMI but disap- pears in the obese range (BMI=30 kg/m2).
DISCUSSION
These prospective data demonstrate that baseline thigh muscle mass area was inversely associated with future insulin resis- tance. We also observed an interaction between thigh muscle area and BMI in relation to T2DM. Namely, greater thigh mus- cle area was associated with lower risk of incident T2DM over 10 years for leaner subjects independent of age, sex, family his- tory of diabetes, HOMA-IR, fasting plasma glucose, total ab- dominal fat area, and thigh subcutaneous fat area at baseline.
We observed an inverse association between thigh muscle area and HOMA-IR change over 10 years that did not significantly
vary by BMI. Thus greater muscle area was associated with less insulin resistance after 10 years but not a lower risk of T2DM in the presence of greater general adiposity. The potential ben- efit of less insulin resistance in association with greater muscle area may be overridden by higher general adiposity with re- gard to future T2DM risk.
Previous studies reported that lower body muscle such as leg muscle was more associated with insulin resistance than was upper body muscle [22,23]. Furthermore, the rate of loss of lower limb muscle was more than twice the rate of loss of up- per limb muscle with aging [2,24,25]. Considering these char- acteristics and their large muscle content, preservation of leg muscles should be considered as a main target in the strategy to prevent insulin resistance and incident T2DM. However, there has been little prospective research on this topic.
We found that low thigh muscle area is independently asso- ciated with greater insulin resistance after 10 years in relatively healthy middle-aged and older Japanese Americans. To our knowledge, this is the first longitudinal study showing the long term association between thigh muscle mass and future insulin resistance. These findings support a previous cross-sectional study that demonstrated an inverse association between mus- cle mass and insulin resistance [4].
The association between baseline thigh muscle area and in- cident T2DM was modified by BMI in our cohort; that is, great- er thigh muscle area predicted lower risk of incident T2DM among leaner participants. The association between thigh mus- cle area and T2DM risk was diminished at higher levels of BMI.
Our findings thus support earlier findings from cross-sectional studies. Although measurement of lower limb circumferences is a simple method to reflect both leg muscle and fat mass, there was also a strong interaction between thigh circumference and obesity in relation to diabetes prevalence in a large-scale, cross- sectional study [26]. Smaller thigh circumference was associat- ed with diabetes, but this association was stronger among non- obese individuals. This study, though, could not convincingly demonstrate an association between thigh muscle and diabetes risk due to its cross-sectional design, which prevents ascertain- ment of temporal sequence, and also its measurement of thigh circumference which reflects a combination of thigh fat and muscle mass. In another cross-sectional study of postmeno- pausal women that also suggested an association between great- er muscle mass and lower T2DM prevalence, abdominal mus- cle area was inversely related with T2DM prevalence, especially for women with a BMI <25 kg/m2 [5].
Fig. 1. Adjusted marginal plots showing body mass index (BMI) interaction effects on the association between thigh muscle area and probability of 10-year incident type 2 diabetes mellitus. Probabilities of type 2 diabetes mellitus are shown for subjects with BMI 20, 25, 30 kg/m2 after adjusting for age, sex, family history of diabetes, and homeostasis model assessment of insulin resistance.
0.4 0.3 0.2 0.1 Probability of diabetes mellitus 0
36 56 76 96 116 136 156 176 196 216 Thigh muscle area (cm2)
BMI=20 kg/m2 BMI=25 kg/m2 BMI=30 kg/m2
To our knowledge the current study extends findings of the only other investigation that assessed risk of incident T2DM by regional muscle mass area using imaging (Health ABC Study), and which was conducted in an elderly Caucasian and African American population [10]. Ethnicity is an important determi- nant of body composition, with Asians known to have less muscle mass and more body fat compared to Western popula- tions at the same BMI [27]. These characteristics are related with a higher risk of insulin resistance and T2DM [28,29]. In addition, our population with a mean age of 51.6 years was rel- atively younger than those of the Health ABC Study, so our findings reflect the impact of a relatively higher range of mus- cle mass on the development of T2DM before advanced age- related sarcopenia. In addition, we used the OGTT along with a history of clinical diagnosis for identifying incident T2DM, and therefore were more likely to detect its occurrence as com- pared to the Health ABC Study that relied on fasting glucose and clinical history only [30].
We previously found that BMI acts as an effect modifier in the relationship between hand grip strength and incident T2DM in Japanese Americans, i.e., greater hand grip strength predicts a lower risk of incident T2DM among normal weight partici- pants [31]. Combining this finding in the same cohort with the finding from the current analysis demonstrating a lower risk of T2DM with greater thigh muscle area in normal weight partic- ipants, it appears that obesity modifies the associations between muscle mass or muscle strength and incident T2DM in a simi- lar pattern in our population. Based on these findings, we can assume that interventions aimed at increasing muscle mass and strength in lean individuals may be more effective to reduce the risk of T2DM than in overweight or obese individuals.
The underlying mechanism for the diminution of the inverse relationship between baseline thigh muscle area and T2DM risk at higher levels of BMI is not known. A possible reason is thigh muscle mass may have a relatively smaller impact on the devel- opment of T2DM in obese subjects due to preexisting metabolic imbalance caused by obesity. Therefore, the potential protective effects of greater muscle mass are overcome by much stronger effects of adiposity on T2DM risk. Our finding of a significant inverse association between thigh muscle area and future insu- lin resistance that did not vary by BMI further supports this theory, as this means that the potential mechanism for higher T2DM risk (i.e., greater insulin resistance) affects lean and non- lean similarly, and therefore must be overcome by other factors in the non-lean that prevent expression of this lower risk.
We noted that greater thigh subcutaneous fat area was asso- ciated with higher insulin sensitivity at 10 years. This finding might therefore be expected to result in lower risk of develop- ing T2DM. However, we did not identify an association be- tween thigh subcutaneous fat area and risk of T2DM in a pre- vious analysis of these same data [32].
As for the strengths of our study, study participants were from a well-designed community-based cohort with a long- term follow-up period. This prospective study design permit- ted assessment of thigh muscle area prior to the outcome as- sessment, thereby helping to establish temporal sequence not possible in cross-sectional research. Additional strengths in- clude use of imaging to measure muscle areas, and also our fo- cus on regional muscle as opposed the generalized lean mass.
There are several limitations to be considered in this study.
First, we estimated thigh muscle mass instead of directly mea- suring thigh muscle area using imaging. However, this method has been previously validated [21]. Second, we used HOMA- IR and QUICKI as a surrogate for insulin sensitivity. Although not the gold standard method, it is a frequently used tool for assessing insulin sensitivity in large population based studies [18,33]. Finally, as this study was restricted to middle-aged and older Japanese Americans, caution should be taken when gen- eralizing the results to other age or ethnic groups.
In conclusion, we found that thigh muscle area was inversely associated with future insulin resistance over 10 years in Japa- nese Americans. In addition, greater thigh muscle area was as- sociated with lower risk of incident T2DM for leaner subjects independent of insulin resistance. These results suggest an im- portant role for muscle mass in the development of T2DM that varies by degree of adiposity, and might lead to research to im- prove our understanding of the roles of both lean and non-lean body composition in the pathogenesis of hyperglycemia. Fur- ther intervention studies are needed to confirm whether in- creasing muscle mass can reduce the incidence of T2DM, and whether such effects vary according to BMI.
CONFLICTS OF INTEREST
No potential conflict of interest relevant to this article was re- ported.
ACKNOWLEDGMENTS
National Institutes of Health grants DK-31170 and HL-49293.
This work was supported by facilities and services provided by the Diabetes Research Center (DK-017047), Clinical Nutrition Research Unit (DK-035816), and the General Clinical Research Center (RR-000037) at the University of Washington. The fund- ing entities had no role in the conduct of this study or interpre- tation of its results.
We are grateful to the King County Japanese-American com- munity for support and cooperation. VA Puget Sound Health Care System provided support for Drs. Boyko and Kahn’s in- volvement in this research.
REFERENCES
1. Guariguata L, Whiting DR, Hambleton I, Beagley J, Linnen- kamp U, Shaw JE. Global estimates of diabetes prevalence for 2013 and projections for 2035. Diabetes Res Clin Pract 2014;
103:137-49.
2. Janssen I, Heymsfield SB, Wang ZM, Ross R. Skeletal muscle mass and distribution in 468 men and women aged 18-88 yr. J Appl Physiol (1985) 2000;89:81-8.
3. DeFronzo RA, Tripathy D. Skeletal muscle insulin resistance is the primary defect in type 2 diabetes. Diabetes Care 2009;32 Suppl 2:S157-63.
4. Srikanthan P, Karlamangla AS. Relative muscle mass is inverse- ly associated with insulin resistance and prediabetes. Findings from the third National Health and Nutrition Examination Survey. J Clin Endocrinol Metab 2011;96:2898-903.
5. Larsen BA, Allison MA, Laughlin GA, Araneta MR, Barrett- Connor E, Wooten WJ, Saad SD, Wassel CL. The association between abdominal muscle and type II diabetes across weight categories in diverse post-menopausal women. J Clin Endocri- nol Metab 2015;100:E105-9.
6. Atlantis E, Martin SA, Haren MT, Taylor AW, Wittert GA; Mem- bers of the Florey Adelaide Male Ageing Study. Inverse associa- tions between muscle mass, strength, and the metabolic syn- drome. Metabolism 2009;58:1013-22.
7. Volpato S, Bianchi L, Lauretani F, Lauretani F, Bandinelli S, Gu- ralnik JM, Zuliani G, Ferrucci L. Role of muscle mass and mus- cle quality in the association between diabetes and gait speed.
Diabetes Care 2012;35:1672-9.
8. Eastwood SV, Tillin T, Wright A, Mayet J, Godsland I, Forouhi NG, Whincup P, Hughes AD, Chaturvedi N. Thigh fat and mus- cle each contribute to excess cardiometabolic risk in South Asians, independent of visceral adipose tissue. Obesity (Silver Spring) 2014;22:2071-9.
9. Barzilay JI, Cotsonis GA, Walston J, Schwartz AV, Satterfield S, Miljkovic I, Harris TB; Health ABC Study. Insulin resistance is associated with decreased quadriceps muscle strength in non- diabetic adults aged >or=70 years. Diabetes Care 2009;32:736-8.
10. Li JJ, Wittert GA, Vincent A, Atlantis E, Shi Z, Appleton SL, Hill CL, Jenkins AJ, Januszewski AS, Adams RJ. Muscle grip strength predicts incident type 2 diabetes: population-based cohort study.
Metabolism 2016;65:883-92.
11. Larsen BA, Wassel CL, Kritchevsky SB, Strotmeyer ES, Criqui MH, Kanaya AM, Fried LF, Schwartz AV, Harris TB, Ix JH; Health ABC Study. Association of muscle mass, area, and strength with incident diabetes in older adults: The Health ABC Study. J Clin Endocrinol Metab 2016;101:1847-55.
12. Son JW, Lee SS, Kim SR, Yoo SJ, Cha BY, Son HY, Cho NH. Low muscle mass and risk of type 2 diabetes in middle-aged and old- er adults: findings from the KoGES. Diabetologia 2017;60:865- 72.
13. Dehghan M, Merchant AT. Is bioelectrical impedance accurate for use in large epidemiological studies? Nutr J 2008;7:26.
14. Fujimoto WY, Leonetti DL, Kinyoun JL, Newell-Morris L, Shu- man WP, Stolov WC, Wahl PW. Prevalence of diabetes mellitus and impaired glucose tolerance among second-generation Jap- anese-American men. Diabetes 1987;36:721-9.
15. Koppes LL, Dekker JM, Hendriks HF, Bouter LM, Heine RJ.
Moderate alcohol consumption lowers the risk of type 2 diabe- tes: a meta-analysis of prospective observational studies. Dia- betes Care 2005;28:719-25.
16. Paffenbarger RS Jr, Wing AL, Hyde RT. Physical activity as an index of heart attack risk in college alumni. Am J Epidemiol 1978;108:161-75.
17. Matthews DR, Hosker JP, Rudenski AS, Naylor BA, Treacher DF, Turner RC. Homeostasis model assessment: insulin resis- tance and beta-cell function from fasting plasma glucose and insulin concentrations in man. Diabetologia 1985;28:412-9.
18. Katz A, Nambi SS, Mather K, Baron AD, Follmann DA, Sulli- van G, Quon MJ. Quantitative insulin sensitivity check index: a simple, accurate method for assessing insulin sensitivity in hu- mans. J Clin Endocrinol Metab 2000;85:2402-10.
19. Report of the expert committee on the diagnosis and classifica- tion of diabetes mellitus. Diabetes Care 1997;20:1183-97.
20. Shuman WP, Morris LL, Leonetti DL, Wahl PW, Moceri VM, Moss AA, Fujimoto WY. Abnormal body fat distribution de- tected by computed tomography in diabetic men. Invest Radiol 1986;21:483-7.
21. Han SJ, Kim SK, Fujimoto WY, Kahn SE, Leonetti DL, Boyko
EJ. Effects of combination of change in visceral fat and thigh muscle mass on the development of type 2 diabetes. Diabetes Res Clin Pract 2017;134:131-8.
22. Olsen DB, Sacchetti M, Dela F, Ploug T, Saltin B. Glucose clear- ance is higher in arm than leg muscle in type 2 diabetes. J Physi- ol 2005;565(Pt 2):555-62.
23. Sacchetti M, Olsen DB, Saltin B, van Hall G. Heterogeneity in limb fatty acid kinetics in type 2 diabetes. Diabetologia 2005;
48:938-45.
24. Borkan GA, Hults DE, Gerzof SG, Robbins AH, Silbert CK.
Age changes in body composition revealed by computed to- mography. J Gerontol 1983;38:673-7.
25. Gallagher D, Visser M, De Meersman RE, Sepulveda D, Baum- gartner RN, Pierson RN, Harris T, Heymsfield SB. Appendicu- lar skeletal muscle mass: effects of age, gender, and ethnicity. J Appl Physiol (1985) 1997;83:229-39.
26. Jung KJ, Kimm H, Yun JE, Jee SH. Thigh circumference and diabetes: obesity as a potential effect modifier. J Epidemiol 2013;
23:329-36.
27. Nakagami T, Qiao Q, Carstensen B, Nhr-Hansen C, Hu G, Tu- omilehto J, Balkau B, Borch-Johnsen K; DECODE-DECODA Study Group. Age, body mass index and type 2 diabetes-asso- ciations modified by ethnicity. Diabetologia 2003;46:1063-70.
28. Kim TN, Park MS, Lim KI, Choi HY, Yang SJ, Yoo HJ, Kang HJ, Song W, Choi H, Baik SH, Choi DS, Choi KM. Relationships between sarcopenic obesity and insulin resistance, inflamma- tion, and vitamin D status: the Korean Sarcopenic Obesity Study.
Clin Endocrinol (Oxf) 2013;78:525-32.
29. Kim TN, Choi KM. The implications of sarcopenia and sarco- penic obesity on cardiometabolic disease. J Cell Biochem 2015;
116:1171-8.
30. Han SJ, Kim HJ, Kim DJ, Lee KW, Cho NH. Incidence and pre- dictors of type 2 diabetes among Koreans: a 12-year follow up of the Korean Genome and Epidemiology Study. Diabetes Res Clin Pract 2017;123:173-80.
31. Wander PL, Boyko EJ, Leonetti DL, McNeely MJ, Kahn SE, Fu- jimoto WY. Greater hand-grip strength predicts a lower risk of developing type 2 diabetes over 10 years in leaner Japanese Amer- icans. Diabetes Res Clin Pract 2011;92:261-4.
32. Hoyer D, Boyko EJ, McNeely MJ, Leonetti DL, Kahn SE, Fuji- moto WY. Subcutaneous thigh fat area is unrelated to risk of type 2 diabetes in a prospective study of Japanese Americans.
Diabetologia 2011;54:2795-800.
33. Wallace TM, Levy JC, Matthews DR. Use and abuse of HOMA modeling. Diabetes Care 2004;27:1487-95.