INTRODUCTION
Allergic rhinitis (AR) is one of the world’s most common chronic illnesses among children and young adults, and its prevalence is estimated to range from approximately 10% to 50%.1 Because its prevalence has risen markedly over the last few decades, there is concern regarding its economic impact compared to other chronic diseases.2
The rapid increase in prevalence may be due to lifestyle and environmental factors rather than genetic factors. In particular, changes in dietary patterns may play a role, including de- creased intake of fresh fruit, vegetables, and fish and increased intake of high-fat foods.3 These dietary changes and the related increase in allergic diseases may be associated with reduced in- take of the antioxidant vitamins C, E, and β-carotene. 4
Several epidemiological studies have investigated the effects of vitamin A (VA) on asthma, but the findings have been mixed.
For example, some studies have reported that dietary VA intake and VA concentrations in the serum are significantly lower in patients with asthma than in healthy control subjects or in pa- tients with severe asthma than in those with mild asthma.5-7
However, other studies have reported no such associations be- tween AR and VA.8,9
VA is composed of retinol and more than 600 carotenoids (e.g., β-carotene, β-cryptoxanthin, lutein-zeaxan-thin, and lyco- pene).10 Among these various forms of VA, all-trans retinoic acid (ATRA) is a biologically active metabolite of VA.11,12 VA and retinoic acid (RA) generally promote differentiation into Th2 cells and increase the ratio of Th2 cytokines relative to Th1 cy- tokines by reducing the Th1 response.13 Furthermore, RA sup- presses Th17 cells and induces regulatory T cells that are im- portant for maintaining immune homeostasis and preventing the induction of autoimmune T cells.13,14
However, the role of ATRA in AR after allergic challenge has not
Effect of Retinoic Acid in a Mouse Model of Allergic Rhinitis
Hye-Lim Son,
1Hyang-Rim Park,
2Yong-Jin Park,
1Soo-Whan Kim
2*
1Department of Otolaryngology-Head and Neck Surgery, St. Vincent’s Hospital, College of Medicine, The Catholic University of Korea, Suwon, Korea
2Department of Otolaryngology-Head and Neck Surgery, Seoul St. Mary’s Hospital, College of Medicine, The Catholic University of Korea, Seoul, Korea
This is an Open Access article distributed under the terms of the Creative Commons Attribution Non-Commercial License (http://creativecommons.org/licenses/by-nc/3.0/) which permits unrestricted non-commercial use, distribution, and reproduction in any medium, provided the original work is properly cited.
Purpose: All-trans retinoic acid (ATRA) modulates immune responses by affecting T cells. Several studies have revealed that allergic inflammation of the lower airways is negatively associated with the vitamin A concentration. However, the role of ATRA in allergic inflammation of the upper air- ways is unclear. We investigated the effects of ATRA in an allergic rhinitis mouse model. Methods: BALB/c mice except control groups (CON group) were sensitized with and challenged intra-nasally with Dermatophagoides farina (AR group). The ATRA groups were administered ATRA intraperito- neally. The steroid groups were administered steroid intranasally (ST group). Allergic symptoms and the average eosinophil number were counted.
Cytokines and transcription factors were measured by Real-Time PCR and Western blotting. Der f-specific immunoglobulin E (IgE) was measured.
Flow cytometry results of CD4+CD25+Foxp3+ T cells were analyzed. Results: The symptom scores were lower in the ATRA group than in the AR group and higher than in the CON group. The levels of IgE were lower in the ATRA group than in the AR group and higher than in the CON and ST groups. The levels of Foxp3, TGF-β, and IL-10 mRNA, as well as the percentage of CD4+CD25+Foxp3+ T cells, were higher in the ATRA group than in theAR group. In the ATRA group the levels of IFN-γ mRNA were higher, and the levels of GATA-3 and IL-4 mRNA, and ROR-γt were lower. In West- ern blotting analyses, the expression patterns of all factors, except Foxp3, showed similar to those of mRNA expression. Conclusions: ATRA has anti-allergic effects in an allergic rhinitis model, and its underlying mechanisms mainly include the induction of regulatory T cells and the inhibition of Th2 responses.
Key Words: Allergic rhinitis; all-trans retinoic acid; regulatory T cells; Th2 cells; Th17 cells
Correspondence to: Soo-Whan Kim, MD, PhD, Department of
Otolaryngology-Head and Neck Surgery, Seoul St. Mary’s Hospital, College of Medicine, The Catholic University of Korea, 222 Banpo-daero, Seocho-gu, Seoul 137-701, Korea.
Tel: +82-2-2258-6214; Fax: +82-2-535-1354; E-mail: kshent@catholic.ac.kr Received: August 21, 2014; Revised: January 28, 2015; Accepted: February 25, 2015
•There are no financial or other issues that might lead to conflict of interest.
Allergy Asthma Immunol Res. 2015 November;7(6):590-598.
http://dx.doi.org/10.4168/aair.2015.7.6.590 pISSN 2092-7355 • eISSN 2092-7363
been well investigated. In the present study, we investigated whether ATRA alters the T-cell response to modulate the severity of airway inflammation in a Der f-induced allergic mouse model.
MATERIALS AND METHODS Experimental animals
Forty 6-week-old, healthy female BALB/c mice (20-30 g) were used in the present study. The experiment was performed with the approval of the Institutional Animal Care and Use Commit- tee at the Catholic University of Korea.
Reagents
Dermatophagoides farinae (Der f) crude body extract (Arthro- pods of Medical Importance Resource Bank, College of Medi- cine, Yonsei University, Seoul, Korea) was used as the allergen.
It was solubilized and stored at -70°C, and dissolved in alumin- ium potassium sulfate (2 mg/mL for intraperitoneal injections).
ATRA (Sigma-Aldrich, St Louis, MO, USA) was stored at -20°C and protected from light until used. It was dissolved in soybean oil (3 mg/mL for intraperitoneal injections) prior to use.15,16 Sensitization, airway challenge, and treatment
For the allergy mouse model, we followed our previous labora- tory studies.17,18 Forty mice were sorted into 4 groups: the control (CON, n=10), Der f (AR, n=10), all-trans retinoic acid (ATRA, n=10), and steroid (ST, n=10) groups. Allergen sensitization and challenge for the development of the AR mouse model are summarized in Fig. 1. Briefly, on days 1 and 8, all mice except those in the control group were immunized by intraperitoneal injection of 100 µg of Der f dissolved in 80 µL of aluminum po- tassium sulfate for sensitization. These mice were challenged in- tranasally with 20 µg of Der f in a volume of 20 µL of PBS for 7 consecutive days until the day prior to the end of the experi- ment. The control group received phosphate-buffered saline in- tranasally instead of Der f. Mice in the ATRA group received in- traperitoneal injections of 500 µg of ATRA. ATRA were adminis- tered intraperitoneally every other day until the day prior to the end of the experiment as follows: days 0, 2, 4, 6, 8, 10, 12, 14, 16,
18, and 20.15,16 The mice in the CON, AR, and ST groups were in- jected with the same volume of soybean oil. The ST group re- ceived 20 of µg ciclesonide intranasally on days 18, 19, and 20.
Evaluation of allergic symptoms induced after allergen challenge The numbers of sneezing and nose-rubbing motions during the 15-min period after the last allergen challenge were record- ed and compared between the experimental groups by observ- ers blinded to the experimental groups.19
Nasal mucosal tissue evaluation
Four mice each of the 4 groups were sacrificed and decapitat- ed 24 hours after the last allergen challenge. The heads were fixed in 4% paraformaldehyde for 3 days at 4°C, washed in run- ning water, decalcified for 3 days with Calci-Clear Rapid (Na- tional Diagnostics, Atlanta, GA, USA) at room temperature, de- hydrated by passage through a graded alcohol series, and em- bedded in paraffin block. The blocks were cut into 4-µm-thick sections and stained with hematoxylin and eosin to evaluate the general morphology and number of eosinophils in the lam- ina propria of the nasal mucosa. The average number of cells was counted in 4 areas around the nasal septa in 50×50-µm ar- eas under a light microscope (×200). The individual who counted eosinophils was blinded to the animals’ group assign- ments.
Measurement of the Der f-specific level of immunoglobulin E in the serum
The Levels of Der f-specific immunoglobulin E (IgE) in the se- rum were measured using an enzyme-linked immunosorbent assay kit (ELISA; Bethyl, Montgomery, TX, USA) and samples were collected 24 hours after the last Der f challenge.
Cytokines and transcription factors in nasal mucosal tissue Six mice each of the 4 groups were sacrificed to evaluate aller- gic reactions. Using cytokines of nasal mucosal tissue, interfer- on (IFN)-γ for the T helper 1 (Th1) immune reaction, interleu- kin (IL)-4 for the T helper 2 (Th2) immune reaction, interleukin (IL)-17 for the T helper 17 (Th17) immune reaction, and inter- leukin (IL)-10 and TGF-β for the regulatory T cell immune reac- tion were measured by real-time polymerase chain reaction (PCR). Simultaneously, the relative mRNA expression of the transcription factors T-bet, GATA-3, ROR-γt, and Foxp3 was measured by real-time PCR.
Total RNA was extracted from nasal mucosal tissue using the TRIzol reagent (Invitrogen, Carlsbad, CA, USA), and the first strand was reverse-transcribed using random primers (TaKaRa, Otsu, Japan). The oligonucleotide primer sequences used were as follows (listed as forward primer, reverse primer): IFN-γ:
5´-AGAGCCAGATTATCTCTTTCTACCTCAG-3´, 5´-CCTTTTT CGCCTTGCTGTTG-3´; IL-4: 5´-TCAACCCCCAGCTAGTT- GTC-3´, 5´-AAATATGCGAAGCACCTTGG-3´; IL-17: 5´-TTTA- Fig. 1. Schematic representation of the experimental allergic rhinitis model and
treatment protocol. Der f, Dermatophagoides farinae; IN, intranasal administra- tion; IP, intraperitoneal administration; ATRA, all-trans retinoic acid; ST, steroid (cicleosonide). Units are days.
ACTCCCTTGGCGCAAAA-3´, 5´-CTTTCCCTCCGCATTGA CAC-3´; IL-10: 5´-ATGCTGCCTGCTCTTACTGACTG-3´, 5´- CCCAAGTAACCCTTATCCTGC-3´; TGF-β: 5´-CACCATCCAT- GACATGAACC-3´, 5´-TCATGTTGGACAACTGCTCC-3´; T-bet:
5´-GCCAGGGAACCGCTTATA-3´, 5´-CCTTGTTGTTGGTGA GCTTTA-3´; GATA-3: 5´-CTGGATGGCGGCAAAGC-3´, 5´- GTGGGCGGGAAGGTGAA-3´; ROR-γt: 5´-ACCTCCACTGC- CAGCTGTGTGCTGTC-3´, 5´-TCATTTCTGCACTTCTGCATG- TAGACTGTCCC-3´; Foxp3: 5´-GAAAGCGGATACCAAATGA-3´, 5´-CTGTGAGGACTACCGAGCC-3´; glyceraldehyde 3-phos- phate dehydrogenase (GAPDH): 5´-GCACAGTCAAGGCC- GAGAAT-3´, 5´-GCCTTCTCCATGGTGGTGAA-3´. The levels of mRNA expression of IFN-γ, IL-4, IL-17, IL-10, TGF-β, T-bet, GATA-3, ROR-γt, Foxp3, and GAPDH were determined by real- time PCR using the ABIPRISM 7300 Real-Time PCR System (Applied Biosystems, Foster City, CA, USA) and SYBR Green PCR master mix (TaKaRa). Their levels of expression were ana- lyzed using the ABI 7300 Sequence Detection System (Applied Biosystems). The results were normalized relative to GAPDH expression and shown as the absolute level of mRNA expres- sion in cytokine factors and the fold increase over the expres- sion of the control group in transcriptional factors.20
Western Blotting
Western blot analysis was used to detect the relative protein expression patterns of transcription factors (T-bet, GATA-3, ROR-γt, and Foxp3) and cytokines (IFN-γ, IL-4, IL-17, IL-10, and TGF-β) within the nasal mucosa of the CON, AR, ATRA, and ST groups. The results were based on a grade of grayscale (Santa Cruz Biotechnology, Dallas, TX, USA).
Flow cytometry
For cell-surface staining, aliquots of 106 splenic mononuclear
cells were incubated with fluorescein isothiocyanate (FITC)- conjugated anti-mouse CD4 (GK1.5) antibody (eBiosicence, San Diego, CA, USA). For intracellular staining, cells stained with CD4 were incubated with a fixation/permeabilization working solution, and Fc receptors were blocked with excess mouse Fc block. Then the cells were stained with phycoerythrin (PE)-Cy5- conjugated anti-mouse Foxp3 (FJK-16s) and allophycocyanin (APC)-CD25 antibody (eBioscience). CD4+CD25+Foxp3+ T cells were analyzed by flow cytometry (FACS Calibur flow cytometer;
Becton Dickinson, San Jose, CA, USA).
Statistical analysis
All measured parameters are expressed as median value (low- er quartile, upper quartile). Differences among the groups were analyzed using the Kruskal-Wallis test (PASW Statistics 18; SPSS Inc., Chicago, IL, USA). In all analyses, a P value of less than 0.05 was deemed to indicate statistical significance.
RESULTS
Evaluation of allergic symptoms induced after allergen challenge
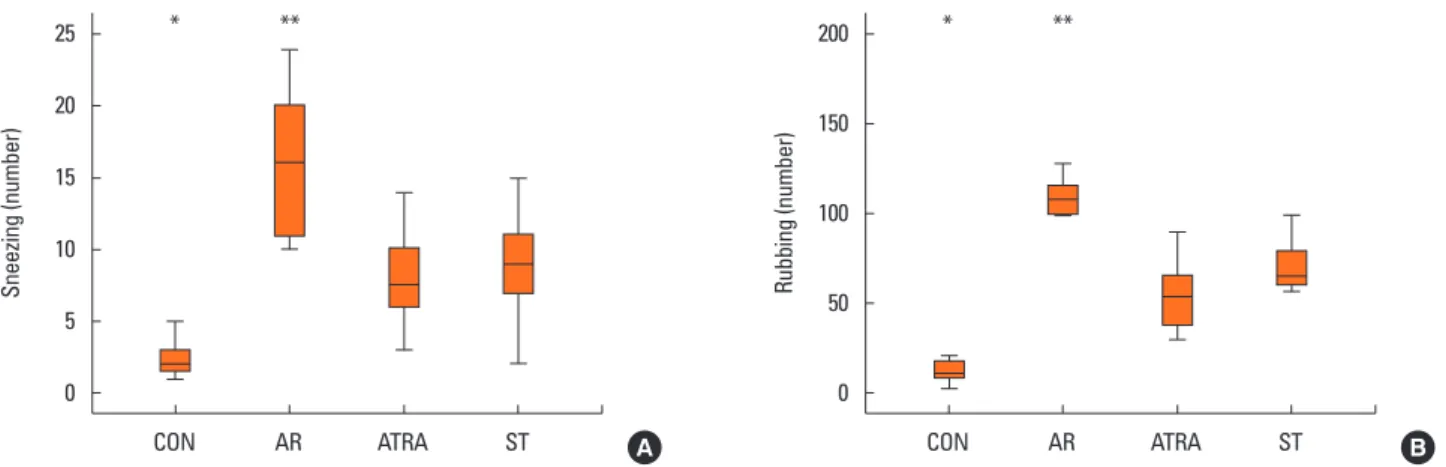
We investigated the number of sneezing and nose-rubbing motions during the 15-minute period after the last allergen challenge. The number of sneezing motion was 2 (1.75, 3) in the CON group, 16 (11.25, 19.75) in the AR group, 7.5 (6.25, 9.75) in the ATRA group, and 9 (7, 11) in the ST group. The number of nasal rubbing motion was 10.5 (8.75, 16) in the CON group, 108.5 (101.25, 114.75) in the AR group, 54 (38.5, 63.75) in the ATRA group, and 65 (60, 76) in the ST group. The number of sneezing motion was significantly lower in the CON group than in the ATRA group (P=0.003, Fig. 2A), whereas the number of sneezing motion was significantly higher in the AR group than
Sneezing (number) Rubbing (number)
CON AR ATRA ST CON AR ATRA ST
25
20
15
10
5
0
200
150
100
50
0
A B
* ** * **
Fig. 2. Nasal symptom score. Sneezing (A) and nose-rubbing motions (B) of the CON (n=10), AR (n=10), ATRA (n=10), and ST (n=10) groups were measured for a 15-minute period. Results are expressed as absolute number of sneezing and nose-rubbing motions. Box and whiskers plot show median and interquartile range.
The number of sneezing motion was significantly higher in the AR group than in the ATRA group. The number of nasal rubbing motion was higher in the AR group than in the ATRA group. Control group; CON, Dermatophagoides farina group; AR, all-trans retinoic acid group; ATRA, steroid group; ST. *P<0.05, ATRA vs CON;
**P<0.05, ATRA vs AR according to Kruskal-Wallis tests.
in the ATRA group (P=0.001, Fig. 2A). The number of nasal rubbing motion was also lower in the CON group than in the ATRA group (P=0.003, Fig. 2B), whereas it was higher in the AR group than in the ATRA group (P=0.001, Fig. 2B).
Nasal mucosal tissue evaluation
Fig. 3A shows eosinophil infiltration in the lamina propria.
Black arrows indicate infiltration of eosinophils in the lamina propria. Fig. 3B shows eosinophil numbers. The number of eo- sinophils were 36.5/2,500 µm2 (34.25, 38.75) in the CON group, 173/2,500 µm2 (161.5, 185.25) in the AR group, 70/2,500 µm2 (65, 72) in the ATRA group, and 76/2,500 µm2 (69.5, 81) in the ST group. The eosinophil count was significantly higher in the AR group than in the ATRA group (P=0.030, Fig. 3B), whereas no difference was noted between the ATRA and ST groups (P=1, Fig. 3B).
Level of Der f-specific IgE in the serum
The level of Der f-specific IgE in the serum was significantly higher in the AR group (3.95 ng/mL [3.79, 4.15], P<0.001; Fig. 4) and the ST group (2.25 ng/mL [2.15, 2.42], P=0.001; Fig. 4) than in the ATRA group (1.61 ng/mL [1.44, 1.71], Fig. 4).
Real-Time PCR and Western blot analyses
The mRNA expression levels of cytokines (IFN-γ, IL-4, IL-17, IL-10, and TGF-β) and the relative mRNA expression levels of transcription factors (T-bet, GATA-3, ROR-γt, and Foxp3) were measured by real-time PCR. Concurrently, the protein expres- sion patterns of the cytokines and transcription factors were evaluated by Western blotting.
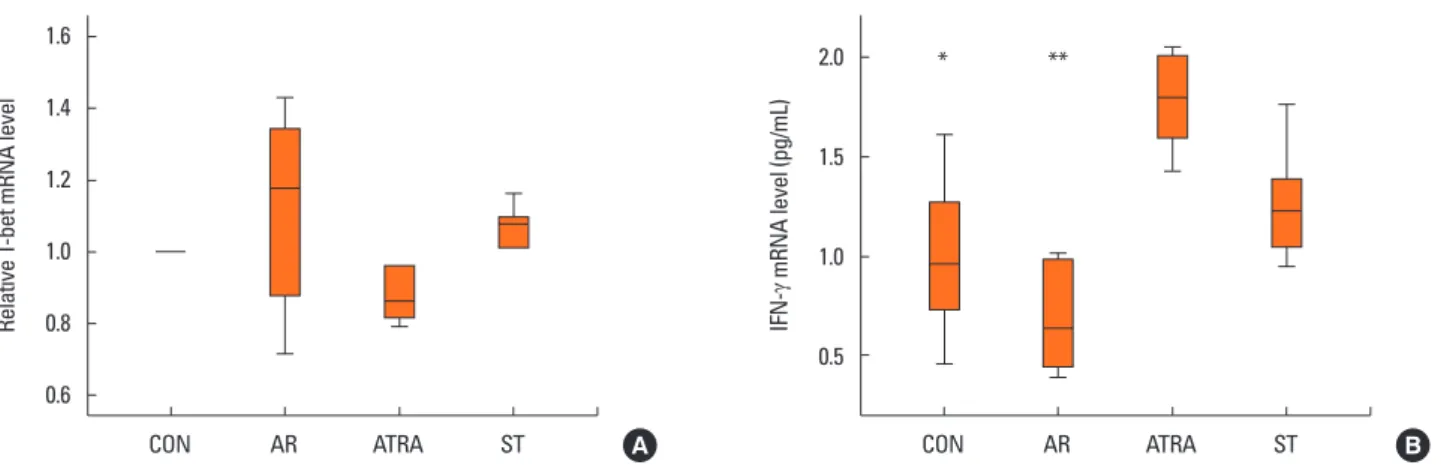
In the Th1 response, the relative level of mRNA of the tran-
scription factor T-bet showed no significant difference between the groups (Fig. 5A). The expression level of IFN-γ mRNA was significantly lower in the AR groups than in the ATRA group (P<0.001, Fig. 5B). However, the level was not significantly dif- ferent between the ATRA and ST groups (P=0.367; Fig. 5B).
In the Th2 response, the relative level of GATA-3 mRNA was significantly higher in the AR group than in the ATRA group (P<0.001, Fig. 6A); however, no significant difference in the rela- tive GATA-3 mRNA level was found between the ATRA and ST groups (P=0.664; Fig. 6A). The expression level of IL-4 mRNA was also significantly higher in the AR group than in the ATRA group (P=0.031, Fig. 6B); however, the levels were not signifi-
Eosinophil count (number)
CON AR ATRA ST 200
150
100
50
B
**
Fig. 3. Infiltration of eosinophils (cell/2,500 µm3) into the nasal mucosa of BALB/c mice (A) (a) CON (n=4), (b) AR (n=4), (c) ATRA (n=4), and (d) ST (n=4). (Hematox- ylin and eosin staining; original magnification, ×200). Black arrows indicate infiltration of eosinophils. (B) Eosinophil counts in the nasal mucosa in 50 µm ×50 µm area under a light microscope (×200). The eosinophil count was significantly higher in the AR group than in the ATRA group Other abbreviations as in Fig. 2. Box and whiskers plot show median and interquartile range. **P<0.05, ATRA vs AR.
A
Serum Derf-specific IgE (ng/mL)
CON AR ATRA ST 6
5 4 3 2 1 0
** ***
Fig. 4. Serum levels of Dermatophagoides farinae-specific immunoglobulin E.
The level of Der f-specific IgE in the serum was higher in the AR group and ST groups than in the ATRA group. Other abbreviations as in Fig. 2. Box and whis- kers plot show median and interquartile range. **P<0.05, ATRA vs AR;
***P<0.05, ATRA vs ST.
cantly different between the ATRA and the ST groups (P=1; Fig.
6B).
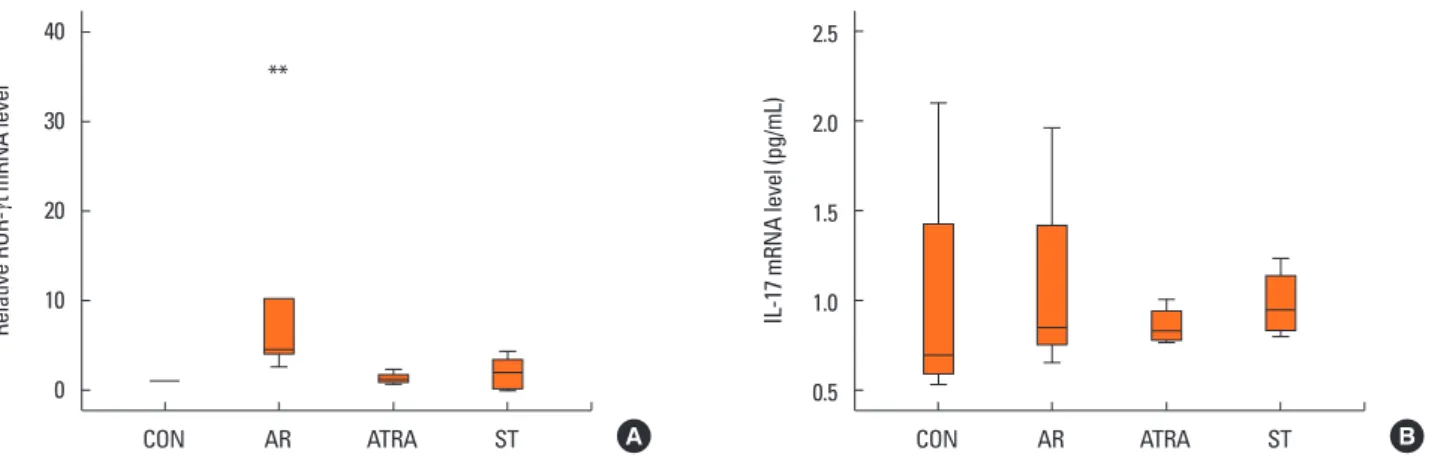
In the Th17 response, the relative level of ROR-γt mRNA was significantly higher in the AR group than in the other groups (CON, P=0.027; ATRA, P=0.046; ST, P=0.049; Fig. 7A); no sig- nificant difference was found between the ATRA and-the ST groups (P=1; Fig. 7A). In addition, the level of IL-17 mRNA showed no significant difference between the groups (Fig. 7B).
For the regulatory T (Treg) cell response, we evaluated the mRNA expression levels of Foxp3, IL-10, and TGF-β. The rela- tive expression levels of Foxp3 were significantly lower in the AR group than in the ATRA group (P=0.028; Fig. 8A), but no significant difference was found between the other groups. The expression level of IL-10 mRNA was also significantly lower in the AR group than in the ATRA group (P<0.001, Fig. 8B), with no significant differences between the ATRA and the ST groups
(P=1.00; Fig. 8B). The level of TGF-β was significantly lower in the AR group than in the ATRA group (P=0.005; Fig. 8C), whereas the other groups showed no significant differences be- tween them (CON, P=0.109; ST, P=0.077; Fig. 8C).
We used Western blotting to double check the express pat- terns of the above cytokines and transcription factors, which were found to be similar to those observed for the mRNA ex- pression levels (Fig. 9). Because we did not performed quanti- fied examination, we check the general grayscale patterns of each factor. The expression patterns of Foxp3 in the-ST group were different from the mRNA expression level of PCR.
Flow cytometric analysis of CD4+CD25+Foxp3+ T cells from splenic mononuclear cells
Mononuclear cells were sorted on the basis of the expression levels of Foxp3 and CD25 and whether they expressed CD4 (Fig.
Relative GATA-3 mRNA level IL-4 mRNA level (pg/mL)
CON AR ATRA ST CON AR ATRA ST
1.3 1.2 1.1 1.0 0.9 0.8 0.7
3.0 2.5 2.0 1.5 1.0 0.5 0
A B
*
**
**
Relative T-bet mRNA level IFN-
γ mRNA level (pg/mL)
CON AR ATRA ST CON AR ATRA ST
1.6
1.4
1.2
1.0
0.8
0.6
2.0
1.5
1.0
0.5
A B
* **
Fig. 5. Quantitative analysis of the cytokine levels by real-time PCR from the nasal mucosa of CON (n=6), AR (n=6), ATRA (n=6), and ST (n=6) group in the Th1 re- sponse: (A) relative mRNA level of T-bet, (B) expression level of interferon-γ mRNA. The results were normalized relative to GAPDH expression. The expression level of IFN-γ mRNA was lower in the AR groups than in the ATRA group. Other abbreviations as in Fig. 2. Box and whiskers plot show median and interquartile range.
*P<0.05, ATRA vs CON; **P<0.05, ATRA vs AR.
Fig. 6. Quantitative analysis of the cytokine levels by Real-Time PCR from the nasal mucosa of CON (n=6), AR (n=6), ATRA (n=6), and ST (n=6) group in the Th2 re- sponse: (A) relative mRNA level of GATA-3, (B) expression level of interleukin-4 mRNA were measured by real time PCR. The results were normalized relative to GAPDH expression. In the Th2 response, the relative level of GATA-3 mRNA was higher in the AR group than in the ATRA group. The expression level of IL-4 mRNA was also higher in the AR group than in the ATRA group. Other abbreviations as in Fig. 2. Box and whiskers plot show median and interquartile range. *P<0.05, ATRA vs CON; **P<0.05, ATRA vs AR.
10A). CD4+CD25+Foxp3+ T cells accounted for 4.38% (4.01, 4.71) of all splenic mononuclear cells in the CON group, 2.39% (1.59, 4.80) in the AR group, 14.87% (11.69, 16.42) in the ATRA group, and 10.42% (5.54, 13.47) in the ST group. The ATRA and the ST groups had significantly higher percentages of these cells than the AR group (ATRA, P=0.001; ST, P=0.010; Fig. 10B).
DISCUSSION
AR is the sequential response of the immune system to exter- nal antigens or allergens. The allergic response includes im- mune cell sensitization, migration to tissues, survival, and reac- tivation, followed by the execution of immune-cell effector functions that lead to the establishment of chronic inflamma-
Relative ROR-
γt mRNA level
Relative Foxp3 mRNA levelTGF-
β mRNA level (pg/mL)
IL-17 mRNA level (pg/mL)IL-10 mRNA level (pg/mL)
CON AR ATRA ST
CON AR ATRA ST
CON AR ATRA ST
CON AR ATRA ST
CON AR ATRA ST 40
30
20
10
0
2
1.5
1
0.5
0
12 10 8 6 4 2 0
2.5
2.0
1.5
1.0
0.5
1.5
1.25
1
0.75
0.5 A
A
C
B
B
**
** **
**
Fig. 7. Quantitative analysis of the cytokine levels by real-time PCR from the nasal mucosa of CON (n=6), AR (n=6), ATRA (n=6), and ST (n=6) group in the Th17 re- sponse: (A) relative mRNA level of ROR-γt, (B) expression level of interleukin-17 mRNA were measured by real time PCR. The results were normalized relative to GAPDH expression. The relative level of ROR-γt mRNA was higher in the AR group than in the other groups. The level of IL-17 mRNA showed no significant differ- ence among the groups. Other abbreviations as in Fig. 2. Box and whiskers plot show median and interquartile range. **P<0.05, ATRA vs AR.
Fig. 8. Quantitative analysis of the cytokine levels in the nasal mucosa of CON (n=6), AR (n=6), ATRA (n=6), and ST (n=6) group in the regulatory T re- sponse: (A) relative mRNA level of Foxp3, (B) expression level of Interleukin-10 mRNA, and (C) expression level of TGF-β mRNA were measured by Real Time PCR. The results were normalized relative to GAPDH expression. The relative expression levels of Foxp3 were lower in the AR group than in the ATRA group.
The expression level of IL-10 mRNA was also lower in the AR group than in the ATRA group. The level of TGF-β was lower in the AR group than in the ATRA group. Other abbreviations as in Fig. 2. Box and whiskers plot show median and interquartile range. **P<0.05, ATRA vs AR.
CON
ATRA
AR
ST
tion.21 Healthy and allergic individuals exhibit the 3 allergen- specific T-cell subtypes―Th1, Th2, and Treg―in different pro- portions. A change in the dominant subset and the balance be- tween Th2 and Treg cells might lead to either allergy develop- ment or recovery.22
VA has been shown to modulate Th1/Th2 responses in vivo,11-13 and VA function is mediated by antigen-presenting cells through specific intracellular receptors (RAR and RXR) that are present in the immune cells.23,24 However, how RA influences Th1/Th2 development in naïve T cells remains unclear. ATRA binds well to RAR, but not to RXR.23,24 In previous experimental studies, animals or isolated naïve T cells treated with appropriate stim- uli in the presence of RA have generally expressed higher levels of Th2-associated genes and have produced higher amounts of Th2 cytokines, such as IL-4.23,25 Conversely, RA-treated immu- nized mice show downregulation of Th1 cytokines.26 Regarding Treg cells, RA is a critical factor that provides signals for their differentiation.27,28 Treg cell differentiation increases in the pres- ence of TGF-β and adequate amounts of RA. Furthermore, Foxp3 can directly bind to and inhibit the transcriptional activi- ty of RORα and RORγt through protein–protein interactions,29 aiding in the induction of Treg cells.
Epidemiologic studies have reported controversial results re- garding the effects of VA on allergic disease. Some studies showed that VA intake/VA concentrations in the serum are low- er in patients with asthma than in healthy controls and in pa-
tients with severe asthma than in those with less severe asth- ma,5,6 with the levels of β-carotene in the serum showing no dif- ference between the groups.6 one study reported consistent re- sults that serum β-carotene is significantly associated with a lower risk of prevalent asthma.30 Another found that the risk of childhood asthma was increased by lower serum levels of vita- min C and carotenoids, including α-carotene, β-carotene, and β-cryptoxanthin, and that low vitamin C and α-carotene levels continue to be predictive of asthma, whereas β-carotene is elim- inated from the model.31 In contrast, the Dutch MORGEN cross- sectional intervention study reported that dietary β-carotene in- take is not associated with the prevalence of symptoms but pos- itively associated with the forced expiratory volume in 1 second and forced vital capacity.32 A Korean epidemiologic study dem- Fig. 9. Effect of ATRA on cytokines and transcription factors measured by
Western blotting to confirm the protein express patterns of the cytokines and transcription factors. CON group (A, n=6), AR group (B, n=6), ATRA group (C, n=6), and ST group (D, n=6). The expression patterns of all factors, except Foxp3, showed similar patterns to that of mRNA expression. Other abbrevia- tions as in Fig. 2.
A B C D T-bet
IFN-γ GATA3 IL-4 ROR-γt IL-17 Foxp3 IL-10 TGF-β GAPDH
Fig. 10. Flow cytometric analysis of CD4+CD25+Foxp3+ T cell subsets. (A) Repre- sentative flurorescence-activated cell sorting analysis in CON (n=10), AR (n=10), ATRA (n=10), and ST (n=10) groups. (B) The percentage of splenic mononuclear cells that were CD4+CD25+Foxp3+ T cells. RU=upper right quad- rant, which represents CD4+CD25+Foxp3+ T cells. The ATRA and ST groups had significantly higher percentages of these cells than the AR group. Other abbre- viations as in Fig. 2. Box and whiskers plot show median and interquartile range. **P<0.05, ATRA vs AR, ♦P<0.05, ST vs AR.
A
The percentage of CD4+CD25+Foxp3+ (%)
CON AR ATRA ST 20
15
10
5
0
B
**
onstrated no association between AR and α-carotene or β-carotene.8 In that study, the sum of the measured carotenoids is reported to be significantly negatively associated with AR and not significantly associated with allergic sensitization.9 Another study reported no relationship between VA or retinol with or without supplements and the risk of asthma.33
In the present study, using an allergy mouse model, we de- signed 2 control groups: the AR group that received general sensitization and local challenge and the ST group that received the same sensitization and local challenge but received steroid treatment intranasally. In the preliminary study, we adminis- tered 500 µg of ATRA every other day according to the previous study.15 However, since the mice treated with 5,000 µg of ATRA showed having irritability and weight loss, we decided just to administer 500 µg of ATRA every other days in the present study.34 We demonstrated that the administration of ATRA modulated Der f-induced AR by decreasing the levels of Th2 cytokines (IL-4) and increasing Treg cytokines (IL-10, TGF-β).
ATRA mediated this response by inhibiting GATA-3 and ROR-γt expression and promoting Foxp3 expression. The same trend was noted regarding protein expression in Western blot analy- sis. In addition, using flow cytometry, we confirmed that the ex- pression of CD4+CD25+Foxp3+ T cells was higher in the ATRA group than in the AR group. Moreover, the tissue eosinophil counts and Der f-specific IgE levels were suppressed in the ATRA and ST groups. These data suggest that ATRA decreases the allergic response by inhibiting the activity of Th2 and acti- vating the Treg pathway.
Our study has some limitations. Since the role of TGF-β in al- lergic inflammatory upper airway disease remains highly con- troversial, this cytokine can stimulate cellular growth, differen- tiation, migration, and other cytokine production, but can also inhibit these processes. However, since TGF-β at least promotes the differentiation of Treg cells that is potentiated by RA, we ex- cluded proinflammatory effect of TGF-β. We cannot exclude the possibility of ATRA dose-dependent Treg cell expression, either.27 Further studies are needed to identify co-stimulation factors that influence the expression of Treg cells.
In conclusion, our results suggest that ATRA may have an an- ti-allergic effects in an AR model and that its mechanisms of ac- tion could mainly include the induction of Treg cells and the inhibition of Th2 responses.
ACKNOWLEDGMENTS
The work was supported by the Alumni Association of the De- partment of Otolaryngology-Head and Neck Surgery, College of Medicine, The Catholic University of Korea, and Basic Sci- ence Research Program through the National Research Foun- dation of Korea (NRF) funded by the Ministry of Education, Sci- ence, and Technology (2011-0026915).
REFERENCES
1. Bellanti JA, Wallerstedt DB. Allergic rhinitis update: Epidemiology and natural history. Allergy Asthma Proc 2000;21:367-70.
2. Worldwide variation in prevalence of symptoms of asthma, allergic rhinoconjunctivitis, and atopic eczema: ISAAC. The International Study of Asthma and Allergies in Childhood (ISAAC) Steering Committee. Lancet 1998;351:1225-32.
3. Seaton A, Godden DJ, Brown K. Increase in asthma: a more toxic environment or a more susceptible population? Thorax 1994;49:
171-4.
4. Patel S, Murray CS, Woodcock A, Simpson A, Custovic A. Dietary antioxidant intake, allergic sensitization and allergic diseases in young children. Allergy 2009;64:1766-72.
5. Allen S, Britton JR, Leonardi-Bee JA. Association between antioxi- dant vitamins and asthma outcome measures: systematic review and meta-analysis. Thorax 2009;64:610-9.
6. Al Senaidy AM. Serum vitamin A and beta-carotene levels in chil- dren with asthma. J Asthma 2009;46:699-702.
7. McGowan SE. Vitamin A deficiency increases airway resistance following C-fiber stimulation. Respir Physiol Neurobiol 2007;157:
281-9.
8. Seo JH, Kwon SO, Lee SY, Kim HY, Kwon JW, Kim BJ, et al. Associa- tion of antioxidants with allergic rhinitis in children from seoul. Al- lergy Asthma Immunol Res 2013;5:81-7.
9. Kompauer I, Heinrich J, Wolfram G, Linseisen J. Association of ca- rotenoids, tocopherols and vitamin C in plasma with allergic rhini- tis and allergic sensitisation in adults. Public Health Nutr 2006;9:
472-9.
10. Devereux G, Seaton A. Diet as a risk factor for atopy and asthma. J Allergy Clin Immunol 2005;115:1109-17.
11. Hall JA, Cannons JL, Grainger JR, Dos Santos LM, Hand TW, Naik S, et al. Essential role for retinoic acid in the promotion of CD4(+) T cell effector responses via retinoic acid receptor alpha. Immunity 2011;34:435-47.
12. Ertesvag A, Austenaa LM, Carlsen H, Blomhoff R, Blomhoff HK.
Retinoic acid inhibits in vivo interleukin-2 gene expression and T- cell activation in mice. Immunology 2009;126:514-22.
13. Ross AC. Vitamin A and retinoic acid in T cell-related immunity.
Am J Clin Nutr 2012;96:1166S-1172S.
14. Kimura A, Kishimoto T. IL-6: regulator of Treg/Th17 balance. Eur J Immunol 2010;40:1830-5.
15. Matheu V, Berggård K, Barrios Y, Barrios Y, Arnau MR, Zubeldia JM, et al. Impact on allergic immune response after treatment with vitamin A. Nutr Metab (Lond) 2009;6:44.
16. Matheu V, Bäck O, Mondoc E, Issazadeh-Navikas S. Dual effects of vitamin D-induced alteration of TH1/TH2 cytokine expression: en- hancing IgE production and decreasing airway eosinophilia in mu- rine allergic airway disease. J Allergy Clin Immunol 2003;112:585- 92.
17. Kim BY, Shin JH, Park HR, Kim SW, Kim SW. Comparison of antial- lergic effects of pneumococcal conjugate vaccine and pneumococ- cal polysaccharide vaccine in a murine model of allergic rhinitis.
Laryngoscope 2013;123:2371-7.
18. Shin JH, Kim BY, Park HR, Kim SW, Kim SW. The effect of pneumo- coccal polysaccharide vaccine in a mouse model of allergic rhini- tis. Otolaryngol Head Neck Surg 2013;148:383-90.
19. Wang W, Zhu Z, Zhu B, Ma Z. Peroxisome proliferator-activated re- ceptor-gamma agonist induces regulatory T cells in a murine mod-
el of allergic rhinitis. Otolaryngol Head Neck Surg 2011;144:506-13.
20. Gourley TS, Patel DR, Nickerson K, Hong SC, Chang CH. Aberrant expression of Fas ligand in mice deficient for the MHC class II transactivator. J Immunol 2002;168:4414-9.
21. Akdis M, Akdis CA. Therapeutic manipulation of immune toler- ance in allergic disease. Nat Rev Drug Discov 2009;8:645-60.
22. Akdis M, Verhagen J, Taylor A, Karamloo F, Karagiannidis C, Cra- meri R, et al. Immune responses in healthy and allergic individuals are characterized by a fine balance between allergen-specific T regulatory 1 and T helper 2 cells. J Exp Med 2004;199:1567-75.
23. Iwata M, Eshima Y, Kagechika H. Retinoic acids exert direct effects on T cells to suppress Th1 development and enhance Th2 devel- opment via retinoic acid receptors. Int Immunol 2003;15:1017-25.
24. Stephensen CB, Rasooly R, Jiang X, Ceddia MA, Weaver CT, Chan- draratna RA, et al. Vitamin A enhances in vitro Th2 development via retinoid X receptor pathway. J Immunol 2002;168:4495-503.
25. Stephensen CB, Jiang X, Freytag T. Vitamin A deficiency increases the in vivo development of IL-10-positive Th2 cells and decreases development of Th1 cells in mice. J Nutr 2004;134:2660-6.
26. Ma Y, Chen Q, Ross AC. Retinoic acid and polyriboinosinic:polyrib ocytidylic acid stimulate robust anti-tetanus antibody production while differentially regulating type 1/type 2 cytokines and lympho- cyte populations. J Immunol 2005;174:7961-9.
27. Benson MJ, Pino-Lagos K, Rosemblatt M, Noelle RJ. All-trans reti-
noic acid mediates enhanced T reg cell growth, differentiation, and gut homing in the face of high levels of co-stimulation. J Exp Med 2007;204:1765-74.
28. Mucida D, Park Y, Cheroutre H. From the diet to the nucleus: vita- min A and TGF-beta join efforts at the mucosal interface of the in- testine. Semin Immunol 2009;21:14-21.
29. Weaver CT, Hatton RD. Interplay between the TH17 and TReg cell lineages: a (co-)evolutionary perspective. Nat Rev Immunol 2009;
9:883-9.
30. Rubin RN, Navon L, Cassano PA. Relationship of serum antioxi- dants to asthma prevalence in youth. Am J Respir Crit Care Med 2004;169:393-8.
31. Harik-Khan RI, Muller DC, Wise RA. Serum vitamin levels and the risk of asthma in children. Am J Epidemiol 2004;159:351-7.
32. Grievink L, Smit HA, Ocké MC, van ‘t Veer P, Kromhout D. Dietary intake of antioxidant (pro)-vitamins, respiratory symptoms and pulmonary function: the MORGEN study. Thorax 1998;53:166-71.
33. Troisi RJ, Willett WC, Weiss ST, Trichopoulos D, Rosner B, Speizer FE. A prospective study of diet and adult-onset asthma. Am J Respir Crit Care Med 1995;151:1401-8.
34. Mucida D, Park Y, Kim G, Turovskaya O, Scott I, Kronenberg M, et al. Reciprocal TH17 and regulatory T cell differentiation mediated by retinoic acid. Science 2007;317:256-60.