ABSTRACT
Background: This study aimed to evaluate the therapeutic effect of repetitive transcranial magnetic stimulation (rTMS) as a nonpharmacologic treatment in depressed hemodialysis patients.
Methods: Patients who scored ≥ 5 on the Patient Health Questionnaire-9 were randomized to either the rTMS (n = 7) or sham group (n = 7). The rTMS group was stimulated with a 110%
motor threshold and 10 Hz on the left dorsolateral prefrontal cortex for 20 minutes, three times a week, for 4 weeks. In the sham group, the “1-wing 90-degree method” was used. We analyzed clinical indices before and after the intervention, as well as data from quantitative electroencephalography (frontal alpha asymmetry [FAA]), and various psychiatric
questionnaires (Beck Depression Inventory-II, Beck Anxiety Inventory [BAI], Symptom Checklist-90-Revised Somatization Subscale [SCL-90R-SOM]), and Perceived Stress Scale.
Results: One month after rTMS, the changes in hemoglobin A1c levels in the rTMS group were significantly greater than those in the sham group (F = 6.687, P = 0.032). The changes in BAI scores in the rTMS group were significantly greater than those in the sham group (F = 6.700, P = 0.025), and the changes in SCL-90R-SOM scores in the rTMS group were greater than those in the sham group (F = 4.943, P = 0.048). In addition, the changes in the FAA value at the F7 and F8 electrodes in the rTMS group were greater than those in the sham group (F = 6.468, P = 0.027).
Conclusion: In depressed hemodialysis patients, rTMS may improve anxiety and somatization symptoms, which may lead to improvements in clinical measures.
Trial Registration: Clinical Research Information Service Identifier: KCT0004082 Keywords: Depression; Kidney; Hemodialysis; Transcranial Magnetic Stimulation;
Quantitative Electroencephalogram
INTRODUCTION
The prevalence of major depressive disorder in patients with end-stage renal disease (ESRD) is higher than in patients with diabetes mellitus (DM) or congestive heart failure.1 However, it is difficult to prescribe antidepressants because of concerns about the potential adverse effects in patients with chronic kidney disease (CKD).1-3
Original Article
Received: Jan 13, 2020 Accepted: May 14, 2020 Address for Correspondence:
Sun Mi Kim, MD, PhD
Department of Psychiatry, Chung-Ang University Hospital, 102 Heukseok-ro, Dongjack-gu, Seoul 06973 Korea.
E-mail: [email protected]
© 2020 The Korean Academy of Medical Sciences.
This is an Open Access article distributed under the terms of the Creative Commons Attribution Non-Commercial License (https://
creativecommons.org/licenses/by-nc/4.0/) which permits unrestricted non-commercial use, distribution, and reproduction in any medium, provided the original work is properly cited.
ORCID iDs Jin Ho Hwang
https://orcid.org/0000-0003-0829-0922 Hyunchan Hwang
https://orcid.org/0000-0001-6514-5188 Hye Ri Kim
https://orcid.org/0000-0002-4147-4056 Ji Sun Hong
https://orcid.org/0000-0002-3898-8427 Doug Hyun Han
https://orcid.org/0000-0001-5888-0686 Jung-ho Shin
https://orcid.org/0000-0001-9755-3100 Su Hyun Kim
https://orcid.org/0000-0003-3382-528X Sun Mi Kim
https://orcid.org/0000-0003-4131-0542
Jin Ho Hwang ,1 Hyunchan Hwang ,2 Hye Ri Kim ,2 Ji Sun Hong ,2 Doug Hyun Han ,2 Jung-ho Shin ,1 Su Hyun Kim ,1 and Sun Mi Kim 2
1Division of Nephrology, Department of Internal Medicine, Chung-Ang University Hospital, Seoul, Korea
2Department of Psychiatry, Chung-Ang University Hospital, Seoul, Korea
Effects of Repetitive Transcranial Magnetic Stimulation on
Improvement of Mental Health and Clinical Parameters in Depressed Hemodialysis Patients: a Pilot Study
Psychiatry & Psychology
Trial Registration
Clinical Research Information Service Identifier: KCT0004082
Funding
This study was supported by a research grant from the Seoul Western Branch of the Korean Society for Dialysis Therapy (2017).
Disclosure
The authors have no potential conflicts of interest to disclose.
Author Contributions
Conceptualization: Kim SM, Hwang JH, Kim HR; Data curation: Shin JH, Kim SH;
Formal analysis: Kim SM, Han DH; Funding acquisition: Hwang JH; Investigation: Hwang H, Kim HR, Hong JS; Writing - original draft:
Hwang JH, Kim SM; Writing - review & editing:
Han DH.
Repetitive transcranial magnetic stimulation (rTMS) has emerged as an effective and safe alternative to treat depression in patients who have difficulty taking antidepressants.4,5 rTMS involves a noninvasive device that generates a magnetic field with an electromagnetic coil and transmits a repetitive magnetic pulse to the cerebral cortex 1 to 2 cm below the coil.6 This stimulation not only increases or decreases cortical excitability in certain brain regions but also induces changes in the associated neuronal networks.6 rTMS of the dorsolateral prefrontal cortex (DLPFC) improves depression symptoms by affecting the functional connectivity between the brain networks related to depression.7,8 Of several protocols that stimulate the DLPFC, previous studies have specifically demonstrated the anti-depressive effects of high-frequency (> 1 Hz) rTMS of the left DLPFC.9
Frontal alpha asymmetry (FAA) measurement can be used to evaluate the functions of the prefrontal cortex, as it is known to be related to mood and anxiety.10 Lower left prefrontal alpha activity may reflect greater relative left prefrontal activation, because alpha activity is considered as an idle rhythm.11 Greater relative left prefrontal activity is related to positive mood and approach motivations. On the contrary, lower right prefrontal alpha activity may reflect greater relative right prefrontal activation, which is related to anxiety and negative mood.12 While alpha activity may have a trait-like nature,13 studies have reported a change in alpha asymmetry during therapeutic interventions. FAA values have therefore been used in previous studies to evaluate the effects of therapeutic interventions on mood and anxiety disorders.14-16 To date, cognitive behavioral therapy and exercise therapy have been considered as
nonpharmacologic treatments for patients with depression and CKD or ESRD.17 No studies have investigated the effect of rTMS in depressed patients with CKD or ESRD. We studied the therapeutic effect of rTMS as a nonpharmacologic treatment in depressed hemodialysis patients. We hypothesized that rTMS would improve the mental health and clinical outcomes in depressed hemodialysis patients. In addition, we hypothesized that these improvements would be associated with improved quantitative electroencephalography (EEG) parameters, i.e., FAA values reflecting an increase in relative left prefrontal activation.
METHODS
Study participants
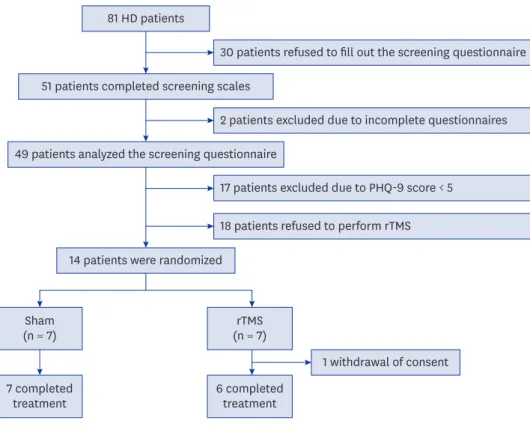
We recruited ESRD patients in the Chung-Ang University Hospital who 1) were receiving maintenance hemodialysis between April and June 2017 and 2) scored ≥ 5 on the Patient Health Questionnaire-9 (PHQ-9), indicating mild to severe depression.18 The PHQ-9 is a nine-item instrument designed to screen the presence and severity of depression in a primary care setting.18 All participants were screened by psychiatrists using the Structured Clinical Interview for DSM-5 Disorders: Clinician Version (SCID-5-CV).19 Hemodialysis patients diagnosed with major depressive disorder based on the SCID-5-CV were included. The exclusion criteria were as follows: 1) past or current psychiatric diagnosis, other than major depressive disorder, 2) conductive metal around the head, 3) prescription of antidepressants, anticonvulsants, or other psychiatric drugs within the previous month, 4) self-reported left-handedness, and 5) history of epilepsy, head trauma, or neurocognitive disorder. Of the 81 patients undergoing hemodialysis in the hemodialysis unit of the Chung-Ang University Hospital, 51 responded to the PHQ-9. Two respondents were excluded because they had a major neurocognitive disorder (Alzheimer's disease). Of the remaining 49 patients, 32 were diagnosed with major depressive disorder; 17 patients agreed to participate in the final rTMS
study and were randomized. We performed a per-protocol analysis of the 13 randomized patients who completed the protocol. The sample size was calculated with a two-sided 5%
significance level, a power of 80%, and a sample size of 7 patients per group.
We collected and analyzed clinical indices, including laboratory data, before and after rTMS.
We also collected quantitative EEG data and results from various psychiatric questionnaires (Beck Depression Inventory-II [BDI-II],3 Beck Anxiety Inventory [BAI],20 Symptom Checklist- 90-Revised Somatization Subscale [SCL-90R-SOM],21 and Perceived Stress Scale [PSS]22).
Demographic and laboratory data collection
Demographic variables of age, sex, CKD cause (DM vs. non-DM), dialysis vintage, smoking status, and comorbidities (Charlson Comorbidity Index [CCI])23 were collected. The CCI has been well validated in populations with various chronic diseases, including dialysis and ESRD.24-26 The following parameters were collected at baseline and 1 month after rTMS: interdialytic weight gain (IDWG), systolic and diastolic blood pressure at pre-/post-dialysis, and laboratory blood tests (hemoglobin/hematocrit, blood urea nitrogen/creatinine, calcium, phosphorus, potassium, total cholesterol, albumin, iron/total iron binding capacity, ferritin, and intact parathyroid hormone [iPTH]; and for DM patients, glucose and hemoglobin A1c [HbA1c]).
Among these parameters, serum phosphorus, potassium, and HbA1c levels were considered to be indicative of patient compliance.27
TMS protocol and psychological data collection
The rTMS group was stimulated with a 110% motor threshold and 10 Hz on the left DLPFC for 20 minutes, three times a week, for 4 weeks. In the sham group, the “1-wing 90 degree method” was used to prevent the effective magnetic field from being transmitted to the subjects.28,29 We collected and analyzed clinical indices before and after rTMS, gathered data using quantitative EEG, and tabulated the results of various psychiatric questionnaires (BDI-II, BAI, SCL-90R-SOM, and PSS). BDI-II and BAI results were used to assess depression symptoms and anxiety, respectively. Previous studies have established the high internal consistency and validity of both these tools.20,30 The SCL-90R evaluates various symptoms of psychopathology.21 The somatization subscale (SCL-90R-SOM) includes 12 items rated using a five-point Likert scale to measure distress arising from the perception of physical complaints pertaining to autonomic control and muscle pain.31 The PSS is a commonly used 10-item instrument that measures the degree to which a responder feels stress.22
EEG data collection and EEG preprocessing
EEG recordings were performed by EEG technicians in an electromagnetically shielded room.
Using the 21-channel CMXL-P230 EEG system (Grass-Telefactor, West Warwick, RI, USA), EEG activity was recorded for 10 minutes while participants' eyes were closed. Participants were asked to relax and stay awake during the recording. Based on the International 10/20 system, EEG data were obtained from 19 electrodes placed on the scalp at Fp1, Fp2, F3, F4, F7, F8, Fz, C3, C4, Cz, T3, T4, T5, T6, P3, P4, Pz, O1, and O2. Two additional electrodes were positioned on the ear lobe with A2 as the reference and A1 as the ground. EEG signal was band-pass filtered at 0.5 to 46.0 Hz, with a 60-Hz notch, and electrode impedances were < 5 kΩ. Data were sampled at a frequency of 256 Hz.
EEG data analysis was conducted using NeuroSpeed software (Alpha Trace Medical Systems, Vienna, Austria). For EEG analyses, artifact-free 300-second periods were extracted from
raw EEG data. Epochs containing artifacts were removed by visual inspection. Next, FAA values were estimated over the frontal area by subtracting the natural log of the alpha power (7.5–12.5 Hz) of the left frontal electrode from that of the right frontal electrode. Based on previous studies,32 we chose electrodes for the mid-frontal (F3 and F4) and mid-lateral (F7 and F8) regions. Thus, a high score meant relatively high right alpha activity, reflecting greater activation of the left frontal region than the right frontal region.
Statistical analysis
Categorical data were compared using χ2 or Fisher's exact tests, and continuous variables were analyzed through an independent t-test or the Mann-Whitney U test according to the normality test. The normality test was performed using the Shapiro-Wilk test. The change in laboratory and psychological parameters between baseline and 1 month post-rTMS were evaluated by repeated measures analysis of variance.
All reported P values were two-sided, and P values < 0.05 were considered statistically significant. Data manipulation and statistical analyses were conducted using R version 3.4.4 (R Foundation for Statistical Computing, Vienna, Austria) and the SPSS 20 Statistical Package (SPSS Inc., Chicago, IL, USA).
Ethics statement
The present study is a randomized clinical trial and is registered at the Clinical Research Information Service (CRIS, http://cris.nih.go.kr; number KCT0004082). All clinical investigations were conducted in accordance with the 2013 Declaration of Helsinki and the guidelines of good clinical practice. The Institutional Review Board of Chung-Ang University Hospital reviewed and approved the study protocol (approval No. 1730-003-272). Written informed consent was obtained from all patients before their inclusion in the study.
RESULTS
Patients' demographic and clinical characteristics
In this study, 14 patients were randomized: 7 to the sham group and 7 to the rTMS group.
One patient in the rTMS group withdrew consent after five rTMS sessions; thus, 13 patients were included in the final analyses (Fig. 1). The characteristics of the study population are summarized in Table 1. The sham group patients had lower ferritin and higher iPTH levels than the rTMS group patients. Although not statistically significant, the rTMS group patients were older and had shorter dialysis durations, higher CCIs, and lower serum phosphorus and higher HbA1c levels. No differences were found in other profiles, such as serum potassium level, dialysis efficiency (single-pool Kt/V), psychological scale scores (BDI-II, BAI, SCL-90R- SOM, and PSS), and FAA values on quantitative EEG.
Differences in demographics, clinical characteristics, and psychological scale scores after rTMS among the study groups
When laboratory findings were compared 1 month after rTMS, HbA1c levels significantly improved in the rTMS group (8.3% to 7.1%, P = 0.046) (Table 2). The changes in HbA1c levels in the rTMS group were significantly greater than those in the sham group (F = 6.687, P = 0.032).
BDI-II scores improved both in the sham group (24.0 to 18.4, P = 0.009) and rTMS group (21.2 to 13.8, P = 0.005), but there was no statistically significant difference in the changes
between the groups (Figs. 2 and 3). The changes in BAI scores in the rTMS group were significantly greater than those in the sham group (F = 6.700, P = 0.025), and the changes in SCL-90R-SOM scores in the rTMS group were greater than those in the sham group (F = 4.943, P = 0.048).
Quantitative EEG
The changes in the F4-F3 FAA value in the rTMS group were significantly greater than those in the sham group (F = 10.199, P = 0.009) (Fig. 4), and the changes in the F8-F7 FAA value in the rTMS group were greater than those in the sham group (F = 6.468, P = 0.027).
Adverse events
No patient complaints were received regarding side effects or discomfort related to the intervention during the study.
DISCUSSION
To date, no studies have investigated the effect of rTMS in depressed patients with CKD or ESRD using quantitative EEG. In this study, rTMS in ESRD patients with depression was found to significantly improve BDI-II and BAI scores and improve HbA1c levels. These results were accompanied by significant changes in quantitative EEG results. Our results show that rTMS can improve not only depression and anxiety symptoms in dialysis patients burdened with pharmacologic treatment but also some clinical indicators.
81 HD patients
51 patients completed screening scales
14 patients were randomized
49 patients analyzed the screening questionnaire
30 patients refused to fill out the screening questionnaire
2 patients excluded due to incomplete questionnaires
17 patients excluded due to PHQ-9 score < 5 18 patients refused to perform rTMS
(n = 7)Sham rTMS
(n = 7)
7 completed
treatment 6 completed
treatment
1 withdrawal of consent
Fig. 1. Study flow chart.
HD = hemodialysis, PHQ-9 = Patient Health Questionnaire-9, rTMS = repetitive transcranial magnetic stimulation.
In this study, depression level, as measured by the BDI-II, was improved both in the sham and rTMS groups, but there were no statistically significant differences in the changes in depression level between the two groups. The changes in the level of anxiety and somatic symptoms in the rTMS group were greater than those in the sham group. Anxiety is a common mental condition that is often overlooked in hemodialysis patients.33 Patient Table 1. Baseline characteristics of the sham and rTMS groups
Characteristics Sham (n = 7) rTMS (n = 6) Total (n = 13) P value P value (normalitya)
Sham rTMS
Age, yr 62.6 ± 9.6 66.0 ± 16.2 64.2 ± 12.6 0.645 0.764 0.378
Sex (male:female), % 85.7:14.3 83.3:16.7 84.6:15.4 1.000 - -
Clinical parameters
Systolic BP pre-HD, mmHg 172.1 ± 14.4 154.7 ± 29.3 164.1 ± 23.3 0.225 0.243 0.335
Diastolic BP pre-HD, mmHg 77.1 ± 19.0 81.7 ± 13.5 79.2 ± 16.2 0.637 0.770 0.173
Systolic BP post-HD, mmHg 148.9 ± 30.3 154.8 ± 30.7 151.6 ± 29.4 0.731 0.914 0.560
Diastolic BP post-HD, mmHg 84.1 ± 13.7 89.3 ± 17.1 86.5 ± 14.9 0.477 0.309 0.883
Comorbidity, %
HT 100 100 100 - - -
DM 85.7 66.7 76.9 0.559 - -
CVD 57.1 50.0 53.8 1.000 - -
CKD cause (DM:non-DM) 71.4:28.6 66.7:33.3 69.2:30.8 1.000 - -
Current smoker, % 0 16.7 7.7 0.230 - -
Dialysis vintage, mon 63.4 ± 58.4 41.5 ± 32.5 53.3 ± 47.6 0.434 0.463 0.568
CCI with age 5.7 ± 1.7 7.0 ± 1.4 6.3 ± 1.7 0.171 0.098 0.960
CCI without age 4.0 ± 1.5 4.7 ± 0.8 4.3 ± 1.3 0.360 0.310 0.091
Interdialytic weight gain, kg 2.2 ± 0.7 2.2 ± 0.5 2.2 ± 0.6 0.904 0.410 0.946
Hemoglobin, g/dL 11.5 ± 2.2 10.2 ± 0.6 10.9 ± 1.8 0.178 0.555 0.989
Hematocrit, % 35.1 ± 6.5 30.3 ± 2.3 32.9 ± 5.4 0.117 0.730 0.174
Ferritin, mg/dLb 107.5 (54–270) 244.2 (98–473) 117.2 (54–473) 0.029 0.017 0.791
Iron, mg/dL 64.4 ± 21.5 73.0 ± 19.2 68.4 ± 20.1 0.468 0.740 0.861
TIBC, mg/dL 244.6 ± 44.2 226.0 ± 33.8 236.0 ± 39.3 0.420 0.276 0.416
Transferrin saturation, % 25.3 ± 6.0 35.9 ± 13.3 30.2 ± 11.0 0.084 0.132 0.752
Serum albumin, g/dLb 3.7 (3.6–4.0) 3.8 (3.3–3.9) 3.8 (3.3–4.0) 1.000 0.163 0.020
Blood urea nitrogen, mg/dL 67.1 ± 14.2 59.5 ± 9.9 63.6 ± 12.5 0.293 0.232 0.590
Creatinine, mg/dL 9.0 ± 3.1 9.4 ± 1.4 9.2 ± 2.4 0.771 0.114 0.446
Fasting glucose, mg/dL 183.3 ± 101.8 189.0 ± 60.5 185.9 ± 82.0 0.907 0.571 0.678
Cholesterol, mg/dLb 168.0 (129–223) 137.5 (113–274) 142.0 (113–274) 0.103 0.736 0.002
Uric acid, mg/dL 7.0 ± 1.7 5.9 ± 1.4 6.5 ± 1.6 0.235 0.512 0.900
Phosphorus, mg/dL 5.9 ± 2.1 4.5 ± 1.3 5.2 ± 1.8 0.171 0.120 0.795
Calcium, mg/dL 8.5 ± 0.6 8.4 ± 0.6 8.5 ± 0.6 0.756 0.992 0.680
Calcium × phosphorus 50.8 ± 20.2 37.6 ± 11.4 44.7 ± 17.5 0.174 0.060 0.782
Potassium, mmol/L 5.0 ± 0.9 5.0 ± 0.8 5.0 ± 0.8 0.894 0.356 0.766
Intact PTH 435.9 ± 188.4 209.0 ± 125.7 331.2 ± 195.5 0.029 0.493 0.879
HbA1c, %c 7.0 ± 1.3 8.3 ± 2.6 7.5 ± 1.9 0.334 0.057 0.401
Single-pool Kt/V 1.6 ± 0.4 1.6 ± 0.2 1.6 ± 0.3 0.813 0.248 0.607
Psychological parameters
PHQ-9 11.3 ± 5.8 11.0 ± 5.3 11.2 ± 5.4 0.928 0.056 0.236
BAI 14.3 ± 12.6 17.2 ± 9.1 15.6 ± 10.8 0.651 0.553 0.669
BDI-II 24.0 ± 10.7 21.2 ± 7.4 22.7 ± 9.1 0.598 0.285 0.883
SCL-90R-SOM 21.4 ± 6.9 27.7 ± 10.2 24.3 ± 8.8 0.218 0.498 0.403
PSS 18.7 ± 2.4 20.7 ± 4.9 19.6 ± 3.7 0.370 0.883 0.986
Neurophysiological parameters
F4-F3 FAA −0.022 ± 0.258 −0.074 ± 0.134 −0.046 ± 0.204 0.663 0.205 0.963
F8-F7 FAA 0.011 ± 0.442 −0.062 ± 0.062 −0.023 ± 0.318 0.683 0.525 0.407
BAI = Beck Anxiety Inventory, BDI-II = Beck Depression Inventory-II, BP = blood pressure, CCI = Charlson comorbidity Index, CKD = chronic kidney disease, CVD
= cardiovascular disease, DM = diabetes mellitus, FAA = frontal alpha asymmetry, HbA1c = hemoglobin A1c, HD = hemodialysis, HT = hypertension, K = dialyzer clearance of urea, t = dialysis time, V = urea distribution volume, TIBC = total iron binding capacity, PHQ-9 = Patient Health Questionnaire-9, PSS = Perceived Stress Scale, PTH = parathyroid hormone, rTMS = repetitive transcranial magnetic stimulation, SCL-90R-SOM = Symptom Checklist-90-Revised Somatization Subscale.
aNormality test performed by Shapiro-Wilk test; bMann-Whitney tests for ferritin, serum albumin, and cholesterol did not satisfy the normality test; cHbA1c examined only in DM patients (n = 6 for the sham group, n = 4 for the rTMS group).
behaviors that are superficially irrational or that conflict with staffs or physicians, including behavioral non-adherence, could be an expression of underlying anxiety.33 Anxiety should be cautiously monitored and treated because it is related to depression, perceived poor quality of life, and deterioration in behavioral adherence. rTMS has been shown to be effective for anxiety symptoms in patients with major depressive disorder,34 and it can reduce overall anxiety and depression symptoms in patients with posttraumatic stress disorder.35 There are few studies on the effect of rTMS on somatic symptoms; however, previous studies have shown that rTMS has potential usefulness in the treatment of chronic pain conditions, such as neuropathic pain, fibromyalgia, and complex regional pain syndrome.36 Although there is a need for further research, the mechanisms of the analgesic effects of rTMS may involve improvement in the functioning within the DLPFC, anterior cingulate cortex, and sensory cortex, via enhancement of the endogenous opioid system.37 In fact, it is difficult to explain exactly why there were no significant differences in the changes in depression level between the two groups in this study. This may be because the physical component of depression might be confounding in patients with severe physical diseases.38,39 Larger studies, including a factor analysis, are needed to explain the reason.
In this study, HbA1c levels markedly improved in the rTMS group, and the changes in HbA1c levels in the rTMS group were significantly greater than those in the sham group. HbA1c Table 2. One-month post-rTMS outcomes
Variables Sham (n = 7) rTMS (n = 6) F P value
Baseline 1-mon post-rTMS Baseline 1-mon post-rTMS
Clinical parameters
Systolic BP pre-HD, mmHg 172.1 ± 14.4 167.2 ± 16.5 154.7 ± 29.3 156.2 ± 26.4 0.168 0.690
Diastolic BP pre-HD, mmHg 77.1 ± 19.0 82.9 ± 6.7 81.7 ± 13.5 70.8 ± 9.2 4.402 0.060
Systolic BP post-HD, mmHg 148.9 ± 30.3 157.7 ± 13.1 154.8 ± 30.7 153.9 ± 28.2 0.344 0.569
Diastolic BP post-HD, mmHg 84.1 ± 13.7 83.9 ± 9.7 89.3 ± 17.1 73.0 ± 11.8 4.088 0.068
Interdialytic weight gain, kg 2.2 ± 0.7 1.7 ± 0.9 2.2 ± 0.5 2.1 ± 0.7 2.928 0.115
Hemoglobin, mg/dL 11.5 ± 2.2 11.3 ± 1.1 10.2 ± 0.6 10.7 ± 0.8 0.672 0.430
Ferritin 119.1 ± 70.6 204.4 ± 103.8 273.8 ± 142.0 236.3 ± 108.1 3.787 0.078
Iron, mg/dL 64.4 ± 21.5 82.9 ± 23.4 73.0 ± 19.2 91.8 ± 23.1 0.001 0.979
TIBC, mg/dL 244.6 ± 44.2 234.0 ± 30.7 226.0 ± 33.8 228.0 ± 39.4 1.207 0.295
Transferrin saturation, % 25.3 ± 6.0 35.1 ± 7.5 35.9 ± 13.3 40.5 ± 9.1 0.773 0.398
Serum albumin, g/dL 3.7 ± 0.2 4.0 ± 0.3 3.7 ± 0.2 3.9 ± 0.3 0.585 0.461
Fasting glucose, mg/dL 183.3 ± 101.8 172.4 ± 36.0 189.0 ± 60.5 178.0 ± 61.2 0 0.998
Cholesterol, mg/dL 168.0 ± 30.4 148.9 ± 38.3 156.2 ± 58.7 149.8 ± 42.5 0.293 0.599
Uric acid, mg/dL 7.0 ± 1.7 6.3 ± 1.0 5.9 ± 1.4 5.5 ± 2.7 0.081 0.782
Calcium, mg/dL 8.5 ± 0.6 9.1 ± 0.9 8.4 ± 0.6 8.5 ± 0.7 1.436 0.256
Phosphorus, mg/dL 5.9 ± 2.1 3.9 ± 1.1 4.5 ± 1.3 4.2 ± 1.2 2.014 0.184
Calcium × phosphorus 50.8 ± 20.2 35.5 ± 10.5 37.6 ± 11.4 35.8 ± 10.8 2.024 0.183
Potassium, mmol/L 5.0 ± 0.9 4.6 ± 0.6 5.0 ± 0.8 4.8 ± 0.8 0.229 0.642
Intact PTH 441.9 ± 205.7 421.8 ± 408.7 209.0 ± 125.7 152.0 ± 105.2 0.080 0.783
HbA1ca 7.0 ± 1.3 7.4 ± 1.0 8.3 ± 2.6 7.1 ± 1.5 6.687 0.032
Psychological parameters
BAIa 14.3 ± 12.6 16.9 ± 13.0 17.2 ± 9.1 11.2 ± 6.0 6.700 0.025
BDI-II 24.0 ± 10.7 18.4 ± 9.9 21.2 ± 7.4 13.8 ± 5.1 0.694 0.423
SCL-90R-SOMa 21.4 ± 6.9 22.4 ± 5.6 27.7 ± 10.2 20.2 ± 5.4 4.943 0.048
PSS 18.7 ± 2.4 16.7 ± 4.2 20.7 ± 4.9 19.3 ± 5.7 0.147 0.709
Neurophysiological parameters
F4-F3 FAAb −0.022 ± 0.258 −0.184 ± 0.199 −0.074 ± 0.134 0.100 ± 0.136 10.199 0.009
F8-F7 FAAa 0.011 ± 0.442 −0.148 ± 0.253 −0.062 ± 0.062 0.185 ± 0.228 6.468 0.027
rTMS = repetitive transcranial magnetic stimulation, BAI = Beck Anxiety Inventory, BDI-II = Beck Depression Inventory-II, BP = blood pressure, FAA = frontal alpha asymmetry, HbA1c = hemoglobin A1c, HD = hemodialysis, TIBC = total iron binding capacity, PSS = Perceived Stress Scale, PTH = parathyroid hormone, SCL-90R- SOM = Symptom Checklist-90-Revised Somatization Subscale.
aP < 0.05; bP < 0.01.
represents cumulative glycemic control within the previous 3 or 4 months, and it reflects patients' daily lifestyles. The rTMS group patients had poorly controlled DM at baseline, but marked improvement in HbA1c levels was achieved after one month of intervention. Both depression and DM can be triggered by shared mechanisms: biological risk factors, such as the hypothalamic-pituitary-adrenal axis and inflammation responses, and behavioral risk factors, such as poor eating habits, sleep problems, and sedentary lifestyle.40 Depression is known to increase the risk of hyperglycemia and insulin resistance in diabetic patients due to unhealthy lifestyles associated with a depressed state, including sedentariness, smoking, and alcohol abuse.41 Therefore, we could speculate that the improved HbA1c levels in this study may reflect a continuous improvement in lifestyle. Considering the improvement in psychological scale scores and quantitative EEG results, it is thought that rTMS improved depressed mood and induced an improvement in lifestyle itself, an essential factor for patients' glycemic control. In addition to HbA1c levels, there are several indicators of compliance with medication and dietary habits in dialysis patients including IDWG; serum phosphorus, potassium, and glucose levels; and blood pressure readings. However, we found no meaningful differences in the changes of these indicators in this study, which may be due to differences in baseline characteristics. In this study, the baseline phosphorus value of the sham group was high but not statistically significant. This may be because although randomization was performed, a small number of patients participated in the study, and an unavoidable bias occurred. The rTMS group had well-regulated serum phosphorus levels at baseline. Taking these things into consideration, secondary hyperparathyroidism (high serum iPTH levels), the occurrence of which is related to long-standing hyperphosphatemia, more than doubled between the two groups.
Score
(pre)BAI BAI
(post) 30
0 20
10
Score
30
20
10
Sham rTMS
BDI-II
(pre) BDI-II
(post)
Score
SCL-90R-SOM
(pre) SCL-90R-SOM (post) 20
40
30
Score
25
10 15
20 Sham
rTMS
(pre)PSS PSS
(post) Fig. 2. Changes in psychological scale scores pre- and post-rTMS.
BAI = Beck Anxiety Inventory, BDI-II = Beck Depression Inventory-II, PSS = Perceived Stress Scale, rTMS = repetitive transcranial magnetic stimulation, SCL-90R-SOM = Symptom Checklist-90-Revised Somatization Subscale.
%
HbA1c
(pre) HbA1c
(post) 8.25
7.00 8.00
7.25 7.50 7.75
Score
18
16
12 14
Sham rTMS
(pre)BAI
A B
(post)BAI
P = 0.032 P = 0.025
Score
BDI-II
(pre) BDI-II
(post) 12.5
22.5
15.0 17.5 20.0
Score
28
24
20 26
22
Sham rTMS
SCL-90R-SOM (pre)
C D
SCL-90R-SOM (post)
P = 0.423 P = 0.048
Fig. 3. Changes in HbA1c levels and psychological scale scores due to intervention. (A) HbA1c levels (%) were significantly improved in the rTMS group (8.3% to 7.1%, P = 0.046) but not in the sham group (7.0% to 7.4%, P = 0.318).
The changes in HbA1c levels in the rTMS group were significantly greater than those in the sham group (F = 6.687, P = 0.032). (B) While BAI scores did not significantly improve in the sham group (14.3 to 16.9, P = 0.258) or rTMS group (17.2 to 11.2, P = 0.074), the changes in BAI scores in the rTMS group were significantly greater than those in the sham group (F = 6.700, P = 0.025). (C) BDI-II scores improved both in the sham group (24.0 to 18.4, P = 0.009) and rTMS group (21.2 to 13.8, P = 0.005). However, there were no statistically significant differences in the changes in BDI-II scores between the groups (F = 0.694, P = 0.423). (D) While SCL-90R-SOM scores did not significantly improve in the sham group (21.4 to 22.4, P = 0.675) or rTMS group (27.7 to 20.2, P = 0.065), the changes in SCL-90R-SOM scores in the rTMS group were greater than those in the sham group (F = 4.943, P = 0.048).
BAI = Beck Anxiety Inventory, BDI-II = Beck Depression Inventory-II, HbA1c = hemoglobin A1c, rTMS = repetitive transcranial magnetic stimulation, SCL-90R-SOM = Symptom Checklist-90-Revised Somatization Subscale.
FAA value
F4-F3 FAA
(pre) F4-F3 FAA
(post) 0.2
0
−0.2 0.1
−0.1 FAA value
0.2
0
−0.2 0.1
−0.1
Sham rTMS
F8-F7 FAA
(pre) F8-F7 FAA
(post)
P = 0.009 P = 0.027
INION NASION Fp1
T3 T4 A2
A1 Cz C4
Fz C3
P3
O1 O2
Pz P4
T5 T6
Fp2
F7 F3 F4 F8
Fig. 4. Changes in mean FAA values. In the rTMS group, the F4-F3 FAA value (−0.074 to 0.100, P = 0.074) and F8-F7 FAA value (−0.062 to 0.185, P = 0.086) showed no significant changes, although there was a general increasing tendency. The sham group showed no significant changes in either the F4-F3 FAA value (−0.022 to −0.184, P = 0.064) or F8-F7 FAA value (0.011 to −0.148, P = 0.197). The changes in the F4-F3 FAA value (F = 10.199, P = 0.009) and F8-F7 FAA value (F = 6.468, P = 0.027) in the rTMS group were significantly greater than those in the sham group.
FAA = frontal alpha asymmetry, rTMS = repetitive transcranial magnetic stimulation.
In this study, the change in F4-F3 and F8-F7 FAA values in the rTMS group was significantly greater than that in the sham group during the intervention. Lower left prefrontal alpha activity (greater relative left prefrontal activation) is related to positive mood, and lower right prefrontal alpha activity (greater relative right prefrontal activation) is related to anxiety and negative mood.12 In a study on mindfulness-based cognitive therapy in patients with a history of suicidal depression, the “treatment as usual” group showed a significant worsening in reduced relative left prefrontal activation compared to the mindfulness-based cognitive therapy group. In a study on cognitive behavioral therapy for patients with posttraumatic stress disorder, there was a greater reduction of right anterior activation, indicating a greater increase in relative left prefrontal activation, in the cognitive behavioral therapy group compared to wait-list controls.15 Similarly, in this study, rTMS in depressed hemodialysis patients appeared to result in increased F4-F3 and F8-F7 FAA values, reflecting greater relative left prefrontal activation and a positive emotional state.
rTMS has been consistently reported to have few severe side effects.9,42-45 In a study examining the safety data of rTMS in 325 depressed patients, very few patients reported severe adverse events associated with rTMS, and none experienced death or seizures.46 Seizures are the most dangerous side effect of rTMS; however, despite the extensive practice of rTMS, the incidence of rTMS-induced seizures is very low.44 In the present study, we minimized this risk by excluding patients with seizure-related risk factors (history of epilepsy, history of head trauma or stroke, and current psychiatric drug use) and setting stimulation parameters according to safety guidelines.44 The most common side effects of rTMS are headaches and discomfort at the stimulation site.9 In many studies, these side effects were mild and transient, and drop-outs due to these events were rare.43,45,46 In this study, none of the participants complained of significant adverse events, and the reason four of the patients dropped out after randomization was because they were unable to schedule the rTMS therapy three times a week. The drop-out rate in this study was less than 10%, and there was no difference in the drop-out rate between the sham and active groups, suggesting that rTMS could be a tolerable treatment.42
There are some limitations to this study. The sample size of this study was small, and the original 14 patients in the sample size calculation decreased to 13 patients in the final analysis due to the withdrawal of one patient. When we conducted a post hoc analysis, power was calculated to be 88% with a two-sided 5% significance level and an effect size of 0.68. Although this study was conducted using a small number of patients, it could be the cornerstone of future studies conducted with a large number of patients in multiple centers or to verify long-term effects based on the positive effects seen in this study.
To our knowledge, this is the first study to evaluate rTMS as a non-pharmaceutical alternative for hemodialysis patients with depression who may be vulnerable to potential adverse effects of pharmacotherapy. In patients who underwent rTMS, clinical indicators, mental health scale scores, and quantitative EEG findings improved compared to those in the control group. Based on this study, future studies could be conducted to evaluate the long-term effects and side effects of rTMS on depressed hemodialysis patients.
REFERENCES
1. Saglimbene V, Palmer S, Scardapane M, Craig JC, Ruospo M, Natale P, et al. Depression and all-cause and cardiovascular mortality in patients on haemodialysis: a multinational cohort study. Nephrol Dial Transplant 2017;32(2):377-84.
PUBMED
2. Watnick S, Kirwin P, Mahnensmith R, Concato J. The prevalence and treatment of depression among patients starting dialysis. Am J Kidney Dis 2003;41(1):105-10.
PUBMED | CROSSREF
3. Hedayati SS, Minhajuddin AT, Afshar M, Toto RD, Trivedi MH, Rush AJ. Association between major depressive episodes in patients with chronic kidney disease and initiation of dialysis, hospitalization, or death. JAMA 2010;303(19):1946-53.
PUBMED | CROSSREF
4. George MS, Lisanby SH, Avery D, McDonald WM, Durkalski V, Pavlicova M, et al. Daily left prefrontal transcranial magnetic stimulation therapy for major depressive disorder: a sham-controlled randomized trial. Arch Gen Psychiatry 2010;67(5):507-16.
PUBMED | CROSSREF
5. O'Reardon JP, Solvason HB, Janicak PG, Sampson S, Isenberg KE, Nahas Z, et al. Efficacy and safety of transcranial magnetic stimulation in the acute treatment of major depression: a multisite randomized controlled trial. Biol Psychiatry 2007;62(11):1208-16.
PUBMED | CROSSREF
6. Wagner T, Valero-Cabre A, Pascual-Leone A. Noninvasive human brain stimulation. Annu Rev Biomed Eng 2007;9:527-65.
PUBMED | CROSSREF
7. Liston C, Chen AC, Zebley BD, Drysdale AT, Gordon R, Leuchter B, et al. Default mode network mechanisms of transcranial magnetic stimulation in depression. Biol Psychiatry 2014;76(7):517-26.
PUBMED | CROSSREF
8. Salomons TV, Dunlop K, Kennedy SH, Flint A, Geraci J, Giacobbe P, et al. Resting-state cortico-thalamic- striatal connectivity predicts response to dorsomedial prefrontal rTMS in major depressive disorder.
Neuropsychopharmacology 2014;39(2):488-98.
PUBMED | CROSSREF
9. McClintock SM, Reti IM, Carpenter LL, McDonald WM, Dubin M, Taylor SF, et al. Consensus recommendations for the clinical application of repetitive transcranial magnetic stimulation (rTMS) in the treatment of depression. J Clin Psychiatry 2018;79(1):16cs10905.
PUBMED | CROSSREF
10. Moynihan JA, Chapman BP, Klorman R, Krasner MS, Duberstein PR, Brown KW, et al. Mindfulness-based stress reduction for older adults: effects on executive function, frontal alpha asymmetry and immune function. Neuropsychobiology 2013;68(1):34-43.
PUBMED | CROSSREF
11. Harmon-Jones E. Contributions from research on anger and cognitive dissonance to understanding the motivational functions of asymmetrical frontal brain activity. Biol Psychol 2004;67(1-2):51-76.
PUBMED | CROSSREF
12. Coan JA, Allen JJ. Frontal EEG asymmetry as a moderator and mediator of emotion. Biol Psychol 2004;67(1-2):7-49.
PUBMED | CROSSREF
13. Cook IA, Hunter AM, Gilmer WS, Iosifescu DV, Zisook S, Burgoyne KS, et al. Quantitative
electroencephalogram biomarkers for predicting likelihood and speed of achieving sustained remission in major depression: a report from the biomarkers for rapid identification of treatment effectiveness in major depression (BRITE-MD) trial. J Clin Psychiatry 2013;74(1):51-6.
PUBMED | CROSSREF
14. Barnhofer T, Duggan D, Crane C, Hepburn S, Fennell MJ, Williams JM. Effects of meditation on frontal alpha-asymmetry in previously suicidal individuals. Neuroreport 2007;18(7):709-12.
PUBMED | CROSSREF
15. Rabe S, Zoellner T, Beauducel A, Maercker A, Karl A. Changes in brain electrical activity after cognitive behavioral therapy for posttraumatic stress disorder in patients injured in motor vehicle accidents.
Psychosom Med 2008;70(1):13-9.
PUBMED | CROSSREF
16. Hong JS, Kim SM, Kang KD, Han DH, Kim JS, Hwang H, et al. Effect of physical exercise intervention on mood and frontal alpha asymmetry in internet gaming disorder. Ment Health Phys Act 2020;18:100318.
CROSSREF
17. Hedayati SS, Yalamanchili V, Finkelstein FO. A practical approach to the treatment of depression in patients with chronic kidney disease and end-stage renal disease. Kidney Int 2012;81(3):247-55.
PUBMED | CROSSREF
18. Kroenke K, Spitzer RL, Williams JB. The PHQ-9: validity of a brief depression severity measure. J Gen Intern Med 2001;16(9):606-13.
PUBMED | CROSSREF
19. First M, Williams J, Karg R, Spitzer R. Structured Clinical Interview for DSM-5 Disorders—Clinician Version (SCID- 5-CV). Arlington, VA: American Psychiatric Association; 2015.
20. Beck AT, Epstein N, Brown G, Steer RA. An inventory for measuring clinical anxiety: psychometric properties. J Consult Clin Psychol 1988;56(6):893-7.
PUBMED | CROSSREF
21. Derogatis LR. SCL-90-R: Administration, Scoring & Procedures Manual-II for the Revised Version and Other Instruments of The Psychopathology Rating Scale Series. Towson, MD: Clinical Psychometric Research, Inc.; 1992.
22. Cohen S, Williamson G. Perceived stress in a probability sample of the United States. In: Spacapan S, Oskamp S, editors. The Social Psychology of Health: Claremont Symposium on Applied Social Psychology. Newbury Park, CA: Sage; 1988, 31-67.
23. Charlson M, Szatrowski TP, Peterson J, Gold J. Validation of a combined comorbidity index. J Clin Epidemiol 1994;47(11):1245-51.
PUBMED | CROSSREF
24. Park JY, Kim MH, Han SS, Cho H, Kim H, Ryu DR, et al. Recalibration and validation of the Charlson comorbidity index in Korean incident hemodialysis patients. PLoS One 2015;10(5):e0127240.
PUBMED | CROSSREF
25. van Manen JG, Korevaar JC, Dekker FW, Boeschoten EW, Bossuyt PM, Krediet RT, et al. How to adjust for comorbidity in survival studies in ESRD patients: a comparison of different indices. Am J Kidney Dis 2002;40(1):82-9.
PUBMED | CROSSREF
26. Wu PH, Lin YT, Lee TC, Lin MY, Kuo MC, Chiu YW, et al. Predicting mortality of incident dialysis patients in Taiwan--a longitudinal population-based study. PLoS One 2013;8(4):e61930.
PUBMED | CROSSREF
27. Ghimire S, Castelino RL, Lioufas NM, Peterson GM, Zaidi ST. Nonadherence to medication therapy in haemodialysis patients: a systematic review. PLoS One 2015;10(12):e0144119.
PUBMED | CROSSREF
28. Kim YI, Kim SM, Kim H, Han DH. The effect of high-frequency repetitive transcranial magnetic stimulation on occupational stress among health care workers: a pilot study. Psychiatry Investig 2016;13(6):622-9.
PUBMED | CROSSREF
29. Lisanby SH, Gutman D, Luber B, Schroeder C, Sackeim HA. Sham TMS: intracerebral measurement of the induced electrical field and the induction of motor-evoked potentials. Biol Psychiatry 2001;49(5):460-3.
PUBMED | CROSSREF
30. Beck AT, Steer RA, Ball R, Ranieri W. Comparison of Beck Depression Inventories -IA and -II in psychiatric outpatients. J Pers Assess 1996;67(3):588-97.
PUBMED | CROSSREF
31. Derogatis L. Symptom Checklist-90-R: Administration, Scoring and Procedures Manual. 3rd ed. Minneapolis, MN:
National Computer Systems, Inc; 1994.
32. Gollan JK, Hoxha D, Chihade D, Pflieger ME, Rosebrock L, Cacioppo J. Frontal alpha EEG asymmetry before and after behavioral activation treatment for depression. Biol Psychol 2014;99:198-208.
PUBMED | CROSSREF
33. Cohen SD, Cukor D, Kimmel PL. Anxiety in patients treated with hemodialysis. Clin J Am Soc Nephrol 2016;11(12):2250-5.
PUBMED | CROSSREF
34. Chen L, Hudaib AR, Hoy KE, Fitzgerald PB. Is rTMS effective for anxiety symptoms in major depressive disorder? An efficacy analysis comparing left-sided high-frequency, right-sided low-frequency, and sequential bilateral rTMS protocols. Depress Anxiety 2019;36(8):723-31.
PUBMED | CROSSREF
35. Yan T, Xie Q, Zheng Z, Zou K, Wang L. Different frequency repetitive transcranial magnetic stimulation (rTMS) for posttraumatic stress disorder (PTSD): a systematic review and meta-analysis. J Psychiatr Res 2017;89:125-35.
PUBMED | CROSSREF
36. Galhardoni R, Correia GS, Araujo H, Yeng LT, Fernandes DT, Kaziyama HH, et al. Repetitive transcranial magnetic stimulation in chronic pain: a review of the literature. Arch Phys Med Rehabil 2015;96(4 Suppl):S156-72.
PUBMED | CROSSREF
37. Li CT, Su TP, Hsieh JC, Ho ST. Efficacy and practical issues of repetitive transcranial magnetic stimulation on chronic medically unexplained symptoms of pain. Acta Anaesthesiol Taiwan 2013;51(2):81-7.
PUBMED | CROSSREF
38. King-Wing Ma T, Kam-Tao Li P. Depression in dialysis patients. Nephrology (Carlton) 2016;21(8):639-46.
PUBMED | CROSSREF
39. Södeman E, Lisspers J. Diagnosing depression in patients with physical diseases using the Beck Depression Inventory (BDI). Scand J Behav Ther 1997;26(3):102-12.
40. Holt RI, de Groot M, Golden SH. Diabetes and depression. Curr Diab Rep 2014;14(6):491.
PUBMED | CROSSREF
41. Fiore V, Marci M, Poggi A, Giagulli VA, Licchelli B, Iacoviello M, et al. The association between diabetes and depression: a very disabling condition. Endocrine 2015;48(1):14-24.
PUBMED | CROSSREF
42. Berlim MT, van den Eynde F, Tovar-Perdomo S, Daskalakis ZJ. Response, remission and drop-out rates following high-frequency repetitive transcranial magnetic stimulation (rTMS) for treating major depression: a systematic review and meta-analysis of randomized, double-blind and sham-controlled trials. Psychol Med 2014;44(2):225-39.
PUBMED | CROSSREF
43. Machii K, Cohen D, Ramos-Estebanez C, Pascual-Leone A. Safety of rTMS to non-motor cortical areas in healthy participants and patients. Clin Neurophysiol 2006;117(2):455-71.
PUBMED | CROSSREF
44. Rossi S, Hallett M, Rossini PM, Pascual-Leone A; Safety of TMS Consensus Group. Safety, ethical considerations, and application guidelines for the use of transcranial magnetic stimulation in clinical practice and research. Clin Neurophysiol 2009;120(12):2008-39.
PUBMED | CROSSREF
45. Slotema CW, Blom JD, Hoek HW, Sommer IE. Should we expand the toolbox of psychiatric treatment methods to include Repetitive Transcranial Magnetic Stimulation (rTMS)? A meta-analysis of the efficacy of rTMS in psychiatric disorders. J Clin Psychiatry 2010;71(7):873-84.
PUBMED | CROSSREF
46. Janicak PG, O'Reardon JP, Sampson SM, Husain MM, Lisanby SH, Rado JT, et al. Transcranial magnetic stimulation in the treatment of major depressive disorder: a comprehensive summary of safety
experience from acute exposure, extended exposure, and during reintroduction treatment. J Clin Psychiatry 2008;69(2):222-32.
PUBMED | CROSSREF