947
Copyright © 2015 The Korean Society of Fisheries and Aquatic Science pISSN:0374-8111, eISSN:2287-8815
서 론
우리나라의연안은무분별한해안개발과양식어업의증가에 따라연안어장의생산성이저하되고
,
어업기술의발달로인한 남획으로자원량이감소하면서우리나라연근해어업총어획 량은1980
년대이후감소하고있다(Fujita, 1987; Yotsui and Maesako, 1993; MIFFAF, 2008; Choi, 2001).
또한해양환경의 변화로연안의갯녹음현상등으로해조장이축소되어수산동 물의서식장및산란장등이감소하면서(Watanuki and Yama-
moto, 1990; Tsutsui et al., 1996; Choi et al., 2000),
수산생물 의자원회복의필요성이증가하고있다.
이러한자원회복을위 한여러방안중에바다목장사업은수산자원의방류에서어획 에이르기까지자연친화적으로관리하는어업생산시스템으로 인공어초,
해조장등인위적인시설물을설치하여수산생물의 산란장및성육장등을조성하여안정적인수산물생산및공급 을목적으로한다(MOMAF, 2005; MIFFAF, 2008; Lee et al.,
2012).
연안에새로이조성되는인공어초어장은자연암반어장에비해
1.3-2.3
배정도높은자원조성효과를가지며(Kim et
울진바다목장에서 자망으로 어획된 수산자원의 종조성과 계절변동
윤병선·박정호·윤상철
1·양재형
1·이성일
2·김종빈*·최영민
3·손명호
4국립수산과학원 동해수산연구소, 1독도수산연구센터, 2원양자원과, 3고래연구센터, 4제주수산연구소
Seasonal Variations in the Species Composition of Fisheries Resources Caught by Trammel Net in the Uljin Marine Ranching Area, East Sea
Byoung Sun Yoon, Jeong-Ho Park, Sang Chul Yoon1, Jae Hyeong Yang1, Sung-Il Lee2, Jong-Bin Kim*, Young-Min Choi3 and Myoung Ho Sohn4
East Sea Fisheries Research Institute, National Institute of Fisheries Science, Gangneung 25435, Korea
1Dokdo Fisheries Research Center, National Institute of Fisheries Science, Pohang 37709, Korea
2Distant Water Fisheries Resources Research Division, National Institute of Fisheries Science, Busan 46083, Korea
3Cetacean Fisheries Institute, National Institute of Fisheries Science, Ulsan 44780, Korea
4Jeju Fisheries Research Institute, National Institute of Fisheries Science, Jeju 63068, Korea
Variations in the species composition, biomass and size distribution of fisheries resources in the Uljin marine ranch- ing area were investigated using trammel nets at two stations (artificial reef and natural rocky area) from 2009 to 2010. During the survey, a total of 74 species were sampled with a mean density of 132 ind./net and mean biomass of 21.56 kg/net. In the natural rocky area, a total of 45 species were sampled at a mean density of 202 ind./net and mean biomass of 28.81 kg/net, while in the artificial reef area, samples included a total of 56 species, with means of 62 ind./net and 14.30 kg/net. The dominant species, comprising over 3% of the total number of individuals, were Su- berites ficus (30.8%), Ovalipes punctatus (19.2%), Paralichthys olivaceus (11.7%), Pleuronectes herzensteini (4.7%), Kareius bicoloratus (3.5%), Pseudopleuronectes yokohamae (3.5%) and Eopsetta grigorjewi (3.0%). The dominant species, in terms of biomass, comprising over 5% of the total biomass, were P. olivaceus (22.1%), S. ficus (18.7%), O. punctatus (7.2%), Hexagrammos otakii (6.6%), P. yokohamae (5.7%), K. bicoloratus and P. herzensteini (5.3%).
A cluster analysis and non-metric multidimensional scaling (nMDS) analysis based on the Bray-Curtis similarity of fourth root transformed data for number of species and individuals, was divided into two groups: the artificial reef area (group A) and the natural rocky area (group B).
Key words: Uljin marine ranching area, Trammel nets, Fisheries resources, Artificial reef, Natural rocky
This is an Open Access article distributed under the terms of the Creative Commons Attribution Non-Commercial Licens (http://creativecommons.org/licenses/by-nc/3.0/) which permits unrestricted non-commercial use, distribution, and reproduction in any medium, provided the original work is properly cited.
http://dx.doi.org/10.5657/KFAS.2015.0947 Korean J Fish Aquat Sci 48(6) 947-959, December 2015
Received 11 November 2015; Revised 25 November 2015; Accepted 2 December 2015
*Corresponding author: Tel: +82. 33. 660. 8521 Fax: +82. 33. 661. 8513 E-mail address: [email protected]
al., 1999),
저층의영양염류를표층으로용승시켜기초생산력 을증대시킨다(Grove and Sonu, 1985).
울진바다목장에서는수산자원의자원량을 증대시킬목적으 로연안에해군숙영정
,
팔각반구형강제어초,
원통2
단강제어초, 2
단상자형강제어초등다양한인공어초를투하하고,
조피볼락(Sebastes schlegelii),
쥐노래미(Hexagrammos otakii)
와같이암반주변에정착하여서식하는어류와강도다리
(Platichthys
stellatus),
넙치(Paralichthys olivaceus)
와같은연안의저층에 서식하는 어류를지속적으로방류하고 있다(MIFFAF, 2008;
2009).
인공어초효과를평가하기위해
,
과학어군탐지기를이용한어 군량측정(Hwang et al., 2004),
스쿠버다이빙을통한수중촬영 기법(Edgar and Barrett, 1997; Guidetti et al., 2002; Akamatus et al., 2003; Oh et al., 2010),
음향소나(Kang et al., 2008; Kim et al., 2011)
를이용한어류군집조사,
시험어구를이용한어획 시험조사(Lee and Kang, 1994; Hwang and Jang, 2014)
등다 양한방법으로연구가진행되고있다.
본연구는울진바다목장에서인공어초의효율성을파악하기 위하여인공어초가시설된해역과자연암반이분포하는해역에 서어획시험을실시하여
,
공간적특성에따른생물군집의차이 와이들의계절별변화를분석하였다.
재료 및 방법
조사정점 및 방법
울진바다목장해역은경북울진군근남면구산리
(
자연암반해역
)
에서후포면후포리일대에20 km
2면적으로조성되어있는데
(Fig. 1),
직산리,
월송리및구산리일대의낮은수심의퇴적물에는입자의크기가큰사질
(
평균입도1.5Ø)
이높은함량을보이는곳으로다양한인공어초가시설되어있다
(Paik et al., 2007; MIFFAF, 2008).
이조사는2009
년에는5
월, 7
월, 9
월과11
월, 2010
년에는3
월, 6
월, 9
월과12
월에각각조사를실시하 였으며,
자연암반정점은구산연안의수심25-35 m,
인공어초정점은직산연안의수심
15-20 m
의해역이었다.
어획시험조사는정점당삼중자망
10
폭씩사용하였으며,
그물높이2 m,
내 망망목85 mm,
외망망목485 mm,
그리고폭당길이는60 m
였 다.
표층과저층수온을측정하기위해양망시YSI 6600
을이 용하여측정하였다.
채집된생물은실험실로운반하여동정,
분 류하였고채집된생물들은체장은0.1 cm,
중량은0.1 g
단위까 지측정하였다.
어류동정은Kim et al. (2005),
갑각류는Kim (1973, 1977)
과NFRDI (2001)
그리고연체동물은Min et al.
(2004)
을참고하였다. 생태지수 및 군집분석
삼중자망에의해채집된생물군집의구조를이해하기위하여 출현종수및개체수자료를이용하여종다양도지수
(H’, Pio- lou, 1977)
를분석하였다.
삼중자망에의해채집된생물군집의 정점별·
월별유사성을파악하기위하여정점별·
월별출현종수(C
ij)
와개체수(S
i, S
j)
를바탕으로하는Bray-Curtis
유사도지수(BC; Bray-Curtis, 1957)
를사용하여유사도를백분율(%)
로나 타내었으며,
유사도분석에서종수와개체수사이의자료간편 중을피하기위하여fourth root
로자료를변환하여사용하였다.
각각의유사도를바탕으로정점별·
월별유사성의차이를분석 하기위하여수지도(dendrogram)
를작성하여 집괴분석(clus- ter analysis)
을실시하였으며,
그룹간연결방식에는complete linkage
방식을사용하였다.
또한계절별,
정점별로분리된그룹 간의유사성을2
차원공간에표시하는다차원척도분석(nMDS, non-metric Multi Dimensional Scaling)
을실시하였다.
군집분 석결과분리된정점군사이의생물군집의차이를유발하는종 을 분석하고 이들이 군집의차이에기여하는 정도를분석하기 위하여
SIMPER
분석을 실시하였으며,
이들의 분석에는PRIMER V5.0
을사용하였다(Clarke and Warwick, 2001).
인공어초와자연암반해역에서연도별
,
해역별생물의종수,
개체수,
생체량,
종다양도의차이를분석하기위해서SPSS ver- sion 12.0 for Windows
로paired t-test
를실시하였다.
또한주 요우점종들의년도별체장의차이의분석을위해서는t-test
분 석을실시하였다.
결 과
수온
조사 기간 동안 울진바다목장 해역의 표층수온은 자연암 반에서
2010
년3
월과7
월에각각8.6℃
와8.3℃
로가장낮았 고, 2009
년과2010
년9
월에각각22.8℃
와22.4℃
로가장높 Fig. 1. Map showing the sampling stations of fisheries resourcesby trammel net from 2009 to 2010 in the Uljin marine ranching area, Korea.
았다
(Fig. 2).
인공어초에서도2010
년3
월과7
월에각각8.5℃
와
8.3℃
로가장낮았고, 2009
년과2010
년9
월에각각22.8℃
와
22.6℃
로 정점간 차이가 유의하지 않았다(paired t-test, P>0.05).
저층수온은자연암반에서2010
년3
월과7
월에각각8.4℃
와8.3℃
로가장낮았고, 2010
년9
월에20.7℃
로가장높 았다(Fig. 2).
인공어초에서도2010
년3
월과7
월에각각8.4℃
와
8.2℃
로가장낮았고, 2010
년9
월에22.1℃
로정점간차이가 유의하지않았다(paired t-test, P>0.05).
출현 종수
2009
년에서2010
년까지울진바다목장해역의자연암반과인공어초에서출현한생물은총
74
종으로어류가39
종으로가장 많았고,
연체동물12
종,
극피동물10
종,
절지동물7
종,
척삭동 물3
종,
해면동물2
종과자포동물1
종의순으로출현하였다.
정점별로출현종수를살펴보면자연암반에서는총
45
종(
평 균13.4
종),
인공어초에서는총56
종(
평균16.6
종)
이출현하여 정점에따른차이는없었다(Fig. 3, paired t-test, P>0.05).
연도 별종수의변화를살펴보면자연암반에서는2009
년에총38
종 이출현했던반면2010
년에는총21
종으로감소하였고,
인공어 초에서도2009
년에는44
종, 2010
년에는33
종이출현하여종수 가감소했다.
계절별종수의변화를보면자연암반에서는2010
년9
월, 2009
년9
월과2010
년12
월에각각9
종으로가장적었 고, 2009
년11
월에25
종으로가장많았다.
반면인공어초에서 는2009
년5
월과2010
년6
월에10
종으로종수가적었고, 2009
년9
월에24
종으로가장많았다.
개체수
조사기간 동안출현한동물의평균개체수는
132
마리였는데
,
자연암반에서는평균202
마리,
인공어초에서는평균62
마 리로자연암반에서어획된개체수가유의하게많았다(Fig. 3;
Table 1, 2; paired t-test, P=0.007).
분류군별개체수의출현양 상을살펴보면자연암반에서는해면동물이평균77
마리로가 장많았고,
어류와절지동물이각각71
마리와49
마리였다.
인 공어초에서는어류가평균40
마리로가장많았고,
극피동물 과 해면동물이각각11
마리, 4
마리로자연암반에서어류와 절지동물의개체수가유의하게높았다(paired t-test, P=0.030,
P=0.029).
개체수의연도별변화를살펴보면자연암반에서는2009
년에는평균180
마리, 2010
년에는225
마리로증가한경 향을보였지만해면동물의개체수만증가했고다른분류군에서 는개체수의변화가없었다.
인공어초는2009
년에평균61
마 리, 2010
년에는64
마리로유의한차이를보이지않았다(paired
Fig. 2. Seasonal variations of water temperature at artificial reef and natural rock area in Uljin marine ranching area from 2009 to 2010.
Fig. 3. Temporal variations of the number of species, abundance and biomass of fisheries resources caught by trammel net in the Uljin marine ranching area from 2009 to 2010.
Number of Species
5 10 15 20 25 30
Artificial reef Natural Rock
Abundance (Ind./net)
0 100 200 300 400
(A)
(B)
Year
May Jul Sep Nov Mar Jun Sep Dec
Biomass (kg/net)
0 10 20 30 40 50 (C)
2009 2010
Table 1. Seasonal variation of fisheries resources at artificial reef area in in the Uljin marine ranching area from 2009 to 2010 Species
2009 2010
March July September November March June September December Mean
N W N W N W N W N W N W N W N W N W
Porifera
Callyspongia sp. 2 0.1 0.3 0.0
Suberites ficus 1 0.0 3 0.3 9 1.0 1 0.1 18 1.9 4.0 0.4
Mollusca
Aplysia kurodai 1 0.2 0.1 0.0
Ceratostoma burnetti 2 0.2 1 0.1 0.4 0.0
Chlamys swifti 2 0.2 0.3 0.0
Glossaulax didyma hayashii 1 0.1 0.1 0.0
Mytilus coruscus 2 0.3 0.3 0.0
Neptunea cumingii 2 0.2 1 0.0 0.4 0.0
Arthropoda
Dromia wilsoni 3 0.1 0.4 0.0
Ovalipes punctatus 15 2.2 1 0.0 3 0.5 2.4 0.3
Pugettia quadridens 2 0.0 0.3 0.0
Echinodermata
Aphelasterias japonica 3 0.0 2 0.2 2 0.0 2 0.1 3 0.1 15 1.3 3.4 0.2
Asterias amurensis 6 0.4 1 0.1 3 0.3 2 0.2 4 0.6 2.0 0.2
Asterina bartheri 3 0.1 0.4 0.0
Asterina pectinifera 6 0.5 2 0.2 1.0 0.1
Henricia leviuscula 1 0.1 0.1 0.0
Lethasterias fusca 6 0.4 0.8 0.0
Plazaster borealis 2 0.4 2 0.6 1 0.3 1 0.6 3 0.1 1.1 0.2
Solaster dawsoni 1 0.0 0.1 0.0
Stichopus japonicus 1 0.2 2 0.3 1 0.2 3 1.1 0.9 0.2
Strongylocentrotus nudus 3 0.3 7 0.6 2 0.2 3 0.5 1.9 0.2
Chordata
Chelyosoma dofleini 2 0.1 4 0.3 3 0.3 1.1 0.1
Halocynthia roretzi 1 0.1 0.1 0.0
Styela clava 1 0.0 6 0.1 0.9 0.0
Pisces
Alcichthys alcicornis 3 0.4 0.4 0.0
Aptocyclus ventricosus 1 1.4 0.1 0.2
Chelidonichthys spinosus 16 3.7 2 0.4 5 1.2 2 1.0 6 1.2 6 2.2 8 1.9 5 1.3 6.3 1.6
Clidoderma asperrimum 1 0.1 0.1 0.0
Eopsetta grigorjewi 1 0.1 3 0.3 1 0.1 0.6 0.1
Fistularia commersonii 1 0.1 0.1 0.0
Hexagrammos agrammus 1 0.1 0.1 0.0
Hexagrammos otakii 2 1.9 2 0.6 4 1.2 10 6.9 5 2.1 7 2.7 3 1.6 10 5.6 5.4 2.8
Kaiwarinus equula 1 0.1 0.1 0.0
Kareius bicoloratus 2 0.2 9 2.1 4 1.8 1 1.1 2.0 0.7
t-test, P>0.05).
계절별개체수의변화를보면자연암반에서는2009
년11
월에80
마리로가장적었고, 2010
년3
월에376
마 리로가장많았다.
인공어초에서는2009
년11
월과2010
년6
월 에각각44
마리와41
마리로가장적었고2010
년12
월에95
마 리로가장많았다.
생체량
조사기간 동안출현한동물의평균생체량은
21.63 kg
이었는데
,
자연암반에서는 평균28.81 kg,
인공어초에서는 평균14.44 kg
으로자연암반에서생체량이많았다(Fig. 3; Table 1, 2; paired t-test, P=0.002).
분류군별생체량의차이를살펴보 면자연암반에서는어류가평균17.53 kg
으로가장많았고,
해 면동물이7.62 kg,
절지동물이2.85 kg
이었다.
인공어초에서는 어류가평균12.14 kg
으로가장많았고,
극피동물이1.25 kg,
해면동물이0.43 kg
이었으며,
다른분류군에서정점에따른차 이는없었지만어류와절지동물은자연암반에서생체량이유 의하게높았다(paired t-test, P=0.018, P=0.032).
생체량의연 도별변화를살펴보면자연암반에서는2009
년에는평균24.34 kg, 2010
년에는33.28 kg
으로차이가유의하지않았다(paired t-test, P>0.05).
인공어초는2009
년에평균11.82 kg, 2010
년에는
17.07 kg
으로생체량이증가하였는데,
특히어류생체량의증가가높았다
(paired t-test, P=0.023).
계절별생체량의변화를 보면자연암반에서는2009
년11
월에19.65 kg
으로가장적었 고, 2010
년4
월에45.06 kg
으로가장많았다.
인공어초에서는2009
년9
월에7.06 kg
으로가장적었고2010
년12
월에26.26 kg
으로가장많았다.
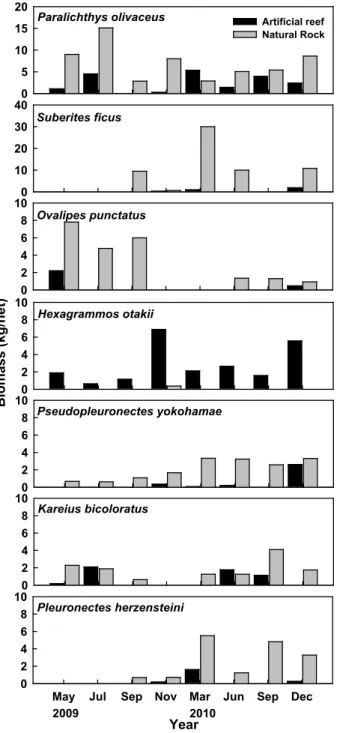
우점종
조사기간동안채집된생물들중에서전체개체수의
3%
이상 을차지하는주요우점종은총7
종으로어류가5
종,
절지동물과 해면동물이각각1
종으로이들개체수의합은전체개체수의76.6%
를차지했다.
집게코르크해면(Suberites ficus)
은평균41
마리(30.8%)
로가장우점했으며,
깨다시꽃게(Ovalipes punc- tatus)
는25
마리(19.2%)
로차우점했다.
다음으로는가자미류가 우점했는데넙치(P. olivaceus)
가평균16
마리(11.7%),
참가자 미(Pseudopleuronectes herzensteini) 6
마리(4.7%),
돌가자미(Kareius bicoloratus)
와 문치가자미(Pseudopleuronectes yo- kohamae)
가각각5
마리(3.5%),
물가자미(Eopsetta grigorjewi)
는4
마리(3.0%)
의순으로어획되었다(Fig. 4).
정점별우점종 을살펴보면 자연암반은전체우점종과큰차이를보이지않 았지만인공어초에서는넙치다음으로성대(Chelidonichthys spinosus)
가평균6
마리로차우점했고,
쥐노래미(H. otakii)
와Lophius litulon 2 0.2 6 3.5 1.0 0.5
Microstomus achne 1 0.3 0.1 0.0
Monocentris japonica 2 0.1 0.3 0.0
Okamejei kenojei 1 0.8 2 1.5 0.4 0.3
Oplegnathus fasciatus 1 0.0 0.1 0.0
Oplegnathus punctatus 1 0.1 0.1 0.0
Paralichthys olivaceus 7 1.1 26 4.5 1 0.3 8 5.4 7 1.4 14 4.0 3 2.4 8.3 2.4
Paraplagusia japonica 2 0.4 0.3 0.0
Platichthys stellatus 2 0.1 8 0.6 1.3 0.1
Platycephalus indicus 1 0.6 0.1 0.1
Pseudopleuronectes herzensteini 1 0.2 11 1.6 1 0.3 1.6 0.3
Pseudoblennius percoides 1 0.5 0.1 0.1
Pseudopleuronectes yokohamae 2 0.4 1 0.1 1 0.2 7 2.6 1.4 0.4
Sebastes pachycephalus 1 0.1 0.1 0.0
Sebastes schlegelii 2 0.7 10 3.5 5 2.1 1 0.6 2 0.6 2.5 0.9
Sebastes thompsoni 2 0.3 1 0.1 12 0.9 4 0.5 4 0.5 8 0.9 5 0.6 4.5 0.5
Sebastes zonatus 1 0.2 2 0.2 3 1.2 0.8 0.2
Seriola quinqueradiata 5 3.4 3 2.1 1.0 0.7
Sillago japonica 1 0.0 0.1 0.0
Takifugu porphyreus 1 0.5 0.1 0.1
Tribolodon hakonensis 2 1.3 0.3 0.2
Zeus faber 1 0.3 0.1 0.0
Total 54 10.5 80 12.4 64 7.1 44 17.3 59 15.3 41 12.8 61 13.9 95 26.3 62.3 14.4
Table 2. Seasonal variation of fisheries resources at natural rocky area in in the Uljin marine ranching area from 2009 to 2010 Species
2009 2010
March July September November March June September December Mean
N W N W N W N W N W N W N W N W N W
Porifera
Suberites ficus 96 9.5 5 0.6 311 30.0 101 10.0 105 10.8 77.3 7.6
Cnidaria
Hormathia andersoni 2 0.0 0.3 0.0
Mollusca
Aplysia kurodai 1 0.1 0.1 0.0
Glossaulax didyma ampla 1 0.1 0.1 0.0
Neptunea arthritica 1 0.1 1 0.0 0.3 0.0
Neptunea cumingii 4 0.4 0.5 0.0
Octopus ocellatus 3 0.3 1 0.2 0.5 0.1
Rapana venosa venosa 1 0.1 0.1 0.0
Sepia esculenta 1 0.4 0.1 0.1
Siphonalia fusoides 2 0.0 0.3 0.0
Arthropoda
Blepharipoda liberata 1 0.0 0.1 0.0
Charybdis japonica 1 0.2 0.1 0.0
Ovalipes punctatus 81 7.8 68 4.8 149 6.0 1 0.0 32 1.4 33 1.3 22 0.9 48.3 2.8
Paguridae spp. 2 0.0 0.3 0.0
Portunus trituberculatus 2 0.4 0.3 0.0
Aphelasterias japonica 2 0.2 0.3 0.0
Asterias amurensis 3 0.2 9 1.8 1.5 0.2
Asterina pectinifera 8 0.4 1.0 0.1
Stichopus japonicus 1 0.1 5 0.9 1 0.1 0.9 0.1
Strongylocentrotus nudus 1 0.4 2 0.5 0.4 0.1
Pisces
Acanthopagrus schlegelii 1 1.7 0.1 0.2
Alcichthys alcicornis 7 0.6 0.9 0.1
Chelidonichthys spinosus 4 0.7 0 0.0 1 0.4 0.6 0.1
Clidoderma asperrimum 2 0.3 3 0.4 0.6 0.1
Eopsetta grigorjewi 3 0.4 3 0.3 1 0.1 12 1.5 6 1.2 11 1.8 15 2.7 8 2.5 7.4 1.3
Fistularia commersonii 2 0.4 0.3 0.1
Gymnocanthus herzensteini 1 0.0 0.1 0.0
Hexagrammos otakii 2 0.4 0.3 0.0
Hippoglossoides pinetorum 1 0.1 2 0.3 0.4 0.0
Kareius bicoloratus 12 2.3 20 1.9 3 0.6 6 1.3 6 1.3 10 4.1 3 1.8 7.5 1.6
Limanda schrencki 1 0.0 0 0.0 0.1 0.0
Lophius litulon 2 3.6 1 0.4 2 3.3 0.6 0.9
Paralichthys olivaceus 43 9.0 69 15.1 8 2.9 11 8.0 6 2.9 20 5.1 13 5.4 12 8.6 22.8 7.1
Paraplagusia japonica 1 0.2 15 2.8 2.0 0.4
Platichthys stellatus 12 1.6 20 2.5 2 0.2 4 1.1 2 1.1 5.0 0.8
불볼락
(Sebastes thompsoni)
이각각5
마리로우점하였다.
조사기간 동안 채집된생물들중에서 전체생체량의
5.0%
이상을차지하는 주요 우점종을분석한 결과총
7
종으로어 류가5
종,
해면동물과절지동물이각각1
종으로이들의생체 량합은전체생체량의71.0%
를차지했다.
넙치는평균4.8 kg
(22.1%)
으로 생체량이 가장 높았고,
집게코르크해면은 평균4.0 kg (18.7%),
깨다시꽃게는1.6 kg (7.2%),
쥐노래미는1.4 kg (6.6%),
문치가자미는1.2 kg (5.7%),
돌가자미와참가자미 는각각1.1 kg (5.3%)
의생체량을보였다(Fig. 5).
정점별우점 종을살펴보면자연암반은쥐노래미를제외한6
종이생체량우 점종이었지만,
인공어초에서는쥐노래미2.8 kg (19.7%),
넙치2.4 kg (16.7%),
성대1.5 kg (10.2%)
와조피볼락0.9 kg (6.6%)
이생체량우점종으로정점간차이를보였다.
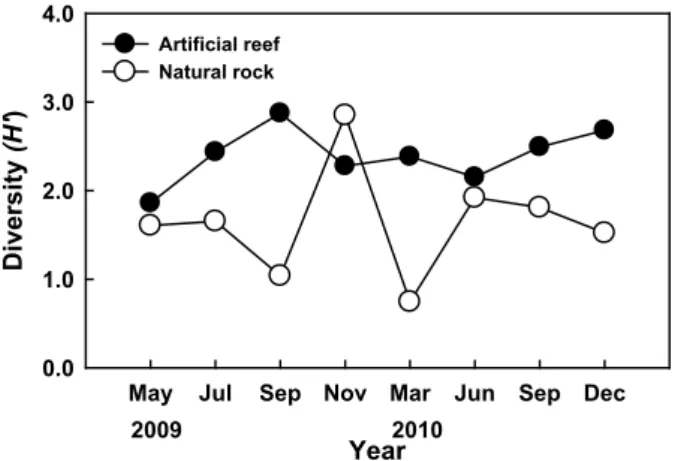
군집분석
조사기간동안출현한종수와개체수를바탕으로계절별
,
정점별종다양도지수를분석한결과평균
2.02
을나타내었는데,
자연암반은평균
1.64,
인공어초는2.40
으로인공어초에서종다양도가유의하게높았다
(Fig. 6; t-test, P=0.009).
조사기간동 안출현한생물의종수와개체수를바탕으로계절별,
정점별유 사도를구하고집괴분석을실시하여생물군집의유사성을분석 한결과생물군집은크게2
개의그룹으로구분되었다(Fig. 7).
그룹
A
는인공어초에서조사된8
번의조사와2009
년11
월의 자연암반조사가포함되었고,
그룹B
는2009
년11
월을제외한 자연암반에서실시한7
번의조사로구분되었다.
군집분석에서 그룹A
와그룹B
군집의차이에대한종기여도를분석하기위하여
SIMPER
분석을실시한결과종기여도에서2%
이상을차지하는종들은총
10
종으로나타났다(Table 3).
집게코르크해 면의비유사도에대한종기여도는29.56%
로그룹A
에서는평 균4
마리가출현했던반면그룹B
에서는87.6
마리로그룹간 차이를보였다.
깨다시꽃게는23.17%
의기여도를보였는데,
그 룹A
에서는평균2.4
마리가출현했던반면그룹B
에서는55.0
마리의개체수를나타냈다.
넙치,
참가자미,
돌가자미,
물가자 미,
문치가자미와강도다리(P. stellatus)
와같은가자미류는그 룹B
에서더많은개체수가출현했다.
반면성대와쥐노래미는 각각2.58%
과2.39%
의기여도를보였는데,
그룹A
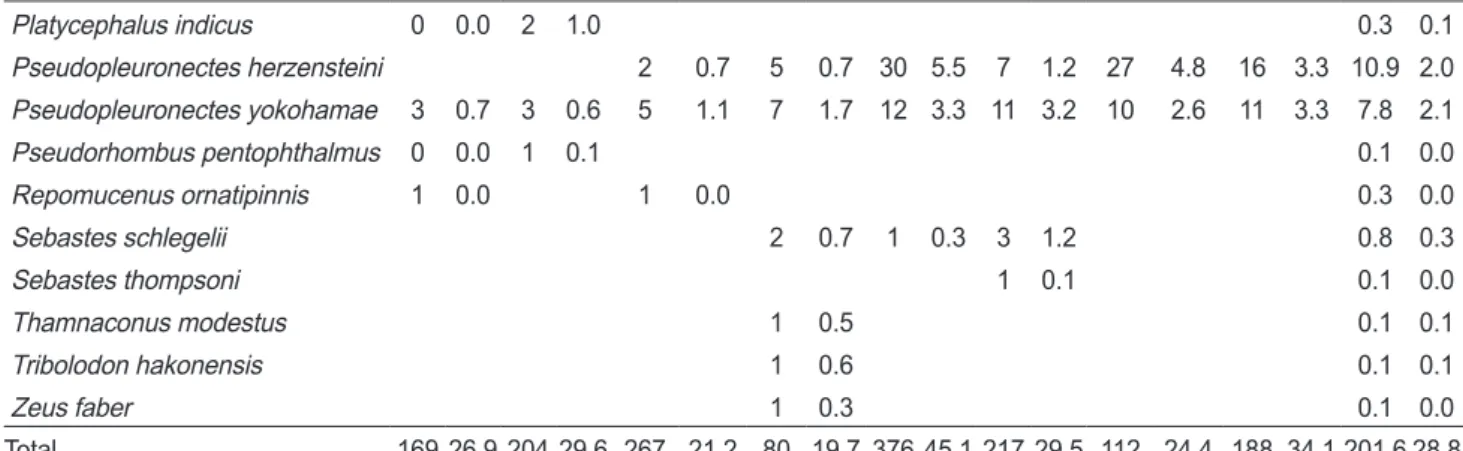
에서각각Platycephalus indicus 0 0.0 2 1.0 0.3 0.1
Pseudopleuronectes herzensteini 2 0.7 5 0.7 30 5.5 7 1.2 27 4.8 16 3.3 10.9 2.0 Pseudopleuronectes yokohamae 3 0.7 3 0.6 5 1.1 7 1.7 12 3.3 11 3.2 10 2.6 11 3.3 7.8 2.1
Pseudorhombus pentophthalmus 0 0.0 1 0.1 0.1 0.0
Repomucenus ornatipinnis 1 0.0 1 0.0 0.3 0.0
Sebastes schlegelii 2 0.7 1 0.3 3 1.2 0.8 0.3
Sebastes thompsoni 1 0.1 0.1 0.0
Thamnaconus modestus 1 0.5 0.1 0.1
Tribolodon hakonensis 1 0.6 0.1 0.1
Zeus faber 1 0.3 0.1 0.0
Total 169 26.9 204 29.6 267 21.2 80 19.7 376 45.1 217 29.5 112 24.4 188 34.1 201.6 28.8
Table 3. Species contributions to dissimilarity between Group A and Group B in the Uljin marine ranching area from 2009 to 2010
Rank Scientific name Average abundance (Ind./net) Contribution
(%) Cumulation (%)
Group A Group B
1 Suberites ficus 4.0 87.6 29.56 29.56
2 Ovalipes punctatus 2.4 55.0 23.17 52.73
3 Paralichthys olivaceus 8.3 24.4 8.86 61.59
4 Pseudopleuronectes herzensteini 1.6 11.7 5.18 66.77
5 Kareius bicoloratus 2.0 8.6 3.38 70.15
6 Eopsetta grigorjewi 0.6 6.7 3.04 73.19
7 Pseudopleuronectes yokohamae 1.4 7.9 3.01 76.20
8 Chelidonichthys spinosus 6.3 0.6 2.58 78.78
9 Platichthys stellatus 1.3 5.4 2.53 81.31
10 Hexagrammos otakii 5.4 0.0 2.39 83.70
6.3
마리와5.4
마리로그룹B
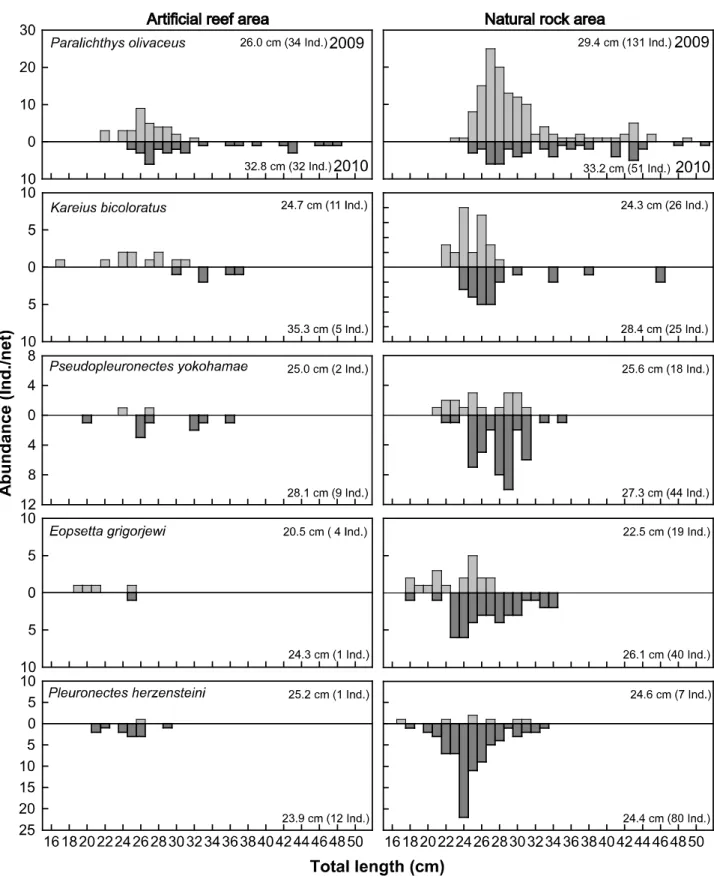
에비해더많았다. 체장 조성
조사기간동안개체수에서우점했던종들의계절별
,
정점별 로체장분포의변화를분석한결과넙치는자연암반지역에서 는2009
년에는평균29.4 cm
에서2010
년에는33.2 cm
로증가했으며
(Fig. 8; t-test, P=0.000),
인공어초정점에서도2009
년 에는평균26.0 cm
에서2010
년에는32.8 cm
로증가했다(Fig.
7; t-test, P=0.000).
돌가자미는자연암반지역에서는2009
년에 는평균24.3 cm
에서2010
년에는28.4 cm
로증가했고(t-test, P=0.002),
인공어초정점에서도2009
년에는평균24.7 cm
에서2010
년에는35.3 cm
로증가했다(t-test, P=0.001).
문치가자미 Fig. 4. Temporal variations of the abundance of seven dominantspecies in the Uljin marine ranching area from 2009 to 2010.
0 100 200 300 400
Year
May Jul Sep Nov Mar Jun Sep Dec
Abundance (Ind./net)
0 5 10 15 20
Artificial reef Natural Rock
2009 2010
0 5 10 15 2005 1015 2025 300 10 20 30 400 20 40 60 80 1000 50 100 150 200
Suberites ficus
Ovalipes punctatus
Paralichthys olivaceus
Pleuronectes herzensteini
Kareius bicoloratus
Pseudopleuronectes yokohamae
Eopsetta grigorjewi
Fig. 5. Temporal variations of the biomass of seven dominant spe- cies in the Uljin marine ranching area from 2009 to 2010.
0 5 10 15 20
Year
May Jul Sep Nov Mar Jun Sep Dec
Biomass (kg/net)
0 2 4 6 8 10
Artificial reef Natural Rock
2009 2010
0 2 4 6 8 100 2 4 6 8 100 2 4 6 8 100 2 4 6 8 100 10 20 30
40 Suberites ficus
Ovalipes punctatus
Pleuronectes herzensteini Kareius bicoloratus
Pseudopleuronectes yokohamae Paralichthys olivaceus
Hexagrammos otakii