Print ISSN: 1738-3110 / Online ISSN 2093-7717 http://dx.doi.org/10.15722/jds.16.12.201812.13
The Potential Impact of Service Quality Uncertainty and Retail Pricing Strategies on Consumer Purchase Intention *
Dieu Hoa Nguyen
**, Euihyeon Jeong
***, Jaekwon Chung
****Received: November 14, 2018. Revised: November 23, 2018. Accepted: December 05, 2018.
Abstract
Purpose - Because it is not possible to assess the quality of service products before experiencing them, one feature of a service product is quality uncertainty; hence consumers may react sensitively to pricing. It is necessary to investigate how different pricing strategies affect consumer purchase intention depending on the level of service quality uncertainty.
Research design, data, and methodology – The authors have investigated the potential impact of the level of service quality uncertainty, price discount rate and presentation method on consumer purchase intention. A play was selected as an experimental stimulus, and Vietnamese consumers were surveyed to verify the hypotheses.
Results - When uncertainty regarding service quality is low, consumer purchase intention is higher when the price discount rate is high or when the price is low. When uncertainty regarding service quality is high, if the normal price, discount rate, and discounted price are presented simultaneously, consumer purchase intention is higher when the price discount rate is low, but when only the discounted price is presented, purchase intention is higher when the price discount rate is high.
Conclusions - The results of this study can provide valuable practical implications for pricing for service products with quality uncertainty.
Keywords: Consumer Purchase Intention, Service Product, Service Quality Uncertainty, Pricing Strategy, Retail Pricing.
JEL Classifications: M31, D40, D80.
1. Introduction
Pricing strategy, such as price discounting and bonus packs, is one of the most effective and widely used ways to promote purchasing because it improves consumers’
perception of utility(Chen, Marmorstein, Tsiros, & Rao, 2012).
For service products with quality uncertainty, it is difficult for consumers to evaluate value prior to experiencing the service, hence pricing managers often face difficulties in setting prices for them. Consumers are highly likely to rely on external clues such as price in order to evaluate quality
* This paper was modified and developed from the master’s thesis of the first author
** First Author, Ha Linh International Joint Stock Company, No.26 Lane 282/1, Kim Giang St., Dai Kim Ward, Hoang Mai District, Hanoi, Vietnam.
*** Co-Author, Kookmin University, 77 Jungneung-ro Sungbook-ku, Seoul, Korea 136-702
**** Corresponding Author, Assistant Professor of Marketing, College of Business Administration, Kookmin University, 77 Jungneung-ro Sungbook-ku, Seoul, Korea 136-702, Tel: +82-2-910-5612, E-mail: [email protected]
when criteria for product assessment are uncertain, and quality uncertainty tends to be high for intangible products such as services(Bearden & Shimp, 1982). In addition, even when the price is the same, a consumer’s purchase intention regarding a product may vary depending on the price presentation method. Prior studies on the relative effects of price discount presentation method were conducted based on the prospect theory of Kahneman (1979). Many prior studies examined the effects of price discounts on customer purchase intention(Teng, 2009;
Ailawadi, Neslin, & Gedenk, 2001).
However, few studies have investigated both service quality uncertainty and discount presentation methods simultaneously. Therefore, the present study is aimed at identifying the effects of quality uncertainty and price discount presentation methods on purchase intention, that is, the impacts of the absence or presence of information related to service through customer reviews (high/low), price level (expensive/inexpensive), and price discount rate (high/
low) on purchase intention. The results of present study can provide valuable practical implications for the pricing of service products that have uncertainty regarding quality.
2. Literature review
2.1. Price Discount
Prior studies have verified that price discounts can stimulate consumer purchase intention and have a direct effect on sales. In other words, price discounts encourage purchasing. Price discounting contributes to product purchase by stimulating consumer purchasing desire, which results in the purchase of more products than usual and an increase in consumption(Chung & Li, 2014). According to Kotler and Keller(2011), price discounting is one of the most general and effective methods to encourage consumer purchase intention. Indeed, price discounts promote purchases by increasing consumers’ perception of utility. Companies generally choose to discount price for gaining a competitive edge in the market through the establishment of price position differentiation with respect to competitors.
One advantage of price discounting is that it derives positive emotions from consumers(Van Heerde, Gupta, &
Wittink, 2003). While discounting can lead to more sales, excessive price discounting may have negative effects. A large price discount is likely to make consumers doubt the quality of the product and reduce the overall brand image, whereas a small discount may not affect the purchase intentions of consumers as many consumers are unlikely to perceive the value of the price discount(Abrams, 1964). A study Van Heerde et al.(2003) reveals that a repetitive price discount may delay time to purchase as customers tend to predict product promotional activities. If a product is offered at a more highly discounted price than expected, consumers sense some danger regarding the performance and quality of the product and thus hesitate to purchase the product (Grewal, Marmorstein, & Sharma, 1996). In other words, a price discount above a certain level is likely to have a negative impact on consumer purchase intention as consumers sense some risk involved in the product’s quality.
In short, an appropriate level of price discount, not too low nor too high, improves customer purchase intention(Grewal et al., 1996).
Accordingly, the present study is aimed at identifying ways in which the effects of the level of price discount on consumer purchase intention vary with the level of quality uncertainty.
2.2. Presentation Methods of Discounted Price
Even when the price discount level is the same, consumers may perceive the discount level differently depending on the price discount presentation method.
Produced an advertisement for an unbranded product and presented information related to price in different ways (normal price and discounted price/normal price and discount rate/discounted price). Among these three presentation methods, presentation of the normal price and the
discounted price simultaneously derived the most positive responses from consumers. Krum and Keiser(1976) compared the effects of the presentation of discounted price alone and the presentation of both normal price and discounted price on consumer perception, and the latter was found to provide a more positive effect. This suggests that the presentation of both discounted price and normal price is more effective at improving consumer perception of savings than the presentation of discounted price alone.
DelVecchio, Krishnan, and Smith(2007) compared the effects of the presentation of discounted price and the presentation of discount rate (‘percentage-off vs. cents-off’) on consumer purchasing attitudes, and the results revealed that the presentation of discounted price had a more positive effect on the purchasing attitudes of consumers than the presentation of discount rate. The present study expands on these previous studies by focusing on the effects on consumer purchase intention yielded by the presentation of normal price, discount rate, and discounted price compared to the presentation of discounted price alone.
2.3. Service Quality and Quality Uncertainty
Service quality is a measure of how well the delivered service matches customer expectations. In other words, a satisfactory service quality level can be achieved when the recognized result is greater than the anticipated expectation of consumers(Parasuraman, Zeithaml, & Berry, 1988). The quality of service affects perceived value and customer satisfaction(Kim & Shim, 2017; Niu & Lee, 2018).
Service is essentially intangible and refers to all activities provided by a company to meet the needs of consumers through any form of exchange(Wilson, Zeithaml, Bitner, &
Gremler, 2012). According to Lupton(2005), uncertainty regarding product quality is a normal phenomenon in every market. The major cause of uncertainty related to product quality is a lack of information regarding the product or service, and the resulting quality uncertainty may have a negative effect on decision-making. Funtowicz and Ravetz (1990) define uncertainty not as a lack of knowledge but as an absence of knowledge and trust. Further, they state that having inadequate information, such as inaccuracy, leads to uncertainty.
Uncertainty prior to the purchase of products or services is related to a lack of information(Garner, 1962). Before purchasing a service, quality uncertainty occurs due to insufficient or inaccurate information(Murray, 1991). In particular, the degree of psychological uncertainty that occurs due to the intangibility of a service raises the perceived risk.
Service providers may make various efforts to reduce such anxiety, but anxiety regarding service quality does not easily disappear. Even if the service is provided to consumers via a service standardization process, service quality remains inconsistent due to natural characteristics such as non-separability and variability(Murray, 1991).
2.4. Purchase Intention
The topic of consumer purchase intention has received attention in literature of marketing field (Ren & Kang, 2018).
Consumers’ perception of price, quality, and value affects purchase intention (Grewal, Bakerv, & Borin, 1998), and consumers may discontinue purchasing due to the influence of factors in the external environment during the process of purchase. One of the best ways to predict consumer purchasing behavior is to measure the intention to implement a purchase(Fishbein & Ajzen, 1975). According to Kotler(2000), a consumer purchase occurs when it is stimulated by external factors, and a purchase decision is made based on a consumer’s personal characteristics.
Consumer purchase intention is formed by various attributes such as the brand image of a product, price, and product reviews. The present study was conducted assuming that purchase intention represents the intensity of the purchasing need, which is influenced by consumers’ attitudes toward service, the possibility of purchase, and other external factors.
3. Hypotheses
3.1. Effects of Price Discount Rate and Quality Uncertainty on Purchase Intention
Price is generally one of the most significant factors in consumers’ purchase decisions(Gupta & Cooper, 1992), and significantly influences consumer satisfaction(Chung & Li, 2013) which also affects customer loyalty(Shin, Hwang, Lee,
& Cho, 2015). Perceived quality has a significant effect on purchases as well(Thaichon, Lobo, & Mitsis, 2014). Quality uncertainty can increase consumers’ perception of risk and has a negative effect on purchase intention(Pavlou, Liang, &
Xue, 2007). For service products, in particular, consumers are highly likely to rely on external clues such as price when uncertainty about quality is high and the criteria for assessment are unclear. A study by Gerstner(1985) reveals that consumers, when internal clues such as knowledge of a product are insufficient, tend to assess a product based on its price, where the higher the price, the higher the perception of quality. As a result, price can be used as a tool to assess product or service quality in such situations.
In addition, if the price discount rate is perceived to be too high, certainty regarding product value is reduced and purchase intention is negatively influenced (Grewal et al., 1996). Therefore, it can be inferred when the quality of service is uncertain (high quality uncertainty) due to limited knowledge and information, that prices can be used as a significant criterion to assess quality. Hence, the higher price (low discount rate) can lead consumers to perceive higher quality, which may result in higher purchase intention.
Therefore, hypotheses 1 and 2 can be postulated as follows.
H1: If uncertainty regarding service quality is high, consumer purchase intention is higher when the price is high than when the price is low.
H2: If uncertainty regarding service quality is high, consumer purchase intention is higher when price discount rate is low than it is when the discount rate is high.
Dodds and Monroe(1985) found that increases in price can increase the perceived quality of a product, but also that decreases in perceived value and the willingness to purchase a product is associated with an increase in sacrifices that consumers pay to obtain a product or service.
Furthermore, they found that sufficient information about a store or a favorable brand name can positively influence the willingness to purchase(Dodds, Monroe, & Grewal, 1991).
Therefore, it can be inferred that low prices can increase the perceived value of a product or service, which then results in an increased willingness to buy if sufficient information is provided to assess the quality of a product or service. In other words, if consumers have experiences of using a product or service or have sufficient knowledge and information, we would expect that a lower price (or high discount rate) can lead to higher purchase intention.
Therefore, we postulate hypotheses 3 and 4 as follows.
H3: If uncertainty regarding service quality is low, consumer purchase intention is higher when the price is low than it is when the price is high.
H4: If uncertainty regarding service quality is low, consumer purchase intention is higher when price discount rate is high than it is when the discount rate is low.
3.2. Effect of Price Discount Presentation Method and Service Quality Uncertainty on Purchase Intention
A study conducted by Grewal et al.(1996) reveals that even when the price is the same, consumer purchase intention for a product may vary depending on the discount presentation method. According to Bearden, Lichtenstein, and Teel(1984), when both the normal price and the discounted price are presented at the same time, consumer purchase intention is higher than when the discounted price is presented alone. Della, Monroe, and McGinnis(1981) states that when the normal price, the discount rate, and the discounted price are presented at the same time, purchase intention is higher. On the other hand, price discounts have many negative effects. A high price discount can reduce the overall brand image and increase consumers’ doubts about the quality of a product or service(Abrams, 1964). And we expect that the negative effects will be higher if the quality of a product or service is uncertain (high quality uncertainty).If consumers’ uncertainty regarding a product or service
quality is high, then one would expect the price discount to cause doubts about the quality of the product. This would lead to an increase in distrust about the company among consumers. Therefore, when the exact price that consumers have to pay to obtain a product or service remains the same, then it is better not to provide the price discount information to consumers. Rather, it is preferable to only show the price that is discounted (do not let consumers know that the price is discounted but only show them the discounted price). Therefore, we postulate hypotheses 5 and 6 as follows.
H5: If uncertainty regarding service quality is high, consumer purchase intention is higher when the price is low than it is when the price discount rate is high.
H6: If uncertainty regarding service quality is high, consumer purchase intention is higher when the price is high than it is when the price discount rate is low.
The higher the uncertainty, the more likely the price presentation method will have a significant effect (Chernev, 2006). On the other hands, if uncertainty regarding product quality is low, the effect of the price discount presentation method on consumer purchase intention is expected to be limited. The reason for this seems to be that low quality-uncertainty means that sufficient information has been provided to assess product quality, which suggests that if there is no difference in purchase price, presentation method will not affect consumer purchase intention. Therefore, we postulate hypotheses 7 and 8 as follows.
H7: If uncertainty regarding service quality is low, there is no difference in consumer purchase intention whether the price discount rate is low or the price is high.
H8: If uncertainty regarding service quality is low, there is no difference in consumer purchase intention whether the price discount 21rate is high or the price is low.
4. Methodology
In order to test the hypotheses in this study, data were collected through an online survey targeted at Vietnamese consumers, from July to August 2017. A theatrical play was used as a test stimulus for the study because its quality uncertainty is judged to be relatively high.
The play, entitled ‘Why? π!’ which was actually produced and performed in S. Korea, was chosen as a test stimulus.
For the survey, the normal price of this play was set at 150,000 VND (about 7,500 KRW), the mean price for the theater tickets in Vietnam. The discount rates presented were 30% (low discount rate) and 70% (high discount rate).
To test the hypotheses of this study, a total of eight questionnaires were prepared, as presented in Table 1. All questionnaires included a poster and a synopsis of the play.
In order to increase quality uncertainty, questionnaires 1, 3, 5, and 7 did not include consumer reviews. Questionnaires 2, 4, 6, and 8 included consumer reviews in order to decrease quality uncertainty. The poster and synopsis and consumer reviews were provided to respondents as shown in Figure 1.
Figure 1: Poster, Synopsis and Consumer Reviews Regarding price presentation method, one of the most important variables for hypothesis testing in this study, questionnaires 1 and 2, presented a normal price of 150,000 VND, a discount rate of 30%, and discounted price of 105,000 VND. Questionnaires 3 and 4 presented a normal price of 150,000 VND, a discount rate of 70%, and a discounted price of 45,000 VND. Questionnaires 5 and 6 presented 105,000 VND (the 30% discounted price) alone, and questionnaires 7 and 8 presented 45,000 VND (the 70% discounted price) alone.
Table 1: Questionnaires Construction
Present normal price, discount rate and discounted price Present discounted price
Low (30%) High (70%) Expensive (105,000VND) Inexpensive (45,000VND) Quality
uncertainty
High Questionnaire 1 Questionnaire 3 Questionnaire 5 Questionnaire 7
Low Questionnaire 2 Questionnaire 4 Questionnaire 6 Questionnaire 8
Table 2: Definitions and Measurements of Variables
Variables Definition Items References
Price and Price Discount
The degree to which a price or price discount rate is perceived to
be high or low
I think the discount rate is high; I think the price provided is cheap Bruner, James, &
Hensel(2001); Dodds et al.(1991) The price discount rate provided is high; I think the price provided
is low
Purchase
intention Consumers’ likelihood to watch the play
I would like to watch this play
Bruner, James, &
Hensel(2001); Grewal et al.(1998) I am inclined to watch this play
I am highly likely to watch this play I will certainly watch this play Quality
Uncertainty
The degree to which information provided is perceived to be enough
to judge the quality
There is enough information to decide to watch the play
Garner(1962) There is a lot of useful information regarding the play
I am able to assess how enjoyable the play is
To investigate perceptions of the price discount rate and the price, purchase intention the level of quality uncertainty, the questions developed in prior studies were modified and used as shown in Table 2.
5. Results
5.1. Demographic Characteristics of Respondents
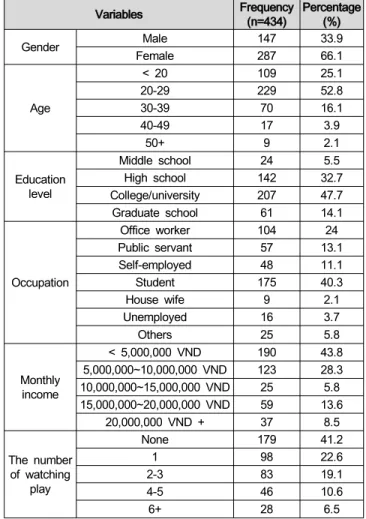
A total of 467 respondents participated, and the responses of 434 people, after removing unreliable responses, were used for analysis. Respondents included 147 males (33.9%) and 287 females (66.1%). Those in their 20s accounted for the largest number among age groups at 229 (52.8%), and, in terms of academic background, college graduates accounted for the largest number at 207 (47.7%).Regarding job, students accounted for the majority at 175 (40.3%). In terms of monthly income, the majority of respondents (190, 43.8%) earned 5 million VND or less monthly. This low income was probably because most of the respondents were students.
5.2. Validity and Reliability Analysis
To derive significant test results, validity and reliability analyses were conducted. As shown in Table 4 and 5, Cronbach’s alpha values of all variables were greater than 0.7, and the results of convergent validity test with varimax rotation indicate a high level of validity.
Table 3: Demographic Characteristics of Respondents
Variables Frequency
(n=434) Percentage (%)
Gender Male 147 33.9
Female 287 66.1
Age
< 20 109 25.1
20-29 229 52.8
30-39 70 16.1
40-49 17 3.9
50+ 9 2.1
Education level
Middle school 24 5.5
High school 142 32.7
College/university 207 47.7
Graduate school 61 14.1
Occupation
Office worker 104 24
Public servant 57 13.1
Self-employed 48 11.1
Student 175 40.3
House wife 9 2.1
Unemployed 16 3.7
Others 25 5.8
Monthly income
< 5,000,000 VND 190 43.8 5,000,000~10,000,000 VND 123 28.3 10,000,000~15,000,000 VND 25 5.8 15,000,000~20,000,000 VND 59 13.6
20,000,000 VND + 37 8.5
The number of watching
play
None 179 41.2
1 98 22.6
2-3 83 19.1
4-5 46 10.6
6+ 28 6.5
Table 4: Reliability Analysis
Variables Number of items Cronbach’s alpha
Price 2 .915
Purchase intention 4 .780
Uncertainty 3 .943
Table 5: Results of Factor Analysis Factor
Items 1 2 3 Commonality
Price 1 .187 .224 .912 .916
Price 2 .166 .185 .927 .921
Uncertainty 1 .158 .803 .239 .727
Uncertainty 2 .206 .815 .200 .747
Uncertainty 3 .250 .757 .062 .639
Purchase intention 1 .857 .218 .152 .805 Purchase intention 2 .905 .192 .152 .879 Purchase intention 3 .896 .232 .154 .881 Purchase intention 4 .897 .188 .119 .854
Eigen value 3.353 2.140 1.876 Percentage Variance 20.847 23.778 37.259 -
5.3. Hypotheses Testing
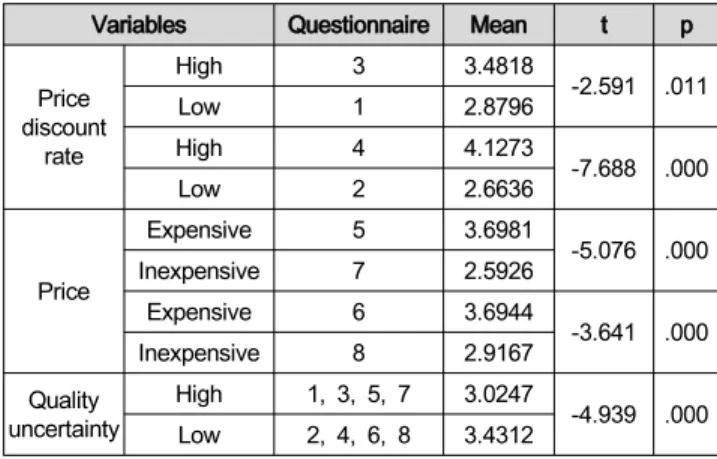
5.3.1. Manipulation CheckThe following were analyzed using independent sample t-tests: whether it is agreed that the price discount rates of 30% and 70% are low and high, respectively; and whether it is agreed that quality uncertainty is low when audience reviews are present, and high when there are no audience reviews.
As shown in Table 1 above, the information provided to respondents was different. All questionnaires presented a poster and synopsis of the play. However, for questionnaires 1, 3, 5, and 7, consumer reviews were presented while no consumer reviews were presented for questionnaires 2, 4, 6, and 8. In addition, for questionnaires 1, 2, 3, and 4, normal price, discount rate, and discounted price were presented simultaneously, while only discounted prices were presented for questionnaires 5, 6, 7, and 8.
Therefore, to test whether respondents perceived that a price discount rate of 30% is low and 70% is high, we compared answers to the questions asking about the perception of the price discount rate between questionnaires 1 and 3, and between 2 and 4, separately. To test whether respondents perceived a discounted price with the rate at 30% as a higher price than with the rate at 70%, we compared answers for questions asking about the perception of price level between questionnaires 5 and 7, and between 6 and 8, separately. In addition, to test whether respondents perceive lower quality-uncertainty in response to
questionnaires with consumer reviews compared to those without consumer reviews, we compared answers regarding quality uncertainty between questionnaires 1, 3, 5, 7 (high quality uncertainty) and 2, 4, 6, 8 (low quality uncertainty).
The results are presented in Table 6 as follows.
Table 6: The Results of Manipulation Check
Variables Questionnaire Mean t p
Price discount
rate
High 3 3.4818
-2.591 .011
Low 1 2.8796
High 4 4.1273
-7.688 .000
Low 2 2.6636
Price
Expensive 5 3.6981
-5.076 .000
Inexpensive 7 2.5926
Expensive 6 3.6944
-3.641 .000
Inexpensive 8 2.9167
Quality uncertainty
High 1, 3, 5, 7 3.0247
-4.939 .000 Low 2, 4, 6, 8 3.4312
The results confirmed that price discount rate, price, and quality uncertainty were appropriately manipulated.
5.3.2. Hypotheses Testing
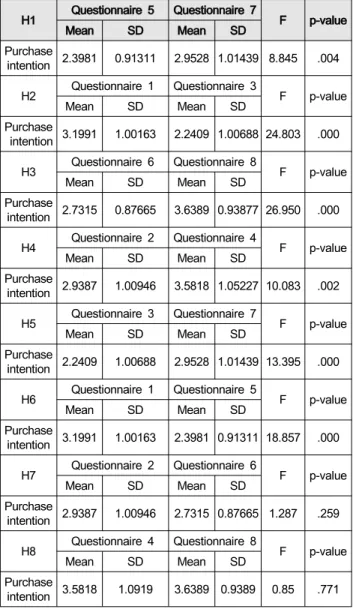
The results of hypotheses testing based on the data collected are as follows. The results of the analysis of Hypothesis 1 found that if uncertainty regarding service quality is high, consumer purchase intention is higher (F=8.845, p<0.05) when the price is low(M=2.9528) than when it is high(M=2.3981). Therefore, Hypothesis 1 cannot be supported. The results of the analysis of Hypothesis 2 found that if uncertainty regarding service quality is high, consumer purchase intention is higher(F=24.803, p<0.05) when the price discount rate is low (M=3.1991) than when it is high(M=2.2409). Therefore, Hypothesis 2 can be supported.
The results of the analysis of Hypothesis 3 found that if uncertainty regarding service quality is low, consumer purchase intention is higher(F = 26.950, p<0.05) when the price is low(M = 3.6389) than it is when the price is high (M = 2.7315). Therefore, Hypothesis 3 can be supported.
The results of the analysis of Hypothesis 4 found that if uncertainty regarding service quality is low, it was confirmed that consumer purchase intention is higher(F = 10.083, p<0.05) when the price discount rate is high(M = 3.5818) than it is when the price discount rate is low(M = 2.9387).
Therefore, Hypothesis 4 can be supported.
The results of the analysis of Hypothesis 5 found that if uncertainty regarding service quality is high, consumer purchase intention is higher(F=13.395, p<0.05) when the price is low(M=2.9528) than it is when the price discount rate is high(M=2.2409). Therefore, Hypothesis 5 can be supported. The results of the analysis of Hypothesis 6 found
that if uncertainty regarding service quality is high, consumer purchase intention is higher(F=18.857, p<0.05) when the price discount rate is low(M=3.1991) than when the price is high(M=2.3981). Therefore, Hypothesis 6 cannot be supported.
The results of the analysis of Hypothesis 7 found that if uncertainty regarding service quality is low, there is no significant difference(F=1.287, p>0.05) in consumer purchase intention between when price discount rate is low (M=2.9387) and when price is high(M=2.7315). Therefore, Hypothesis 7 can be supported. The results of the analysis of Hypothesis 8 found that if uncertainty regarding service quality is low, there is no significant difference(F=0.85, P>0.05) in consumer purchase intention between when the discount rate is high(M=3.5818) and when the price is low (M=3.6389). Therefore, Hypothesis 8 can be supported.
Table 7: The Results of Hypothesis Testing H1 Questionnaire 5 Questionnaire 7
F p-value
Mean SD Mean SD
Purchase
intention 2.3981 0.91311 2.9528 1.01439 8.845 .004 H2 Questionnaire 1 Questionnaire 3
F p-value
Mean SD Mean SD
Purchase
intention 3.1991 1.00163 2.2409 1.00688 24.803 .000 H3 Questionnaire 6 Questionnaire 8
F p-value
Mean SD Mean SD
Purchase
intention 2.7315 0.87665 3.6389 0.93877 26.950 .000 H4 Questionnaire 2 Questionnaire 4
F p-value
Mean SD Mean SD
Purchase
intention 2.9387 1.00946 3.5818 1.05227 10.083 .002 H5 Questionnaire 3 Questionnaire 7
F p-value
Mean SD Mean SD
Purchase
intention 2.2409 1.00688 2.9528 1.01439 13.395 .000 H6 Questionnaire 1 Questionnaire 5
F p-value
Mean SD Mean SD
Purchase
intention 3.1991 1.00163 2.3981 0.91311 18.857 .000 H7 Questionnaire 2 Questionnaire 6
F p-value
Mean SD Mean SD
Purchase
intention 2.9387 1.00946 2.7315 0.87665 1.287 .259 H8 Questionnaire 4 Questionnaire 8
F p-value
Mean SD Mean SD
Purchase
intention 3.5818 1.0919 3.6389 0.9389 0.85 .771
6. Conclusion
6.1. Summary of Results
This study was aimed at identifying the effects of price discount and quality uncertainty regarding a service product on customer purchasing behavior and verifying effective discount presentation methods depending on the level of service quality uncertainty. Below is a summary of the results along with specific implications.
First, when uncertainty regarding service quality is low (i.e., there are consumer reviews), consumer purchase intention is higher when the price discount rate is high or when the price is low. In other words, perceived risk is low when consumers have enough information to evaluate service quality. Therefore, consumer purchase intention increases as discount rate increases or price decreases. In addition, when uncertainty regarding service quality is low, there is no significant difference in consumer purchase intention whether the discount rate is high (low) or the price is low (high).
Second, when uncertainty regarding service quality is high (i.e., there are no customer reviews), we found that when the normal price, discount rate, and discounted price are presented simultaneously, consumer purchase intention is higher when the price discount rate is low, but when only the discounted price is presented, consumer purchase intention is higher when the price is low. Consumers tend to evaluate product quality based on various external clues, including price, while expecting to be able to make a decision quickly and conveniently (Tellis & Gaeth, 1990).
This suggests that when normal price, discount rate, and discounted price are presented, and there is little information for the assessment of product quality, price can be used as an indicator of quality.
Hypotheses 1 and 6 cannot be supported. Grewal et al.
(1996) found that if the price discount rate is too high, then uncertainty regarding the product quality increases.
Therefore, the purchase intention would decrease. To test hypothesis 1, only discounted prices were provided to respondents; they did not know that the price was discounted. Therefore, with the support of hypothesis 3, we infer that regardless of the uncertainty level regarding quality, if the full discount information is not provided, then low prices can increase consumer purchase intention.
Chernev (2006) has argued that the higher the uncertainty of quality, the more likely the price presentation method will have a significant effect. Furthermore, full discount information can increase consumer purchase intention (Della et al., 1981). With the findings of prior studies, we infer that when the price is high or the discount rate is low, and there is high quality uncertainty associated with the high risk of decrease in perceived value, then it is better to show the full discount information to consumers.
6.2. Theoretical and Practical Implications
This study can provide valuable theoretical implications.
Prior studies on pricing have explored the effects of price discounts (e.g. Abrams, 1964; Heerde et al., 2003; Grewal et al., 1996), presentation methods of discounted products (e.g. Krum & Keiser, 1976; DelVecchio et al., 2007), and service quality uncertainty (e.g. Parasuraman et al., 1988;
Lupton, 2005; Funtowicz & Ravetz, 1990; Murray 1991) on consumer purchase intention and behavior. However, they have not considered simultaneous price discounts, the presentation methods of discounted prices, and service quality uncertainty. By considering these variables at the same time, the results of this study can provide new insights about the influence that quality uncertainty of a product or service might have on the effects of pricing strategy.
We used the theatre play as a stimulus because a play is a service product with high quality uncertainty. However, we believe that the results of our study can be applied to the retail industry. As the competition among retailers become fiercer, pricing strategy can be the most important factor influencing their performance as they compete by dealing and selling the same products or services. Especially when retailers introduce a new product or service for selling, this study can provide guidance regarding pricing strategy as new products or services may have high uncertainty about the quality. Depending on the level of quality uncertainty, different pricing strategies can be implemented to improve the effectiveness of driving consumer purchase intention.
6.3. Limitations
Our survey respondents were mainly from a young generation who might be interested in theatre plays, as shown in Table 3. In order to generalize the results, further studies using additional service products such as spas, restaurants and hotels need to be conducted. These are service products that anyone, regardless of age, might be interested in. This will ensure higher reliability and greater application of this study to business practices.
Another limitation of this study is an absence of analysis of the consumers’ attitudes and involvement in the studied play. If these items are considered in a future study, then various outcomes are expected. Finally, this study only included positive audience reviews. However, every product and service has both positive and negative reviews.
Therefore, the effects of negative reviews under the same situations need to be examined.
References
Abrams, J. (1964). A new method for testing pricing decisions. Journal of Marketing, 28(3), 6-9.
Ailawadi, K. L., Neslin, S. A., & Gedenk, K. (2001).
Pursuing the value-conscious consumer: Store brands versus national brand promotions. Journal of Marketing, 65(1), 71-89.
Bearden, W. O., Lichtenstein, D. R., & Teel, J. E. (1984).
Comparison price, coupon, and brand effects on consumer reactions to retail newspaper advertisements.
Journal of Retailing, 60(2), 11-34.
Bearden, W. O., & Shimp, T. A. (1982). The use of extrinsic cues to facilitate product adoption. Journal of Marketing Research, 19(2), 229-239.
Bruner, G. C., James, K. E., & Hensel, P. J. (2001), Marketing scales handbook, Vol.III: A compilation of multi-item measures. Chicago, IL: South-Western Educational Pub.
Chen, H., Marmorstein, H., Tsiros, M., & Rao, A. R.
(2012). When more is less: The impact of base value neglect on consumer preferences for bonus packs over price discounts. Journal of Marketing, 76(4), 64-77.
Chernev, A. (2006). Decision focus and consumer choice among assortments. Journal of Consumer Research, 33(1), 50-59.
Chung, J., & Li, D. (2013). The prospective impact of a multi-period pricing strategy on consumer perceptions for perishable foods. British Food Journal, 115(3), 377-393
Chung, J., & Li, D. (2014). A simulation of the impacts of dynamic price management for perishable foods on retailer performance in the presence of need-driven purchasing consumers. Journal of the Operational Research Society, 65(8), 1177-1188.
Della Bitta, A. J., Monroe, K. B., & McGinnis, J. M.
(1981). Consumer perceptions of comparative price advertisements. Journal of Marketing Research, 18(4), 416-427.
DelVecchio, D., Krishnan, H. S., & Smith, D. C. (2007).
Cents or percent? The effects of promotion framing on price expectations and choice. Journal of Marketing, 71(3), 158-170.
Dodds, W. B., & Monroe, K.B. (1985). The effect of brand and price information on subjective product evaluations. Advances in Consumer Research, 12(1), 85-90.
Dodds, W. B., Monroe, K. B., & Grewal, D. (1991). Effect of price, brand, and store information on buyers’
product evaluations. Journal of Marketing Research, 28(3), 307-319.
Fishbein, M., & Ajzen, I. (1975). Belief, attitude, intention and behavior: An introduction to theory and research.
Reading, Mass: Addison-Wesley.
Funtowicz, S. O., & Ravetz, J. R. (1990). Uncertainty and quality in science for policy. Dordrecht, Netherlands:
Springer Netherlands.
Garner, W. R. (1962). Uncertainty and Structure as
Psychological Concepts. Oxford, England: Wiley.
Gerstner, E. (1985). Do higher prices signal higher quality?. Journal of Marketing Research, 22(2), 209-215.
Grewal, D., Krishnan, R., Baker, J., & Borin, N. (1998).
The effect of store name, brand name and price discounts on consumers' evaluations and purchase intentions. Journal of Retailing, 74(3), 331-352.
Grewal, D., Marmorstein, H., & Sharma, A. (1996).
Communicating price information through semantic cues: The moderating effects of situation and discount size. Journal of Consumer Research, 23(2), 148-155.
Gupta, S., & Cooper, L. G. (1992). The discounting of discounts and promotion thresholds. Journal of Consumer Research, 19(3), 401-411.
Kahneman, D. (1979). Prospect theory: An analysis of decisions under risk. Econometrica, 47(2), 263-291.
Kim, H. S., & Shim, J. H. (2017). The effects of service qualities on customer satisfaction and behavioral intention in coffee shop. International Journal of Industrial Distribution & Business, 8(5), 95-109.
Kotler, P. (2000). Marketing Management (10th ed.). New Delhi, India: Pearson Prentice Hall.
Kotler. P., & Keller. K. L. (2011). Marketing Management (14thed.). MA: Prentice Hall.
Krum, J. R., & Keiser, S. K. (1976). Regulation of retail newspaper advertising. Journal of Marketing, 40(3), 29-34.
Lupton, S. (2005). Shared quality uncertainty and the introduction of indeterminate goods. Cambridge Journal of Economics, 29(3), 399-421.
Murray, K. B. (1991). A test of services marketing theory:
Consumer information acquisition activities. Journal of Marketing, 55(1), 10-25.
Niu, L. X., & Lee, J. H. (2018). The intention of repurchase on e-service quality by online travel agency site. International Journal of Industrial Distribution &
Business, 9(7), 61-70.
Parasuraman, A., Zeithaml, V. A., & Berry, L. L. (1988).
SERVQUAL: A multiple-item scale for measuring consumer perceptions of service quality. Journal of Retailing, 64(1), 12-37.
Pavlou, P. A., Liang, H., & Xue, Y. (2007). Understanding and mitigating uncertainty in online exchange relationships: A principal-agent perspective. MIS Quarterly, 31(1), 105-136.
Ren, C. M., & Kang, M. J. (2018). The influence of brand awareness on the intention of buying counterfeit brands. International Journal of Industrial Distribution &
Business, 9(10), 7-14.
Shin, C. B., Hwang, G. S., Lee, H. W., & Cho, S. R.
(2015). The impact of Korean franchise coffee shop service quality and atmosphere on customer satisfaction and loyalty. East Asian Journal of Business Management, 5(4), 47-57.
Thaichon, P., Lobo, A., & Mitsis, A. (2014). Achieving customer loyalty through service excellence in internet industry. International Journal of Quality and Service Sciences, 6(4), 274-289.
Teng, L. (2009). A comparison of two types of price discounts in shifting consumers' attitudes and purchase intentions. Journal of Business Research, 62(1), 14-21.
Tellis, G. J., & Gaeth, G. J. (1990). Best value, price-seeking, and price aversion: The impact of information and learning on consumer choices. Journal of Marketing, 54(2) 34-45.
Van Heerde, H. J., Gupta, S., & Wittink, D. R. (2003). Is 75% of the sales promotion bump due to brand switching? No, only 33% is. Journal of Marketing Research, 40(4), 481-491.
Wilson, A., Zeithaml, V. A., Bitner, M. J., & Gremler, D.
(2012). Services marketing: Integrating customer focus across the firm (2nd ed.). New York, NY: McGraw Hill.