• 검색 결과가 없습니다.

CLASSIFICATION SCHEMES AND PROPERTIES OF INFRARED GALAXIES

N/A
N/A
Protected

Academic year: 2021

Share "CLASSIFICATION SCHEMES AND PROPERTIES OF INFRARED GALAXIES"

Copied!
2
0
0

로드 중.... (전체 텍스트 보기)

전체 글

(1)

ISSN 1225-1534 (Print) http://dx.doi.org/10.5303/PKAS.2012.27.4.293 Publications of the Korean Astronomical Society

27: 293 ∼ 294, 2012 September

° 2012. The Korean Astronomical Society. All Rights Reserved. c

CLASSIFICATION SCHEMES AND PROPERTIES OF INFRARED GALAXIES

P. Rybka 1 , A. Pollo 2,3 , and T. T. Takeuchi 1

1 Department of Particle and Astrophysical Science, Nagoya University, Japan

2 The Astronomical Observatory of the Jagiellonian University, Krak´ow, Poland

3 National Centre for Nuclear Research, Warsaw, Poland E-mail: [email protected]

(Received June 30, 2012; Accepted August 09, 2012)

ABSTRACT

We established a separation scheme to distinguish galaxies from stars with the aid of AKARI/FIS color-color (CC) diagrams. In all the combinations of CC diagrams we can distinguish two separate clouds. It was shown that in all cases one of them contains more than 95% of galaxies and the other one, in most cases, consists in more than 80% of stars (Pollo et al., 2010). Currently we are looking into more detailed classifications. We are especially interested in separating different morphological types of galaxies, mainly within spiral galaxies. Moreover, we study the properties of infrared galaxies.

Key words: infrared: galaxies, stars; telescope; conferences: proceedings

1. OUR SAMPLE

It is crucial for all-sky surveys, detecting tremendous amount of sources, to find a way to distinguish between different kinds of objects based on minimal amount of additional information. The best option would be to use only data which is brought by the survey itself.

The AKARI/FIS catalogue contains more than 400,000 sources. For the reason mentioned above, we are looking for various classification schemes be- tween different types of objects within the catalogue, using photometric information only. For our pur- pose, we selected sources in regions of low Galactic emission at 100 µm (I 100 < 10 MJy sr −1 ) in order to increase the probability of finding a counterpart.

This condition is met by 39968 sources within which 5,176 sources have complete photometric information.

This sample of sources was identified in the NED and SIMBAD databases, resulting in the following identifi- cation: 68.8% of sources is extragalactic, about 6.6% is Galactic, 4% have been observed in infrared and 2.7%

in radio wavelengths, and finally 16.4% of sources were unidentified.

Table 1.

Morphological Types of 9217 FIS Galaxies Type of galaxies Number Percentage in IR in IR in opt.

Spiral 7877 85% 61%

Lenticular 911 10% 22%

Irregular 161 2% 4%

Elliptical 268 3% 13%

Pollo et al. (2010) have shown, for AKARI/FIS Bright Source Catalogue Version β-1, that in all the combinations of far-infrared (FIR) color-color (CC) di- agrams we can distinguish two separate clouds. Based on these scatter plots, the division line between stars and galaxies was decided. Two examples of the dia- grams, for the sources with the best quality FIS fluxes, are shown in Fig. 1.

There are 27,384 galaxies in the cross-identified sam- ple of FIS sources. Nearly 68% of these galaxies have their redshift measured and 95% of them are located at very low redshifts below 0.1. Morphology was obtained for just over one third (34%) of the galaxies. Summary of morphological counts is presented in Table 1.

http://pkas.kas.org 293

(2)

294 RYBKA ET AL.

-1 -0.5 0 0.5 1

-0.4 -0.2 0 0.2 0.4

log(S65/S140)

log(S

65

/S

90

)

-1 -0.5 0 0.5 1

-0.4 -0.2 0 0.2 0.4

log(S90/S140)

log(S

65

/S

90

)

Fig. 1. The S

65

/S

90

–S

65

/S

140

, S

65

/S

90

–S

90

/S

140

CC di- agrams for the sources with flux quality indicators equal to 3. Symbols represent the sources as follows: red squares - galaxies; blue triangles - Galactic stars. The solid line is a division line between the two classes of objects. The dotted lines represent the uncertainty ranges in the color determination.
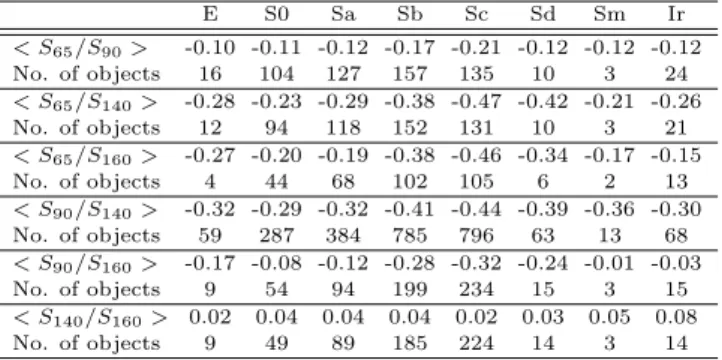
-0.2 -0.1 0

El S0 Sa Sb Sc Sd Sm Ir log(S65/S90)

Morphology

-0.6 -0.5 -0.4 -0.3 -0.2

El S0 Sa Sb Sc Sd Sm Ir log(S90/S140)

Morphology

Fig. 2. Left: log(S

65

/S

90

) vs morphological type; Right:

log(S

90

/S

140

) vs morphological type. Filled squares are me- dians. The lower bar is the 25th percentile; the upper is the 75th percentile.

2. HOW FIR COLORS VARY WITH HUBBLE SE- QUENCE?

Trends along the Hubble sequence for two FIR colors is presented in Fig. 2 and median values of possible FIR colors for each galaxy type are listed in Table 2. Among all types of galaxies, Sc have the lowest median for each FIR color. The median of log(S 140 /S 160 ) is almost the same for all morphological types because 140 µm and 160 µm wavebands lie very close to each other and it is very possible that both are at the Rayleigh-Jeans regime of dust emission. If we neglect morphological types for which we have very low number of objects, e.g. Sm, the difference between the highest and the lowest values of medians are 0.1, 0.24, 0.27, 0.15, 0.24, 0.02; also lenticular galaxies have the highest median for almost all colors. Luminous IR galaxies and star- burst galaxies have colors’ median bluer than S0.

Table 2.

Medians of FIR Colors for Galaxies with the Best Quality Fluxes

E S0 Sa Sb Sc Sd Sm Ir

< S

65

/S

90

> -0.10 -0.11 -0.12 -0.17 -0.21 -0.12 -0.12 -0.12 No. of objects 16 104 127 157 135 10 3 24

< S

65

/S

140

> -0.28 -0.23 -0.29 -0.38 -0.47 -0.42 -0.21 -0.26 No. of objects 12 94 118 152 131 10 3 21

< S

65

/S

160

> -0.27 -0.20 -0.19 -0.38 -0.46 -0.34 -0.17 -0.15

No. of objects 4 44 68 102 105 6 2 13

< S

90

/S

140

> -0.32 -0.29 -0.32 -0.41 -0.44 -0.39 -0.36 -0.30 No. of objects 59 287 384 785 796 63 13 68

< S

90

/S

160

> -0.17 -0.08 -0.12 -0.28 -0.32 -0.24 -0.01 -0.03

No. of objects 9 54 94 199 234 15 3 15

< S

140

/S

160

> 0.02 0.04 0.04 0.04 0.02 0.03 0.05 0.08

No. of objects 9 49 89 185 224 14 3 14

3. CONCLUSIONS

The FIR CC diagrams allow for a high quality star- galaxy separation. The distribution of morphological types significantly differ from what is observed in the case of optically bright galaxies. Our galaxy sample contains small number of elliptical and irregular galax- ies, overrepresentation of spiral galaxies, and noticeable number of lenticular galaxies. Rough conclusion about galaxies can be that lenticular galaxies contain more hot dust than Sc galaxies.

ACKNOWLEDGEMENTS

This work is based on observations with AKARI, a JAXA project with the participation of ESA. AP has been supported by the research grant of the Polish Ministry of Science N N203512938. This research was partially supported by the project POLISH-SWISS AS- TRO PROJECT co-financed by a grant from Switzer- land through the Swiss Contibution to the enlarged Eu- ropean Union. TTT has been supported by the Grant- in-Aid for the Scientific Research Fund (20740105, 23340046, and 24111707) and for the Global COE Pro- gram Request for Fundamental Principles in the Uni- verse: from Particles to the Solar System and the Cosmos commissioned by the Ministry of Education, Culture, Sports, Science and Technology (MEXT) of Japan.

REFERENCES

Pollo, A., Rybka, P., & Takeuchi, T. T., 2010, Star-

Galaxy Separation by Far-Infrared Color-Color

Diagrams for the AKARI FIS All-Sky Survey

(Bright Source Catalog Version β-1), A&A, 514,

A3

수치

Fig. 2. Left: log(S 65 /S 90 ) vs morphological type; Right:

참조

관련 문서

2) Serum Cortisol, ACTH 3) Serum TSH and Free T4 4) Serum Prolactin and GH 5) Serum 25OHD and PTH.. What is the most common laboratory. abnormality expected in this

Basic aspects of AUTOSAR architecture and methodology Safety mechanisms supported by AUTOSAR.. Technical safety concepts supported by AUTOSAR Relationship to ISO

GDP impact of COVID-19 spread, public health response, and economic policies. Virus spread and public

After first field tests, we expect electric passenger drones or eVTOL aircraft (short for electric vertical take-off and landing) to start providing commercial mobility

The types of transport schemes under the direct and indirect responsibility of the Department for Transport have been divided into a number of distinct groups where the risk

1 John Owen, Justification by Faith Alone, in The Works of John Owen, ed. John Bolt, trans. Scott Clark, &#34;Do This and Live: Christ's Active Obedience as the

In chemistry, Gibbs' phase rule describes the possible number of degrees of freedom (F) in a closed system at equilibrium, in terms of the number of separate phases (P) and

Anoxic