Characteristics of Spectral Reflectance in Tidal Flats
Joo-Hyung Ryu*1), Young-Ho Na*, Jong-Kook Choi*, and Joong-Sun Won*
*Department of Earth System Sciences, Yonsei University 134 Shinchon-dong, Seodaemun-gu, Seoul, Korea 120-749
Ph.) +82-2-2123-2673 / Fax) +82-2-392-6527 e-mail) [email protected]
1) J.H. Ryu is now with Remote Sensing Group, Institute for Coastal Research, GKSS Forschungszentrum, Max-Plank- Strase, D-21502 Geesthacht, Germany.
Abstract – We present spectral characteristics of tidal flat sediments and algal mat that were tested in the Gomso and Saemangum tidal flats, Korea. The objective of this study is to investigate the spectral reflectance and the radar scattering modeling in the tidal flats. Ground truth data obtained in the tidal flats include grain size, soil moisture content and its variation with time, surface roughness, chlorophyll, ground leveling, and field spectral reflectance measurement.
The concept of an effective exposed area (EEA) is introduced to accommodate the effect of remnant surface water, and it seriously affects the reflection of short wavelength infrared and microwave. The grain size of 0.0625 mm has been normally used as a critical size of mud and sand discrimination. But we propose here that 0.25 mm is more practical grain size criterion to
discriminate by remote sensing. Algal mat is the primary product in tidal flats, and it is found to be very important to understand spectral characteristics for tidal flat remote sensing. We have also conducted radar scattering modeling, and showed L-band HV-polarization would be the most effective combination.
Introduction
Remote sensing is an indispensable tool for studying tidal flat to which the accessibility is seriously limited. . Surface sediment is one of the most important control parameters of tidal flat environment. However, there
does not yet exist a comprehensive remote sensing approach to discriminate the type of tidal flat sediment.
Distribution of surface sediment is an important parameter of tidal flat environment. Bartholdy and Floying (1986) classified the intertidal sediments in the Danish Wadden Sea using field survey and Landsat TM data, but concluded that grain-size parameters had no direct correlation with spectral signatures. Luders et al.
(1999) attempted to discriminate sand and gravel in riverbank using airborne TIR bands. In short, there does not yet exist a comprehensive remote sensing approach to discriminate the type of tidal flat sediments. The difficulties originate from the fact that spectral reflectance and microwave scattering in tidal flat are governed by various control factors in addition to grain size. The control factors are generally considered as grain size, soil moisture content, local slope, and development of inter-tidal creeks.
The Korean tidal flats have two distinctive features: (i) they are composed of finer grains, and (ii) the sand barriers are very poorly developed. Finer grains are usually much more difficult to analyze by remote sensing.
The objective of this study is to investigate the spectral reflectance and the radar scattering modeling in Korean tidal flats, specifically the Gomso and Saemangum tidal flats.
Tidal Conditions
The tidal conditions have usually not been considered
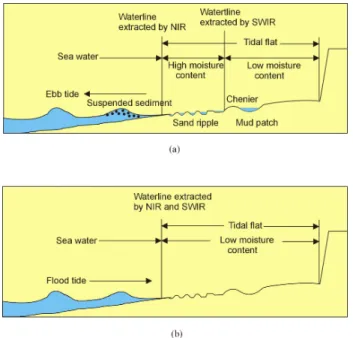
as a controlling factor of spectral reflectance. However, the tidal conditions and remnant surface water is important additional parameters controlling spectral reflectance in the tidal flats as Ryu et al. (2002) pointed out. Surface are usually covered with scattered water of at least a few centimeter deep considerably long hours after the bottom surface is fully exposed under the ebb tide conditions, which seriously affects spectral reflectance in mud or mixed flats. We introduce the concept of an effective exposed area (EEA) to accommodate this effect given by:
Area Total
Cover Water
Area Total
EEA = − (1)
SWIR and microwave are especially sensitive to this effect (Ryu et al., 2002). While the tidal flat environment is relatively stable in the flood tide, the ebb tide makes the situation much more complicated. Two separate reflection models in terms of tide are required for a quantitative analysis of remotely sensed data.
Although the reflectance of mud flat is relatively lower than that of sand flat, the patterns of optical reflectance from the sand and mud flats are very close each other (Figure 1). Consequently it is not easy to discriminate sand and mud by optic remote sensing data under normal conditions. If parts of ground resolution surface are covered with 1 cm deep water, reflection of SWIR and backscattering of microwave are significantly reduced.
On the contrary, NIR is almost free from the effect of thin remnant surface water. The surface water is abundant in mud or mixed flat, but not typical in sand flat. Thus this factor can possibly be exploited in sand and mud discrimination. However, this effect is not simple because surface water also prevails in topographic low region of sand flat. High precision DEM data is additional required in the analysis.
Figure 1. Two schematic models of the tidal flat spectral reflectance environment in terms of tidal condition during (a) ebb tide and (b) flood tide (after Ryu et al., 2002).
Grain Size vs. Reflectance
We have collected field samples from more than 200 sampling sites. At each sampling site, we took at least three samples, each of about 200 g, within a 10 m radius.
We measured moisture content by two methods to enable crosschecking of the data. Two sub-samples out of each sampling bag were analyzed using a moisture analyzer (Ohaus Co., MB45) and in addition we measured the weight of the remainder of the sample before and after drying. For grain size analysis, we collected a sample from the top 2 cm of the surface sediment. After removing carbonate and organic materials, we measured the grain sizes using a MASTERSIZER (Malvern 2000).
On typical sand- and mud-flats, we also measured the spectral reflectance using a field spectrometer (ASD Fieldspec). The sampling position was located by beacon type DGPS.
As Bartholdy and Folying (1986) pointed out, it is difficult to directly find a relationship between the grain size and the spectral signatures.
Figure 2. Optical reflectance of field spectrometer in sand and mud flats.
Figure 3. Grain size versus reflectance of Landsat ETM+
band 4, 5, and 7: 0.0625 mm is used as a critical grain size in the upper row, while 0.25 mm is used in the bottom row.
The sediment grain size is normally classified based upon geological criteria: silt (< 0.0625 mm), very fine sand (0.0625 - 0.125 mm), fine sand (0.125 - 0.25 mm), medium sand (0.25 - 0.5 mm), coarse sand (0.5 - 1.0 mm), and very coarse sand (1.0 - 2.0 mm). The critical grain size of silt and sand has been considered as 0.0625 mm, and previous researches had attempted to develop remote sensing method to discriminate sand and fine grains.
We have done grain size analysis using samples obtained almost simultaneously with Landsat-7 ETM+
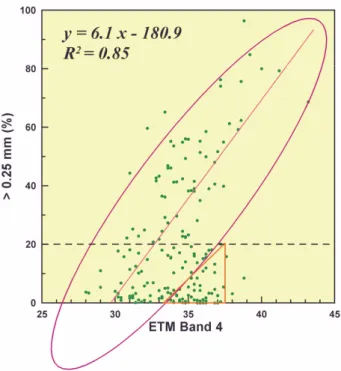
data acquisition. The correlation coefficient of the grain size and the Landsat ETM+ data was estimated and plotted as shown in Figure 3. In Figure 3, the critical grain size of 0.0625 mm resulted in negative gradient for all bands. On the contrary, positive relationship can be obtained when the grain size is classified based upon 0.25 mm. The correlation coefficient between the grain size and ETM+ band 4 was 0.85 when samples composed of finer grains (< 20 % of 0.25 mm grains) were not counted in the estimation. As shown in Figure 3, the linear trend is well observed in the coarser grains, while the finer grains are problematic especially the amount of grains bigger than 0.25 mm are less than 20 %.
The reflectance model for Landsat ETM+ band 4 in terms of 0.25 mm grain size can be set up as Figure 4.
The linear regression line has a gradient of 6.1 with a R2 of 0.85. However, this model cannot accommodate finer grains especially less than 20 % of 0.25 mm or larger sediments. Future works should focus on the model for finer grain sediments.
Figure 4. Grain size versus Landsat ETM+ band 4.
The results could be explained by soil moisture content. Although reflectance of sand and silt (or mud) is very similar under same moisture content, moisture content varies with grain size. The critical grain size governing moisture content in tidal flat appears to be 0.25mm rather than 0.0625. Remnant surface water helps to increase the difference of reflectance. The difference of moisture content between sand and mud was about 10 % in weight. High reflection of fine sediments appears to arise from upper tidal flat (Figure 5). Slope of upper tidal flat is generally steep and exposure to air is longer so that moisture content of surface sediments decreases fast. Even finer grain sediments show high reflectance when they are dried up. This works, however, at least demonstrate that 0.25 mm is more practical than the conventional 0.0625 mm criteria in optical remote sensing for tidal flat applications.
Radar Backscattering Modeling
Optical remote sensing alone cannot satisfy demands for tidal flat studies. SAR could compensate for the problem. Numerical modeling was conducted: i) to determine optimal combination of frequencies and polarization; and ii) to estimate the expected maximum range of radar backscattering intensity within tidal flat.
Figure 5. The distribution of fine sediments (dark dots) having high reflectance.
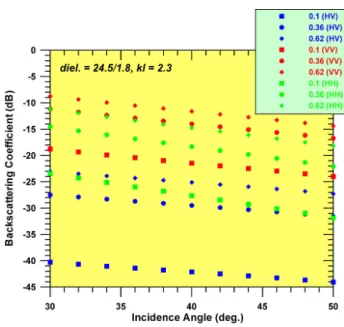
Using ground truth data (i.e. soil moisture content, surface roughness, and grain size), we estimated radar backscattering numerically. We have sampled at 22 sites of typical sand and mud flats. Soil moisture content ranged from 12 % to 43 %. From the measured surface roughness, correlation length (l) and r.m.s. height (s) were estimated by Gaussian model. The ks and kl had ranges of 0.006-0.032 and 0.027-0.149, respectively.
Two numerical models were used: SPM model (Rice, 1951); and an empirical model developed by Oh et al.
(1992). The SPM model was used only for small ks and kl values, and the Oh's empirical model was applied to most cases. Both L- and C-band cases were estimated for HH-, VV-, and HV-polarization. Figure 6 displays the result of L-band HV-polarization, which is turned out be the optimal combination. The maximum difference of backscattering intensity is expected to be less than 15 dB in the tidal flat. The maximum difference of sigma nought in actual SAR image was larger than this values.
The EEA effect might contribute to the SAR imaging.
Results also show ks is the most significant parameter among the three.
Figure 6. The results of L-band radar backscattering modeling. It shows L-band HV-polarization is the most effective for tidal flat studies.
Conclusions
Tidal condition and surface water remaining after exposure are found to be important additional parameters to optical reflectance. Landsat ETM+ band 4 was correlated most with grain size. Instead of the conventional 0.0625 mm, we suggest that 0.25 mm be a practical grain size in tidal flat remote sensing. The radar scattering modeling showed relatively small variation of less than 15 dB within the tidal flat, and L-band HV-polarization is the best for tidal flat observation.
Acknowledgements
Authors thank Prof. Yisok Oh for providing computer code of radar scattering modeling and discussion about the results.
References
[1] J. Barthold, and S. Folving, 1986, Sediment classification and surface type mapping in the Danish Wadden Sea by remote sensing, Netherlands J. Sea Res., 20(4): 337-345.
[2] J. Luders, S. Schill, J.r. Jensen, and G. Olson, 1999, Sand and gravel particle size discrimination using airborne terrestrial applications Sensor (ATLAS), SSC, MS, NASA Stennis Space Center, Commercial Remote Sensing Report, 45 pp.
[3] J.H Ryu,, Won, J.S., Min, K.D., 2002. Waterline extraction from Landsat TM data in a tidal flat: A case study in Gomso Bay, Korea, Remote Sensing Environ. (in press 2002.12.).
[4] S.O. Rice, 1951, Reflection of Electromagnetic Waves from Slightly Rough Surfaces, Pure Appl.
Math.,.4, 351-378.
[5] Y. Oh, K. Sarabandi, and F.T. Ulaby, 1992, An empirical model and inversion technique for radar scattering from bare soil surface, IEEE Trans. Geosci.
Remote Sensing, 30(2): 370-381.