593
"J. Korean Soc. Radiol., Vol. 12, No. 5, October 2018"
Analysis for Correlation of Standardized Uptake Value in Fusion Imaging Scanner
Jin-Eui Kim,1 Jung-Soo Kim,2 Nam-Gil Choi,1 Jae-Bok Han1,*
1Department of Radiological Science, Dongshin University
2Department of Radiological Technology, Dongnam Health University
Received: September 11 2018. Revised: October 25, 2018. Accepted: October 31, 2018
ABSTRACT
Recently in nuclear medicine, to improve diagnostic value, SUV, semi-quantitative indicator used in PET-CT, is adopted in SPECT-CT. Therefore, this research analyzed correlation of SUVmax of two scanners through phantom test, and evaluated possibility of clinical application. Radiopharmaceuticals (18F, 99mTc) were injected with the ratios of 8:1 and 4:1, considering background radioactivity, into the phantom manufactured with 6 globes of different sizes, and, based on clinical protocol, positive phases were acquired with PET-CT and SPECT-CT scanners, and interesting areas were divided into ROI and VOI, and SUVmax of them were measured, and analyzed. Tests found out no statistically significant difference in SUVmax measured with two scanners (P>0.05).
Thus, SUVmax of PET-CT and SPECT-CT had a certain correlation within significant levels, and were evaluated as the same. Accordingly, it seems that SUVmax quantitative analysis using SPECT-CT can provide significant diagnostic information as the case of PET-CT.
Keywords: Fusion Imaging Scanner, Standardized Uptake Value, PET-CT, SPECT-CT
Ⅰ. INTRODUCTION
체내에서 방출되는 감마선을 외부에서 수집하는 핵의학 영상은 외부에서 엑스선을 발생하여 체내 를 투과하여 수집하는 영상의학 영상과는 획득원 리가 다르다. 특히 핵의학은 목적 장기에 집적하는 방사성의약품을 투여함으로써 인체의 생화학적 대 사이상을 세포 수준에서 비교적 정확하게 진단할 수 있으나, 목적 장기에서 방출되는 감마선이 필연 적으로 인체 조직의 원자들과의 상호작용을 통해 감쇠가 일어나게 되고, 감마선을 수집하는 과정에 서 데이터의 손실이 있으므로 영상의학보다 해부 학적 정보가 부족한 것이 문제였다.[1] 이러한 핵의 학의 한계를 극복하기 위해 다양한 노력이 시도 되 었고, 그중의 한 가지 대안으로 영상의학 장비를 기존의 핵의학 장비에 융합하는 방법이다. 대표적 으로 전산화단층촬영 (CT; Computed Tomography) 는 많은 양의 광자를 연속적으로 발생시켜 인체의
해부학적 정보를 단층 영상을 통해 진단할 수 있지 만, 환자의 피폭선량이 많은 것이 단점임에도 불구 하고, 우수한 공간분해능을 통한 해부학적 정보를 제공할 수 있다. 또한 CT는 인체를 중심축으로 회 전하며 스캔함으로써 360°모든 방향에서 인체의 원 자들과의 상호작용에 따른 감쇠 정보를 얻을 수 있 다. 이러한 이유로 핵의학 영상의 한계였던 인체 해부학적 정보의 부족함을 보완하고, 방출 영상의 획득 원리에 따른 인체의 감쇠정보를 비교적 정확 하게 분석하여 보정할 수 있는 CT를 융합함으로써 보다 진보된 영상정보를 획득할 수 있게 되었다.[2]
한편 핵의학적 진단은 영상을 통한 정성적 평가와 함께 목적 장기에서 방출된 광자의 정보, 즉 계수 를 측정함으로써 정량적인 분석이 가능하다. 양전 자방출단층촬영 (PET; Positron Emission Tomography) 진단에 이용하는 가장 대표적인 정량분석지표인 표준섭취계수는 (SUV; Standardized Uptake Value) 종양에서 방사성의약품의 집적 정도를 분석하는
* Corresponding Author: Jae Bok Han E-mail: [email protected] Tel: +82-61-330-3574 https://doi.org/10.7742/jksr.2018.12.5.593
반정량 평가방법으로, 관련 연구를 통해 유용성 이 입증되면서 임상에서의 종양에 대한 악성화 여 부 및 예후 관찰을 위해 이용하고 있다.[4] 최근 단 일광자방출전산화단층촬영 (SPECT; Single Photon Emission Computed Tomography)의 정량적 분석을 위 해 PET에 국한하여 이용하던 SUV를 적용함으로써 진단적 가치를 향상하려는 노력이 시도되고 있 다.[5] 이와 관련되어 MDP (methylene diphosphonate) 를 투여한 환자의 SPECT-CT 영상에서 SUV를 측 정함으로써 정확성과 직선성을 확보할 수 있는 연 구가 보고되었으며[6,7], 대다수는 의료장비 제조사 에서 제공하는 정보이므로, 임상 적용의 가능성을 평가하기에는 무리가 있을 것으로 판단된다. 따라 서 대표적인 핵의학 융합 영상장비인 PET-CT와 SPECT-CT의 SUV를 팬텀 실험을 통해 상관관계를 분석함으로써 임상 적용 가능성을 평가하였다.
Ⅱ. MATERIAL AND METHODS
1. 팬텀 및 스캐너
실험에 이용한 flangeless deluxe jaszczak phantom (data spectrum Inc, durham, NC)은 Fig. 1과 같이 6 개의 다른 지름으로 (outer diameter: 11.89, 14.43, 17.69, 21.79, 26.82, 33.27 ㎜/volume of spheres: 0.5, 1.0, 2.0, 4.0, 8.0, 16.0 ㎖) 제작된 구를 포함하고 있 으며, 팬텀의 하부에는 6개의 다른 길이의 (rod dimension: 4.8, 6.4, 7.9, 9.5, 11.1, 12.7 ㎜) 로드로 설계되었다. SUV는 병변의 크기와 방사성의약품의 균일한 분포 정도, 스캐너의 공간분해능 등에 영향 을 받아 부분 체적효과를 일으킬 수 있다. 따라서 팬텀의 구는 인체에 발생할 수 있는 다양한 크기의 병변을 묘사함으로써 실험의 정확도를 향상할 수 있다.[8] 핵의학은 방사성의약품의 병변 집적 여부 에 따라 양성상과 음성상으로 구분할 수 있는데, 병변의 생리/생화학적 기전과 방사성의약품의 집적 기전에 따라 병변에 집적하는 양상이 다르다. 실험 에서는 인체 내 병변에 방사성의약품이 균일하게 집적되어 분포한다는 것으로 가정하고, 양성상을 기준으로 실험함으로써, 2가지 장비를 통해 획득한 팬텀 영상의 SUV를 측정하여 변화의 정도를 비교
(a) (b)
Fig. 1. (a) : It is possible to acquire screen image by assuming the phantom consisting of six globes with different diameters as legion of human body. (b) : If screen images are acquired by injecting
radiopharmaceuticals into phantom, it is possible to analyze coefficients with positive phases.
실험은 Fig. 2(a)와 같이 PET-CT (biograph truepoint 64, siemens, Germany)와 Fig. 2(b)와 같이 SPECT-CT (discovery 670, GE, USA) 스캐너로 영상 을 획득하였다. SUV 측정을 위해 제작된 팬텀의 무게와 길이를 측정하였다. 또한 팬텀에 주입한 방 사성의약품의 물리적 반감기에 따라 구와 배후 방 사능의 비율 차이를 방지하기 위해 팬텀 제작 직후 영상을 획득하였으며, 팬텀 제작 시간과 영상획득 시작 시간을 적용하여 붕괴 (decay) 보정을 하였다.
또한 근본적으로 영상을 획득하는 원리가 다르기 에 방사성의약품의 종류, 스캔 조건 등을 모두 같 이 적용할 수 없지만, CT를 이용하여 감쇠 (attenuation) 보정과 산란 (scatter) 보정을 모두 적용 하였다.[9]
(a) (b)
Fig. 2. (a) : After phantom was fixed on PET-CT table, CT scanning was done to acquire PET screen image. PET screen image was scanned with 1, 2 min/bed condition. (b) : Phantom fixture and CT scanning were done with the same procedure as PET-CT test case to acquire SPECT-CT screen image.
The image was acquired by rotating the camera 360°.
"J. Korean Soc. Radiol., Vol. 12, No. 5, October 2018"
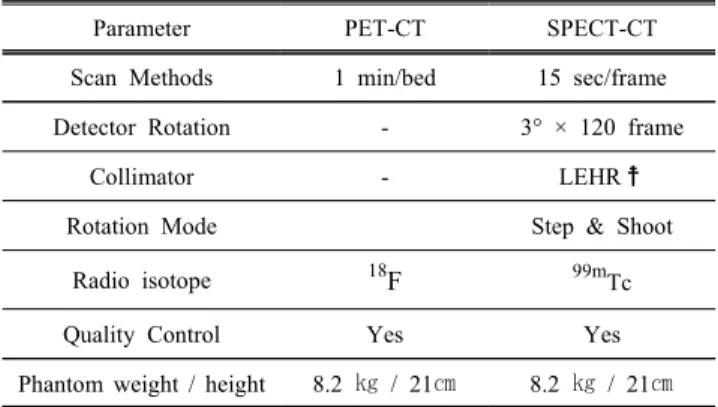
동시계수회로를 통해 소멸광자선을 수집함으로써 영상을 획득하므로, 스캐너가 회전하지 않으며, 조 준기를 사용하지 않는다. 따라서 두 가지 스캐너의 영상획득 원리를 고려하여 스캔 시간 및 산란/감쇠 보정 등 Table 1과 같이 임상 조건에 최적화된 프 로토콜을 적용하여 실험하였다.[10]
Table 1. Conditions to acquire a PET-CT scan and SPECT-CT scan.
Parameter PET-CT SPECT-CT
Scan Methods 1 min/bed 15 sec/frame Detector Rotation - 3° × 120 frame
Collimator - LEHR☨
Rotation Mode Step & Shoot
Radio isotope 18F 99mTc
Quality Control Yes Yes
Phantom weight / height 8.2 ㎏ / 21㎝ 8.2 ㎏ / 21㎝
☨; low energy high resolution
2. 방사성동위원소
PET-CT와 SPECT-CT 두 가지로 구분하여 실험 하였다. 각 스캐너의 영상획득 원리가 다르므로 사 용하는 방사성동위원소를 다르게 사용하였다.
PET-CT는 양성자 과잉핵종이 베타+ 붕괴하는 과정 에서 양성자가 중성자로 바뀌면서 방출하는 양전 자에 의한 소멸 복사선을 대칭되는 디텍터로 획득 하여 영상을 재구성한다. 따라서 핵의학에서 가장 많이 이용하는 양전자 방출 핵종인 18F (photon energy: 511 keV, half life: 109.8 min, cyclotron)을 사 용하였다. SPECT-CT의 경우 단일 광자를 방출하는 핵이성체 전이 핵종으로 핵의학에서 가장 많이 이 용하는 99mTc (photon energy: 141 keV, half life: 6.03 hrs, generator)을 이용하였다. 미국전기제조협회 (NEMA; National Electric Manufacture Association) 가이드라인에 따라 팬텀을 구성하는 6개의 구와 배 후의 방사능을 Table 2와 같이 8:1, 4:1로 각각 균일 하게 방사성동위원소를 주입함으로써 병변과 주변 조직의 양성상을 구현하였다.[11]
Table 2. Methods to make a hot spheres and backgrounds in phantom.
Radioactivity ratio Sphere BKG✝
4:1
Dose (kBq) 37,000 88,800
Water (㏄) 593.75 5,700.00
Specific Activity (kBq/cc) 62.31579 15.57895
8:1
Dose (kBq) 37,000 88,800
Water (㏄) 296.88 5,700.00
Specific Activity (kBq/cc) 124.63160 15.57895
✝; background
3. 영상 재구성
PET-CT와 SPECT-CT 스캔 후 획득한 데이터는 단층영상구현 방법으로 재구성하였다. 두 가지 스 캐너의 영상재구성 원리는 같으나 사용하는 프로 그램과 적용된 알고리즘의 차이가 있으므로, 영상 의 질을 최대한 같은 수준으로 맞추도록 조건을 조 정하였다. 저 계수영역에서 신호 대 잡음비 (SNR;
Signal to Noise Ratio)가 높고, 고 계수영역에서 허 상을 감소시킬 수 있으며, 측정률 오차로 나타나는 부정확한 영역의 보정이 가능하고 재구성 과정의 안정성이 높은 축차근사법 (OSEM; Ordered Subject-Expectation Maximization)을 이용하여 영상 을 재구성하였다.[12] PET-CT의 경우 SPECT-CT에 적용하지 않는 시간에 의한 소멸광자 보정법 (TOF;
Time of Flight)을 추가로 적용하여 영상을 재구성 하였으며,[13] 모든 실험에는 Table 3과 같은 영상획 득 조건으로 감쇠보정과 산란보정을 적용하였다.
Table 3. Conditions to image reconstruction a PET-CT scan and SPECT-CT scan.
Parameter PET-CT SPECT-CT
Methods OSEM OSEM
Iteration 2 5
Subset 21, 24 10
TOF Yes -
Scatter Correction Yes Yes
Attenuation Correction Yes Yes
4. 자료분석
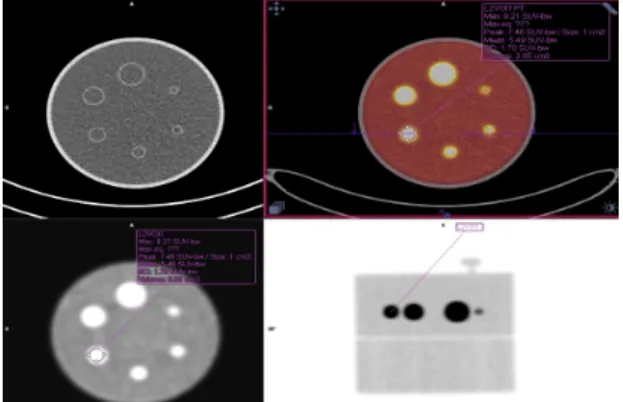
실험을 통해 획득한 영상은 스캐너 제조사에서 제공하는 워크스테이션을 이용하였다. PET-CT 영 상은 Fig. 3과 같이 syngo. via (siemens, germany) 프로그램을 이용하였으며, SPECT-CT 영상은 Fig.
4와 같이 Q. matrix (GE, USA) 프로그램을 사용하 였다. 측정자의 주관적 오차를 방지하기 위해 횡단 면 영상에서 6개의 구에 관심영역을 자동으로 설정 하였으며, 작은 크기의 병변에서 과소평가되는 부 분체적현상을 고려하여 SUV의 최대수치 (SUVmax) 를 분석하였다.
Fig. 3. By setting the interesting areas with automatic mode on 6 globes, SUVmax of PET-CT screen image (transverse plane) was measured.
Fig. 4. By setting the interesting areas with automatic mode on 6 globes, SUVmax of SPET-CT screen image (transverse plane) was measured.
두 실험간의 유의성 분석을 위해 대응표본 t 검 정 (paired sample t-test, SPSS, ver. 22, IBM)을 이용 하여분석한 후, 유의확률 P>0.05을 기준으로 실험
Ⅲ. RESULT
실험의 정확도를 위해 팬텀의 6개의 구와 배후방 사능의 비율을 8:1과 4:1로 구분하여 팬텀을 모사하 였다. 팬텀을 이용한 실험이지만 임상 적용 가능성 을 판단하기 위해 임상에서 적용하고 있는 프로토 콜을 기반으로 PET-CT는 1 min/bed, SPECT-CT는 15 sec/frame으로 설정하여 영상을 획득하였다. 획 득한 PET-CT 영상은 축차근사법을 이용하여 TOF (iteration: 2, subset; 21)와 반복재구성법 (iteration: 2, subset; 24)을 이용하였고, SPECT-CT 영상은 반복 재구성법 (iteration: 5, subset; 10)을 이용하여 영상 재구성하였다. 또한 SUVmax의 유의성을 평가하기 위해 Fig. 5, 6과 같이 관심영역을 ROI (region of interest)와 VOI (volume of interest) 두 가지로 구분 하여 측정하였다.
Fig. 5. With 8:1 ratio of 6 globes and background radioactivity, positive screen image was acquired, and, by differentiating it into ROI and VOI, SUVmax was measured.
Fig. 6. With 4:1 ratio of 6 globes and background radioactivity, positive screen image was acquired, and, by differentiating it into ROI and VOI, SUVmax was
"J. Korean Soc. Radiol., Vol. 12, No. 5, October 2018"
8:1 비율 PET-CT 영상을 TOF로 영상을 재구성하 여 SUVmaxmaxmax를 측정한 실험결과는 Table 4와 같이 구 의 지름에 따라 ROI는 8.51, 8.85, 9.11, 8.04, 5.64, 3.69이었고, VOI는 8.57, 9.00, 9.21, 8.11, 6.00, 3.94 이었다. 반복재구성법에 의한 SUVmaxmaxmax의 경우 ROI 는 8.09, 8.12, 8.01, 6.58, 4.63, 3.56이었고, VOI는 8.27, 8.20, 8.08, 6.61, 4.86, 3.77이었다.
Table 4. SUVmax results of PET-CT scan (8:1 ratio).
Reconstruction Sphere (㎖) SUVmax
ROI VOI
TOF Methods
16.0 8.51 8.57
8.0 8.85 9.00
4.0 9.11 9.21
2.0 8.04 8.11
1.0 5.64 6.00
0.5 3.69 3.94
Iterative Methods
16.0 8.09 8.27
8.0 8.12 8.20
4.0 8.01 8.08
2.0 6.58 6.61
1.0 4.63 4.86
0.5 3.56 3.77
또한 4:1 비율 PET-CT 영상을 TOF로 영상을 재 구성하여 SUVmaxmaxmax를 측정한 실험결과는 Table 5와 같이 구의 지름에 따라 ROI는 5.47, 5.53, 5.28, 4.83, 3.35, 2.41이었고, VOI는 5.68, 5.62, 5.75, 5.27, 3.67, 2.46이었다. 반복재구성법에 의한 SUVmaxmaxmax의 경우 ROI는 5.39, 5.45, 4.61, 3.89, 2.91, 2.24이었고, VOI 는 5.70, 5.53, 5.04, 4.19, 3.12, 2.27이었다.
Table 5. SUVmax results of PET-CT scan (4:1 ratio).
Reconstruction Sphere (㎖) SUVmax
ROI VOI
TOF Methods
16.0 5.47 5.68
8.0 5.53 5.62
4.0 5.28 5.75
2.0 4.83 5.27
1.0 3.35 3.67
0.5 2.41 2.46
Iterative Methods
16.0 5.39 5.70
8.0 5.45 5.53
4.0 4.61 5.04
2.0 3.89 4.19
1.0 2.91 3.12
0.5 2.24 2.27
한편 SPECT-CT의 경우 8:1 비율로 영상을 획득 한 후 반복재구성법으로 영상을 재구성한 후 측정 한 SUVmaxmaxmax는 Table 6와 같이 ROI는 구의 지름에 따
라 12.47, 11.93, 9.20, 6.57, 4.84, 2.26이었고, VOI는 13.66, 13.32, 9.88, 7.89, 6.90, 2.55이었다.
Table 6. SUVmax results of SPECT-CT scan (8:1 ratio).
Reconstruction Sphere (㎖) SUVmax
ROI VOI
Iterative Methods
16.0 12.47 13.66
8.0 11.93 13.32
4.0 9.20 9.88
2.0 6.57 7.89
1.0 4.84 6.90
0.5 2.26 2.55
그리고 4:1 비율로 획득한 영상의 SUVmaxmaxmax는 Table 7과 같이 ROI는 6.14, 6.43, 4.31, 4.09, 2.70, 1.59이었고, VOI는 7.88, 7.39, 4.70, 4.09, 2.70, 1.46 이었다.
Table 7. SUVmax results of SPECT-CT scan (4:1 ratio).
Reconstruction Sphere (㎖) SUVmax
ROI VOI
Iterative Methods
16.0 6.14 7.88
8.0 6.43 7.39
4.0 4.31 4.70
2.0 4.09 4.09
1.0 2.70 2.70
0.5 1.59 1.46
또한 실험의 SUVmaxmaxmax 결과를 대응표본 t 검정으로 분석한 결과는 Table 8과 같이 모두 유의확률 (P>0.05) 기준으로 유의한 차이가 없었다.
Table 8. Results of statistical analysis for all experiments (SUVmax).
Activity PET-CT SPECT-CT P-value
8:1
TOF Iterative ROI 0.58
VOI 0.20
Iterative Iterative ROI 0.19
VOI 0.07
4:1
TOF Iterative ROI 0.46
VOI 0.95
Iterative Iterative ROI 0.64
VOI 0.48
Ⅳ. DISCUSSION
이번 연구는 핵의학에서 물리적, 화학적, 생물학 적으로 다른 원리로 단층 영상을 획득하는 PET-CT 와 SPECT-CT를 대상으로 실험하였다. SUVmaxmaxmax와 같은 정량분석을 통해 객관적인 진단정보를 제공
할 수 있는 핵의학 진단은 두 가지 스캐너에 같이 적용할 수 없다.[14] PET-CT와 SPECT-CT는 이용하 는 방사성의약품의 물리적 특성에 차이가 있으므 로 감마선의 발생과 에너지 등 여러 가지 특성이 다르다. 이러한 이유로 두 장비의 영상획득 원리 및 영상 재구성 방법이 다르므로 실험에 따른 결과 를 절대적인 측면에서 비교하는 것에는 한계가 있 다. 최근 SPECT-CT의 영상획득 기술이 발전함에 따라 질환의 정량분석이 시도되고 있으나 객관적 자료의 부족으로 임상에 제한적으로 적용하고 있 는 실정이다. 관련 연구에 따르면 척추와 골반 등 뼈질환 혹은 뼈전이암 환자의 병변 SUV 정량분석 을 통한 두 장비의 SUV가 직선적 관계가 보고되었 으며, 이를 통해 임상 적용 가능성이 예상된다.[15]
국내 일부 의료기관에서 전이암 환자의 뼈검사에 SPECT-CT의 SUV를 적용하여 진단에 부가정보 활 용을 시도하고 있으며, 같은 환자를 PET-CT 영상 과 함께 비교하는 경우도 있지만, 이와 같은 핵의 학 진단방법은 현재까지 임상에서 활발하게 사용 하고 있지 않다. 따라서 과거부터 현재까지 활발하 게 진단에 이용해왔던 PET-CT의 SUVmaxmaxmax와 비교하 여, 최근 개발되어 임상에 적용되고 있는 SPECT-CT의 SUVmaxmaxmax에 대한 상관관계를 팬텀실험 을 통해 분석함으로써 임상적 유용성을 평가하였 다. 이 과정에서 실제 질환을 가지고 있는 같은 환 자를 대상으로 비교 평가하는 것이 정확하지만, 이 연구에서 팬텀을 대상으로 실험한 것이 제한점이 다.[16] 또한, SUVmaxmaxmax는 종양에서 방사성의약품의 섭 취 정도에 대한 평가방법으로 항상 특이적인 것은 아니며, 반정량적으로 수치화한 것으로 정량적인 자료와 차이가 있다.[17] 또한 SUVmaxmaxmax는 Eq. 1과 같 이 인체의 체격, 스캔시간, 관심영역의 설정, 영상 처리방법 등 다양한 요인에 의해 영향을 받을 수 있기에, 팬텀 실험으로 두 가지 스캐너의 상관관계 를 일반화하기에 어렵다.
†
(1) Eq. 1. Under the assumption that administered radiopharmaceuticals are equally distributed in body and they are not excreted, tissue radioactivity is set to '1', and tumor radioactivity is expressed as relative
그리고 실험에 이용한 영상재구성방법인 OSEM 은 통계적 잡음이 작기 때문에 SNR이 여과 후 역 투영법 (FBP; Filtered Back Projection) 등에 비교해 우수하다. 그러나 OSEM은 모든 투영 데이터를 소 수의 작은 부분집합 (subset)으로 나누어 처리하는 과정에서 정량분석의 결과가 FBP에 비해 다소 부 정확한 연구 결과가 있다.[12] 따라서 영상 재구성 방법에 따라 정량분석 결과가 차이가 발생한다. 이 번 연구는 대표적인 핵의학 단층영상스캔방법인 SPECT와 PET의 SUV 상관관계를 통해 임상적용 가능성을 분석하는 것에 의미가 있다. 환자를 대상 으로 진단 영상을 제공하는 임상의 스캔 목적에 부 합하는 실험 조건을 맞추기 위해 OSEM 방법을 적 용하여 SUVmaxmaxmax를 측정하였으므로, 영상 재구성방법 에 따른 차이를 배제할 수 없다. 따라서 이처럼 팬 텀 실험, 스캐너 영상획득 원리, 영상재구성 방법, 방사성의약품 등의 차이와 같은 연구의 제한점이 있으므로 향후 인체를 대상으로 한 연구를 통해 관 련 정보를 분석하여 임상 적용 가능성을 재평가할 필요가 있다.
Ⅴ. CONCLUSION
팬텀실험을 통해 PET-CT와 SPECT-CT의 SUVmaxmaxmax
는 유의한 수준 내에서 일정한 상관관계를 가지며, 같이 평가되었다. 따라서 SPECT-CT를 이용한 SUVmaxmaxmax 정량분석은 본 연구를 통해 일반화하기에 제한적이지만 임상에 실험적 정보를 제공할 수 있 으므로, 임상실험과 같은 관련 실험을 통한 추가 연구가 필요할 것으로 판단된다. 그런데도 정상적 인 SUVmaxmaxmax는 PET와 SPECT와 같은 스캐너의 종류 와 방사성의약품 종류 및 투여량, 환자의 상태 등 여러 가지 환경에 따라 다양하게 측정될 수 있다.
그러므로 SPECT의 SUVmaxmaxmax는 모든 의료기관이나 실험실에서 특정 환자의 모집단에 대한 충분한 인 체실험을 통해 SUVmaxmaxmax의 정상범위 기준을 설정하 여 임상 적용해야 할 것으로 생각한다.
Reference
[1] Michael C. Roarke, Ba D. Nguyen, Barbara A.
"J. Korean Soc. Radiol., Vol. 12, No. 5, October 2018"
radiology," American Journal of Roentgenology, Vol.
191, No. 3, pp. 135-150, 2008.
[2] Delbeke D., Schöder H., Martin WH., Wahl RL.,
"Hybrid imaging (SPECT-CT and PET-CT):
improving therapeutic decisions," Seminars in Nuclear Medicine, Vol. 39, No. 5, pp. 308-340, 2009.
[3] Paul E. Kinahan, James W. Fletcher, "PET/CT standardized uptake values (SUVs) in clinical practice and assessing response to therapy," Seminars Ultrasound, CT and MR, Vol. 31, No. 6, pp.
496-505, 2010.
[4] Aung Zaw Win, Carina Mari Aparici, "Normal SUV values measured from NaF18-PET-CT bone scan studies," Public Library of Science One, Vol. 9, No.
9, pp. 78-86, 2014.
[5] Tomohiro Kaneta, Matsuyoshi Ogawa, Hiromitsu Daisaki, Shintaro Nawata, Keisuke Yoshida, Tomio Inoue, "SUV measurement of normal vertebrae using SPECT-CT with Tc-99m methylene diphosphonate,"
American Journal of Nuclear Medicine and Molecular Imaging, Vol. 6, No. 5, pp. 262-268, 2016.
[6] Min-Seok Suh, Won-Woo Lee, Young-Kyun Kim, Pil-Young Yun, Sang-Eun Kim, "Maximum standardized uptake value of 99mTc
hydroxymethylene diphosphonate SPECT-CT for the evaluation of temporomandibular joint disorder,"
Radiology, Vol. 280, No. 3, pp. 890-896, 2016
[7] Wang R., Duan X., Shen C., Han D., Ma J., Hulin W., Xu X., Qin T., Fan Q., Zhang Z., Shi W., Guo Y., "A retrospective study of SPECT/CT scans using SUV measurement of the normal pelvis with Tc-99m methylene diphosphonate," Journal of X-ray science and technology, 2018.
[8] Kaneta T., Sun N., Ogawa M., Iizuka H., Arisawa T., Hino-Shishikura A., Yoshida K., Inoue T.,
"Variation and repeatability of measured standardized uptake values depending on actual values: a phantom study," American Journal of Nuclear Medicine and Molecular Imaging, Vol. 7, No. 5, pp. 204-211, 2017.
[9] Pasha Razifar Emai, Mattias Sandström, Harald Schnieder, Bengt Långström, Enn Maripuu, Ewert Bengtsson, Mats Bergström, "Noise correlation in PET, CT, SPECT and PET-CT data evaluated using autocorrelation function: a phantom study on data,
reconstructed using FBP and OSEM," Bio Med Central Med Imaging, Vol. 5, No. 5, pp. 114-123, 2005.
[10] Nicholas Plaxton, Valeria Moncayo, Bruce Barron, Raghuveer Halkar, "Factors that influence standard uptake values in FDG PET-CT," Journal of Nuclear Medicine, Vol. 55, No. 1, 1356, 2014.
[11] Albert Flotats, Juhani Knuuti, Matthias Gutberlet, Claudio Marcassa, Frank M. Bengel, Philippe A.
Kaufmann, Michael R. Rees, Birger Hesse, "Hybrid cardiac imaging: SPECT-CT and PET-CT. a joint position statement by the european association of nuclear medicine (EANM), the european society of cardiac radiology (ESCR) and the european council of nuclear cardiology (ECNC)," Europe Journal of Nuclear Medicine and Molecular Imaging, Vol. 38, pp. 201-211, 2011.
[12] Judit Lantos, Erik S. Mittra, Craig S. Levin, Andrei Iagaru, "Standard OSEM vs. regularized PET image reconstruction: qualitative and quantitative
comparison using phantom data and various clinical radiopharmaceuticals," American Journal of Nuclear Medicine and Molecular Imaging, Vol. 8, No. 2, pp.
110-118, 2018.
[13] Lindström E., Sundin A., Trampal C., Lindsjö L., Ilan E., Danfors T., Antoni G., Sörensen J., Lubberink M., "Evaluation of penalized likelihood estimation reconstruction on a digital time-of-flight PET/CT scanner for 18F-FDG whole-body examinations," Journal of Nuclear Medicine, 2018.
[14] Rodney J. Hicks, Michael S. Hofman, "Is there still a role for SPECT-CT in oncology in the PET-CT era?” Nature Reviews Clinical Oncology, Vol. 9, No. 12, pp. 712-720, 2012.
[15] Ichiei Kuji, Tomohiko Yamane, Akira Seto, Yota Yasumizu, Suguru Shirotake, Masafumi Oyama,
"Skeletal standardized uptake values obtained by quantitative SPECT/CT as an osteoblastic biomarker for the discrimination of active bone metastasis in prostate cancer," European Journal of Hybrid Imaging, Vol. 1, No. 2, pp. 1-16, 2017.
[16] Bohdan Bybel, Richard C. Brunken, Frank P. Di Filippo, Donald R. Neumann, Guiyun Wu, Manuel D. Cerqueira, "SPECT-CT imaging: clinical utility of an emerging technology," Radiographics :a review
publication of the Radiological Society of North America, Inc, Vol. 28, No. 4, pp. 1097-1210, 2008.
[17] Nakahara T., Daisaki H., Yamamoto Y., Iimori T., Miyagawa K., Okamoto T., Owaki Y., Yada N., Sawada K., Tokorodani R., Jinzaki M., "Use of a digital phantom developed by QIBA for harmonizing SUVs obtained from the state-of-the-art SPECT-CT systems: a multicenter study," Europe Journal of Nuclear Medicine and Molecular Imaging Research, Vol. 53, No. 7, pp. 167-178, 2017.
"J. Korean Soc. Radiol., Vol. 12, No. 5, October 2018"
융합영상장비의 표준섭취계수 상관관계 분석
김진의,1 김정수,2 최남길,1 한재복1,*
1동신대학교 방사선학과
2동남보건대학교 방사선과
최근 핵의학에서 진단가치의 향상을 위해 PET-CT에서 이용하고 있는 반정량지표인 SUV를 SPECT-CT에 도입하여 적용하고 있다. 따라서 두 가지 스캐너의 SUVmaxmaxmax를 팬텀실험을 통해 상관관계를 분석하여 임상 적용 가능성을 평가하였다. 부피가 다른 6개의 구로 제작된 팬텀에 방사성의약품 (18F, 99mTc)을 배후방사능 을 고려하여 8:1과 4:1 비율로 주입하고, 임상 프로토콜을 기반으로 PET-CT와 SPECT-CT 스캐너로 양성상 을 획득한 후 관심영역을 ROI와 VOI로 구분하여 SUVmaxmaxmax를 측정하여 분석하였다. 실험결과 두 가지 스캐너 로 측정한 SUVmaxmaxmax는 통계적으로 유의한 차이가 없었다 (P>0.05). 따라서 PET-CT와 SPECT-CT의 SUVmaxmaxmax 는 유의한 수준 내에서 일정한 상관관계를 가지며, 같이 평가되었다. 따라서 SPECT-CT를 이용한 SUVmaxmaxmax 정량 분석은 본 연구를 통해 일반화하기에 제한적이지만 임상에 실험적 정보를 제공할 수 있으므로, 임상실험과 같은 관련 실험을 통한 추가 연구가 필요할 것으로 판단된다.
중심단어: 융합영상장비, 표준섭취계수, PET-CT, SPECT-CT
성명 소속 직위
(제1저자) 김진의 동신대학교 방사선학과 대학원생
(공동)
김정수 동남보건대학교 방사선과 교수
최남길 동신대학교 방사선학과 교수
(교신) 한재복 동신대학교 방사선학과 교수
연구자 정보 이력