http://www.culinary.re.kr
INTRODUCTION
Since the 1960s, Korea has gone through rapid social and econo- mic developments, which resulted in urbanization phenomena and the benefits of civilization. Subsequently, they brought about significant changes in our eating patterns. The patterns can be divided broadly into two parts which are the rise in chronic-disease risk elements derived from excess fat-intake and the simplification of menu resulted from the expansion of social participation of wives, as opposed to our traditional eating behaviors(Song, 1996).
The simplification of diet has caused our adolescents who need to eat nutritionally balanced meals to frequently have easy and ready foods such as frozen foods. Several researchers argue that meals have changed from being nutritionally balanced to stimulative and taste-oriented(Lee, et al., 2010). This appears to be due to the facts;
the number of meals children can have together with parents or family members have relatively been reduced; family members’
active time slots are all different, hence, eating alone has become a normal habit. The point that breakfast is often skipped or eat undernourished foods which leads to undesirable eating lifestyle attitude is not a surprising issue at all(Choi, 2001). In addition, such phenomena as food avoidance, excessive studying, concerns ab- out futures, sleep deprivation, and sustained stress resulted in deteriorating our adolescents’ health(Ahn, 1996).
According to the 2005 National Nutrition Survey(Ministry of Welfare, 2006), each rate of children(7~12 years old) who do not eat breakfast, lunch, and dinner with their family was 19.9%, 94.7%, and 7.8%. For adolescents(13~19 years old) without having break-
fast, lunch, and dinner, they presented 45.6%, 95.8%, and 38.6%, respectively. These statistics imply that as children grow older, they gradually lose opportunities to strengthen family bonds through conversations during family meal(Choi, 2001).
Family meals are not merely opportunities to have meals with family, but more importantly children are allowed to learn through their parents, their family traditions and experience a variety of foods through which they develop good eating behaviors(Wax- man, 2006). It was found that a habit of having meals with family, compared to a convention of having meals alone, makes family members to eat a variety of appropriately-nutritious foods. As a result, it helps them realize good health and develop healthy lifestyles(Compa et al., 2002). While preparing family meals th- rough interactive cooperation, children naturally establish tastes and preferences for foods that can raise their satisfaction about meals. From this perspective, it is importance to analyze the factors associated with the wrong eating habits influenced by parents and to identify the level of meal satisfaction during high school life.
The level of meal satisfaction associated with individual’s per- ception refers to the positive food evaluation that reflects how well a given meal satisfies the needs, demands, and expectations of an individual. Even for two kinds of foods prepared with identical ingredients, depending on the cooking method and diverse menu, the level of individual satisfaction and food receptively would vary.
Therefore, constant efforts to raise satisfaction through studying preferences and intake frequency of a variety of foods are nece- ssary(Marian, 1991). As food receptivity according to personal ex- perience varies considerably, appropriate methods to raise satis-
A Survey on the Home Meal Satisfaction Levels of High School Students
Geum-Ran Kim and Mi-Jung Kim¶
Dept. of Food Science and Nutrition, Anyang University,Anyang 430-714, Korea
ABSTRACT: This study aims to identify the importance and satisfaction levels of home meals of high school students. A developed survey was conducted on July 10 through July 13, 2012. Of 12 high schools located in three different areas in South Korea, three high schools were singled out. For the analyses of the study, the following statistical methods were employed: frequency, cross- tabulation, independent sample t-test, one-way ANOVA, and Duncan as a post-hoc test. As a result, food experiences and education through home meals during childhood promote close ties with other family members and help them develop the food taste and preference that can naturally raise the meal satisfaction level by developing proper eating habit. More implications and discussion are suggested.
Keywords: Meal, Satisfaction, High School, Taste, Eating Behavior, Knowledge
§ Corresponding Author: Mi-Jung Kim, Dr., Ph.D., Dept. of Food Science and Nutrition, Anyang University, 708-113, Anyang-5dong, Manan-gu, Anyang-si, Gyeonggi-do, 430-714, Korea, Tel. +82-31-467-0964, Fax. +82-31-463-1371, E-mail: [email protected]
Received: 28 August, 2014, Revised: 23 September, 2014, Accepted: 20 October, 2014.
faction of a desirable meal based on individual preference should be considered. In the same respect, numerous studies have su- ggested ways to raise satisfaction of meals.
However, most of the extant studies focusing on Korean high school students have mainly dealt with eating behavior and food preference(Lee, & Jang, 2005; Yi & Kwak, 2007). As such, the topics have been restricted to studies on investigating the factors in- fluencing the satisfaction of school meal(Lee & Park, 2010; Yang &
Park, 2008).
Recently, not only because much attention to the importance of having meals at home are revealed(Choi, 2001; Lee et al., 2008; Lee et al., 2009; Sung et al., 2001), but also because a vast array of studies on the satisfaction about family meals have been carried out(Kwon et al., 2013), this study that highlights the importance of family meals is needed.
LITERATUREREVIEWS Eating Behaviors
Diet and lifestyle patterns appear to be the norms and customs of our daily lives. The norms and customs include collective eating behaviors(Park et al., 2000). So, eating behaviors relating to the issues about when, where, with whom, how, and why an individual or a group eats a certain food, as a lifestyle pattern appearing between humans and foods, can be considered types of foods one often eat without any full consideration of whether the food intake is large or small. It possesses an inseparable relation with other activity pattern(Lee et al., 2011). Therefore, it states that eating behaviors are automatically repeated acts(Choi, 2001). They are reflective and unconscious eating behaviors that have been acquired through learning process. So individuals can react app- ropriately to different situations. Birch(1987) stated that childhood experiences with foods play a very important role in forming food preferences and eating behaviour related to food intake. The food preferences and eating behaviors formed during a childhood period affect the food choices. Thus, the nutritional status of individual’s entire life is determined.
The Level of Satisfaction about Family Meals
In recent years, with growing expectations for dietary lifestyle, the importance of preference for food and food satisfaction level is emphasized. If, however, foods do not satisfy individual’s expec- tations, it is difficult to result in good health as they get discarded or remain leftover. This is because as food palatability and sa- tisfaction of an individual affect the food choice and amount of nutrition intake(Rozin, 1990). However, for children whose selec- tion results are directly linked to physical growth, before asking them what their food preferences are, they should be properly educated as to how different foods will affect them. The range of selection and food preference can vary depending on how their parents value foods at home and whether or not they have experienced tastes of different foods during their early childhood.
When these understandings precede, they realize what foods they really like and are able to make right choices.
Weinstein(2005) defined family meals as media through which family members become aware of the concept of family or co- mmunity. The basis of Korean family meals can be traced back to
the agricultural society when all family members worked and acted as a group. Baek SK et al.(1990) stated that having meals together with family is important in improving children’s emotional stability and family meal environments. In a study on the nutrition ecology and behavior of elementary school students(Sung et al., 2001), the students were asked to answer about with whom they enjoy having meals with the most. The result showed that students feel happier when they have meals with families(male 67.3%, female 76.8%). It provided a lesson that having meals together with family is an important factor that influences the psychological emotions of children who still have not formed eating behaviors yet. In addition, according to another study, having meals with family that provides sufficient opportunities to eat a wide variety of foods compared to earing alone, brings good health to family members and affects positive lifestyle habits(Cason, 2006). In a study, it addressed that eating meals with family provides opportunities to learn about family traditions(Waxman, 2006).
According to a study conducted in Japan in 1991, it reported that children who are used to having meals alone tend to form such negative eating behaviors as loss of appetite, regular hea- daches and stomachaches, pounding heartbeat, and others(Ada- chi et al., 2000). It also stated that adolescent groups with mental problems had fewer meals with family and participated in fewer family events and activities, compared to the adolescent groups with no mental problems(Cason, 2006). Lee et al., (2008) also argued that the eating attitudes of middle and high school stu- dents who eat alone are undesirable. In another study, it reported that the children who have meals with family more than 7 times a week, compared to children who have meals with families less than 2 times a week, develop their good characters and are less likely to have depression, drinking, and smoking issues(Vieon &
Manning, 2003).
The level of meal satisfaction indicates how well a given meal satisfies one’s needs, demands, and expectations requirement.
Most of the past studies on meal satisfaction level focused on school foodservice. This was because of studies conducted since 2006 to help with multilateral policies from city and provincial educational departments associated with providing safe and tasty school food services. It pointed out that the best approach to grasp the end users’ awareness such as satisfaction is by directly que- stioning end users(Meyer, 2000; McCleary & Weaver, 1982). Since the latter part of the 2000s, studies on the satisfaction levels of school meal qualities have been continuously conducted to achi- eve the quality improvement and operational stability of the sch- ool meal programs(Yi et al., 2009). Unlike previous studies which targeted students only, recent studies have expanded their targets to include parents and teachers to measure the recognition degree of satisfaction (Lee & Jang, 2005; Yang & Park, 2008).
METHOD Survey Contents
Survey subjects were divided into male and female student groups, then the following items were investigated: The level of satisfaction of present family meals, the first factor affecting the level of satisfaction of one's meal, the first eating behavior after having a satisfying meal, the first activity after(30 min~1 hr) a sa-
tisfying meal, reasons for a low level of meal satisfaction, the first activity after an unsatisfying meal, effects of an unsatisfying meal on studying, usual activities after an unsatisfying meal, and one's food selection criteria which greatly affect the level of meal sa- tisfaction.
Respondents and Data Collection
12 high schools around Sinchon in Seoul, Gunpo in Gyeonggi-do, Changyeong in Gyeongnam-do, which agreed to participate in survey, three high schools were asked to complete a questionnaire.
Survey was conducted between July 10 to July 13, 2012. A pre- liminary survey was carried out to modify and supplement the undeveloped questionnaire. After its revision, survey with deve- loped questionnaire was carried out. The respondents were asked to complete the revised questionnaire. Once the objectives of the survey was explained to the homeroom teachers, surveyors ex- plained the objectives of the survey to the participating 10th and 11th grade students before completing the questionnaire. Total 901 completed questionnaires(325 from Seoul, 288 from Gyeonggi-do, and 288 from Gyeongnam-do) were returned and analyzed.
Statistical Analysis
Using SPSS 17.0 version, frequency analysis was performed to identify the demographic characteristics of the research subjects.
Additionally, cross tabulation, independent samples T-test and one-way ANOVA were performed to examine the level of meal satisfaction of high school students and to explore if there are differences depending on the demographic characteristics of re- search subjects. Finally, Duncan test, as a method of post-hoc, was conducted.
RESULTS
Demographic Characteristics
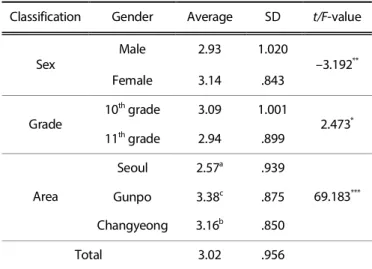
To look over the demographic characteristics, frequency analysis was performed. The results are presented in Table 1. The majorities of gender, grade, and area were male(58.9%), 10th grade(51.8%), 1, and Seoul(36.1%), respectively.
The Level of Present Meal Satisfaction
The results of the level of present meal satisfaction are pre- Table 1. Demographic characteristics
Classification Frequency (N) Percent (%)
Sex Male 531 58.9
Female 370 41.1
Grade 10th grade 467 51.8
11th grade 434 48.2
Area
Seoul 325 36.1
Gunpo 288 32.0
Changyeong 288 32.0
Total 901 100.0
Table 2. The level of present meal satisfaction
Classification Gender Average SD t/F-value
Sex Male 2.93 1.020
–3.192**
Female 3.14 .843
Grade 10th grade 3.09 1.001
2.473* 11th grade 2.94 .899
Area
Seoul 2.57a .939
69.183***
Gunpo 3.38c .875
Changyeong 3.16b .850
Total 3.02 .956
* p<0.05, ** p<0.01, *** p<0.001.
Duncan : a<b<c.
sented in Table 2. The average overall level of present meal sa- tisfaction has been found to be 3.02 out of 5. First, the results from gender showed the significant difference in the level of average satisfaction at p<0.05. This result showed a similar pattern with a study on the Iksan high school meal satisfaction(Lee & Park, 2010).
However, in another study of foods satisfaction level relating to food items such as rice, soup, side dishes, and kimchi(Ly et al., 2005), the result showed a different pattern, which describes that the level of satisfaction for male students was higher than female students. The results from Grade revealed that the level of average satisfaction is a bit higher for 10th grade students: 10th grade (M=3.09) and 11th grade(M=2.94). The results from area showed that the Gunpo’s average satisfaction level is the highest(p<0,05):
Gunpo(M=3.38), Changyeong(M=3.16), and Seoul(M=2.57).
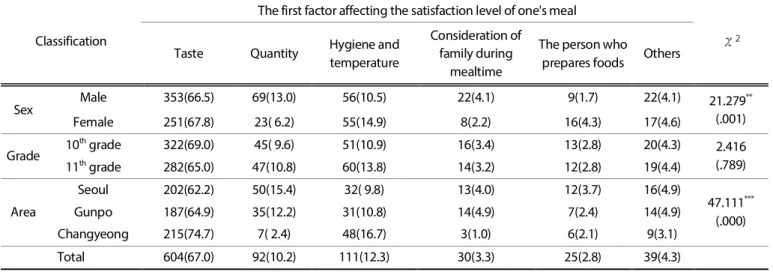
The First Factor Affecting the Satisfaction Level of One's Meal When looking at the results of Table 3, on the ‘The first factor affecting the satisfaction level of one's meal’, ‘Taste’ was the most frequent response with 604 (67.0%), followed by ‘Hygiene and temperature’ 111 (12.3%), followed by ‘Quantity’ 92 (10.2%), fo- llowed by ‘Consideration of family during mealtime’ 30 (3.3%), and followed by ‘Person who prepares food’ 25 (2.8%). The result that ‘Taste’ was the most important factor when determining the level of meal satisfaction was similar to the results of the School Meal Satisfaction Level studies by Jang and Kim(2005), and Kim et al.(2003). Considering the fact that the result of the study by Ly et al.(2005) was ‘Because it’s not tasty’, it appears that efforts to raise satisfaction level were not carried out (Han et al., 2004), although it can be said that ‘Taste’ is a big factor affecting satisfaction level.
In demographic characteristics, significant differences showed in gender and area. In the gender, both male and female stu- dents(66.5% and 67.8%) responded that ‘Taste’ is by far the most important factor in deciding meal satisfaction levels(p<0.01). It showed that for male students, ‘Quantity’(13%), and for female students, ‘Hygiene and temperature’(14.9%) are important as well.
This was similar to the result of the study by Park et al.(2000) in that hygiene is more important for female students than for male
Table 3. The first factor affecting the satisfaction level of one's meal
students. To raise the level of meal satisfaction, much effort should be made to maintain good hygiene with good taste.
In the area, it showed that ‘Taste’ was the most important factor in deciding meal satisfaction level for all three groups: Seoul 62.2%, Gunpo 64.9%, and Changyeong 74.7%. Also, ‘Quantity’
was important for both Seoul(15.4%) and Gunpo(12.2%) and
‘Hygiene and temperature’ was important for Changyeong(16.7
%), which shows a significant difference(p<0.01).
First Eating Behavior after Having a Satisfying Meal
The results of ‘the first eating behavior after having a satisfying meal’ analysis was shown in Table 4. When looking at the results,
‘Eat dessert such as fruit’ was the most frequent response with 579 students(64.3%). The results paralleled with the results of the study done by Lee and Park, (2010) that students answered ‘Fruits’
as the most common menu. Also, it turned out to be worthy of that more students chose ‘Forget to think about eating’ 151(16.8%) than ‘Drink tea’ 85(9.4%).
The least number of people with 24(2.7%) selected ‘Skip the next meal,’ but there is a correlation with ‘Forget to think about Table 4. First eating behavior after having a satisfying meal
eating.’ The students were also non-responsive with 62(6.9%).
‘Others’ implicated ‘Fall into a mindless state’, ‘Feel good’, ‘Feel drowsy and fall asleep’, and ‘Anticipate the next meal.’
In the gender, more than 60% of both male and female students selected ‘Eat dessert such as fruit’ indicating female students more prefer. From other items that show a similar pattern, it was assumed that raising meal satisfaction level will lead to desirable eating behaviors, but the difference was statistically insignificant(p
<0.05). There were also no significant differences in the grade and area.
First Activity after(30 min~1 hr) a Satisfying Meal
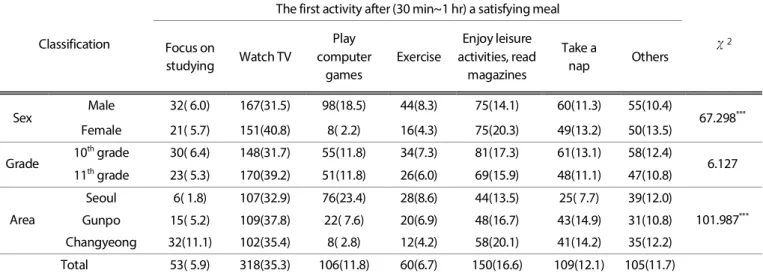
The results of ‘The first activity after(30 min~1 hr) a satisfying meal’ analysis were shown in Table 5. When reviewing the results,
‘Watch TV’ was the most frequent response with 318(35.3%), followed by ‘Enjoy leisure activities, read magazines’ 150(16.6%), followed by ‘Take a nap’ 109(12.1%), followed by ‘Play computer games’ 106(11.8%), followed by ‘Exercise’ 60(6.7%), and foll- owed by ‘Focus on studying’ 53(5.9%). From the result that the
‘Watching TV’ activity was the most common response by stu- Classification
The first factor affecting the satisfaction level of one's meal
χ2 Taste Quantity Hygiene and
temperature
Consideration of family during
mealtime
The person who
prepares foods Others
Sex Male 353(66.5) 69(13.0) 56(10.5) 22(4.1) 9(1.7) 22(4.1) 21.279**
(.001)
Female 251(67.8) 23( 6.2) 55(14.9) 8(2.2) 16(4.3) 17(4.6)
Grade 10th grade 322(69.0) 45( 9.6) 51(10.9) 16(3.4) 13(2.8) 20(4.3) 2.416
(.789)
11th grade 282(65.0) 47(10.8) 60(13.8) 14(3.2) 12(2.8) 19(4.4)
Area
Seoul 202(62.2) 50(15.4) 32( 9.8) 13(4.0) 12(3.7) 16(4.9)
47.111***
(.000)
Gunpo 187(64.9) 35(12.2) 31(10.8) 14(4.9) 7(2.4) 14(4.9)
Changyeong 215(74.7) 7( 2.4) 48(16.7) 3(1.0) 6(2.1) 9(3.1)
Total 604(67.0) 92(10.2) 111(12.3) 30(3.3) 25(2.8) 39(4.3)
** p<0.01, *** p<0.001.
Classification
The first eating behavior after having a satisfying meal
χ2 Drink tea Eat dessert
such as fruit
Skip the next meal
Forget to think
about eating Others
Sex Male 60(11.3) 329(62.0) 13(2.4) 93(17.5) 36(6.8)
6.522
Female 25( 6.8) 250(67.6) 11(3.0) 58(15.7) 26(7.0)
Grade 10th grade 41( 8.8) 299(64.0) 13(2.8) 83(17.8) 31(6.6)
1.179
11th grade 44(10.1) 280(64.5) 11(2.5) 68(15.7) 31(7.1)
Area
Seoul 36(11.1) 191(58.8) 16(4.9) 55(16.9) 27(8.3)
18.596*
Gunpo 30(10.4) 195(67.7) 4(1.4) 43(14.9) 16(5.6)
Changyeong 19( 6.6) 193(67.0) 4(1.4) 53(18.4) 19(6.6)
Total 85( 9.4) 579(64.3) 24(2.7) 151(16.8) 62(6.9)
* p<0.05.
Table 5. First activity after (30 min~1 hr) a satisfying meal
dents after a satisfying meal, it is suggestive of that appropriate nutrition education is needed to have them perform simple exer- cise routines or take a rest after a meal. Accordingly, those activities help them digest food and hence improve health.
In the stress rating scale developed by Byeon (1995) and Lee (1988), such four categories as school, home, interpersonal rela- tionship, and egosphere were classified as the origins of stress among adolescents. However, in this study because ‘Focus on studying’ was selected by the least number of students, it appears to be that the level of meal satisfaction does not have a great influence on relieving the academic-related stress.
For male students, ‘Watch TV’(31.5%) was the most frequent response, followed by ‘Play computer games’(18.5%), followed by
‘Enjoy leisure activities, read magazines’(14.1%), followed by ‘Take a nap’(11.3%), followed by ‘Exercise’(8.3%), and followed by
‘Focus on studying’(6%). For girl students, ‘Watch TV’(40.8%) was the most common response, followed by ‘Enjoy leisure activities, read magazines’(20.3%), followed by ‘Take a nap’(13.2%), fo- llowed by ‘Focus on studying’(5.7%), and followed by ‘Exercise’
(4.3%). Both male and female students preferred ‘Watch TV’ over other activities, but female students favor it more. This result concurred with the result of Na(2003). In case of the ‘Play computer games,' male students preferred this activity far more over female students. Only 2.2% of female students favored this activity. This result paralleled with the result of the study by Kim and Min(2008). Also, female students favored the ‘Enjoy leisure activities, read magazine’ activity more than male students.
Overall, the results showed that there are significant differences between male and female students(p <.001). As an implication, a future study on the correlation between the level of meal satisfaction and after-meal activities of male and female students is needed.
While the result from grade did not show a significant difference, the analysis from area showed a significant difference(p<.001).
Students from Seoul area favored ‘Watch TV’ and ‘Play computer games’ activities, whereas did students from Gunpo, Changyeong areas the ‘Watch TV’ and ‘Enjoy leisure activities, read magazines’
activities.
Reasons for Low Meal Satisfaction Levels
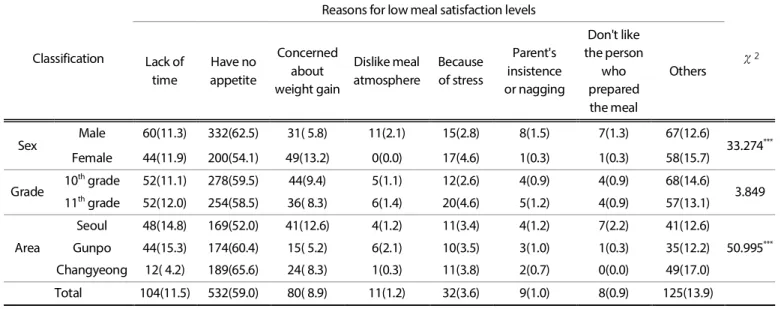
The results from the ‘Reasons for low meal satisfaction levels’
were shown in Table 6. ‘Have no appetite’ was the most frequent response with 532(59.0%). This was a much more frequent response than ‘Lack of time’ 104(11.5%) to anticipate the most frequent response. It appeared to be that the students are ex- pressing the reality of our education system because the amounts of their sleep and rest are absolutely insufficient, especially when compared to the amount of studying they are required to do through their physical needs: ‘Have no appetite.’ This result leads to another eating behavior issue, skipping meals. Skipping meals leads to overeating which causes a vicious life cycle. Also, it reported that sleep deprivation gives rise to cardiovascular di- seases such as obesity-related high-blood condition, diabetes, and the like(Ayas et al., 2003; Taheri et al., 2004; Yaggi et al., 2006). This is because sleep deprivation increases the level of leptin, appetite- regulating hormones, leading to hormone imbalance which in- duces overeating and hence energy imbalance and weight gain (Knutson & Van, 2008). This implies that adjusting the minimum amount of sleep required for efficient learning must be consi- derably reflected to a school life for students.
Of all students, 80 students(8.9%) were concerned about their weight gain. This is partly due to obesity awareness problems, but other disorders such as mental stress, depression(Cho et al., 2001;
Kim et al., 2001), physical changes and self-esteem reduction, and concerns over changes in relationships with friends(Pratt, 1994) play a substantial role as well.
In the gender, significant differences were identified(p<.001).
While for male students, they selected ‘No appetite’ or ‘Lack of time,’ for female students, they chose ‘Have no appetite’ or ‘Con- cerned about weight gain.’ It implicated that female students were more concerned about weight gain.
As shown in a study on high school students body shapes by Ryu and Yoon(1998), students prefer somewhat slimmer body shapes over their present weights as ideal physical shapes.
Especially, for female students, wrong perception that places Classification
The first activity after (30 min~1 hr) a satisfying meal
χ2 Focus on
studying Watch TV
Play computer
games
Exercise
Enjoy leisure activities, read
magazines
Take a
nap Others
Sex Male 32( 6.0) 167(31.5) 98(18.5) 44(8.3) 75(14.1) 60(11.3) 55(10.4)
67.298***
Female 21( 5.7) 151(40.8) 8( 2.2) 16(4.3) 75(20.3) 49(13.2) 50(13.5) Grade 10th grade 30( 6.4) 148(31.7) 55(11.8) 34(7.3) 81(17.3) 61(13.1) 58(12.4)
6.127 11th grade 23( 5.3) 170(39.2) 51(11.8) 26(6.0) 69(15.9) 48(11.1) 47(10.8)
Area
Seoul 6( 1.8) 107(32.9) 76(23.4) 28(8.6) 44(13.5) 25( 7.7) 39(12.0)
101.987***
Gunpo 15( 5.2) 109(37.8) 22( 7.6) 20(6.9) 48(16.7) 43(14.9) 31(10.8) Changyeong 32(11.1) 102(35.4) 8( 2.8) 12(4.2) 58(20.1) 41(14.2) 35(12.2) Total 53( 5.9) 318(35.3) 106(11.8) 60(6.7) 150(16.6) 109(12.1) 105(11.7)
*** p<0.001.
Table 6. Reasons for low meal satisfaction levels
heavy emphasis on slim bodies leads to an unbalanced diet(Rozin
& Fallon, 1988). This is why nutrition education that can correct the wrong perception is required. Therefore, these matters that can cause inappropriate eating behaviors should be thoroughly investigated to address the issues concerning how to raise the appetite of high school students and the amounts of sleep and rest.
Finally, the time allocated for nutrition education should be appropriately divided.
In the grade, no differences were found. In the area, the students from Seoul and Gunpo areas answered ‘Have no appetite’ or
‘Lack of time’ as the most significant reason for the low level of meal satisfaction, and the students from Changyeong area res- ponded ‘Have no appetite’ or ‘Concerned about weight gain.’ It showed that the level of meal satisfaction could change from one area to another(p<.001).
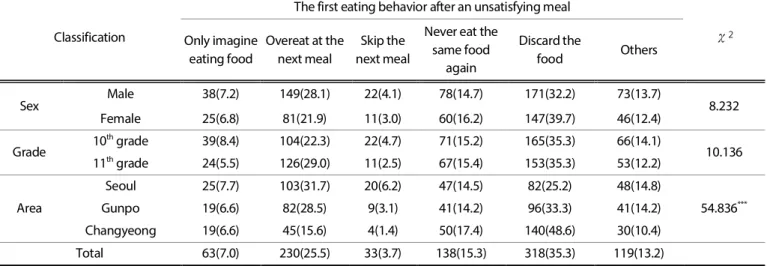
First Eating Behavior after an Unsatisfying Meal
The results of ‘The first eating behavior after an unsatisfying meal’ were shown in Table 7. ‘Discard the food’ was the most frequent response with 318(35.3%). This implied that when adolescents are not satisfied with meals, they could be provoked into conducting other undesirable eating behaviors. The second most common response was ‘Overeat at the next meal’ with 230(25.7%). It is also known that meal dissatisfaction can possibly cause obesity, which is linked to a potential risk factor(Lee & Hyun, 2001). Also, the next most frequent response was ‘Never eat the same food again’ with 138(15.3%). This experience remains a bad memory and sets in an undesirable eating behaviour. Such ex- perience makes one avoid certain foods despite the fact they are essential for good health and leads to an ill-balanced diet habit. It is necessary to develop menu programs addressing this issue. The rest responses such as ‘Only imagine eating food’ 63(7.0%) and
‘Skip the next meal’ 33(3.7%) are all related to obesity.
In the gender, the results from male and female students showed similar patterns each other. While ‘Discard the food’ was more favored by female students, ‘Overeat at the next meal’ was
more frequently selected by male students. However, the di- fference was insignificant between the two groups(p<.001). It implied that there are correlations among leftover and overeating and the level of meal satisfaction.
In the grade, no significant differences are found. However, whereas in the area, the students from Seoul area responded
‘Overeat at the next meal,' the student from Gunpo, Changyeong areas replied ’Discard the food’ as the first eating behavior after an unsatisfying meal. It showed that eating behavior could sig- nificantly change from one area to another (p<.001).
Effects an Unsatisfying Meal has on Studying
The results of the ‘Effects an unsatisfying meal has on studying’
analysis were shown in Table 8. ‘Indifferent’ was the most fre- quent response with 551(61.2%), indicating that unsatisfying meal does not affect students with studying. But, when the response
‘Can’t remember things and learning efficiency drops’ with 110(12.2%) was analyzed more closely, it could be seen that unsatisfying meals can be an origin of stress among high school students. This concurred with a study (Kim KH, 1999) on corre- lations between stress and nutrition intake. ‘Experience a hea- dache and stressed’ was the next most frequent answer with 60 (6.7%), followed by ‘Feels lighter and not affected’ 58 (6.4%), and followed by ‘Insecure and irritated’ 13(1.4%). It appeared to be that, as demonstrated in a related studies on eating behaviors (Lee, 1988; Lee et al., 2010; Yi et al., 2006), appropriate eating behaviors have positive influence on learning. Therefore, sustaining the high level of meal satisfaction, while appropriate eating behaviors are being formed, will significantly help high school students reduce high academic stress.
In the gender, both male and female students chose ‘Indi- fferent,’ and no significant differences were found(p<.01). The most frequent response for male students was ‘Indifferent’(60.1%), followed by ‘Can’t remember things and learning efficiency drops’
(13.4%), and followed by ‘Feels lighter and not affected’(7.2%). On the other hand, the most frequent response for female students Classification
Reasons for low meal satisfaction levels
χ2 Lack of
time
Have no appetite
Concerned about weight gain
Dislike meal atmosphere
Because of stress
Parent's insistence or nagging
Don't like the person
who prepared the meal
Others
Sex Male 60(11.3) 332(62.5) 31( 5.8) 11(2.1) 15(2.8) 8(1.5) 7(1.3) 67(12.6)
33.274***
Female 44(11.9) 200(54.1) 49(13.2) 0(0.0) 17(4.6) 1(0.3) 1(0.3) 58(15.7) Grade 10th grade 52(11.1) 278(59.5) 44(9.4) 5(1.1) 12(2.6) 4(0.9) 4(0.9) 68(14.6)
3.849 11th grade 52(12.0) 254(58.5) 36( 8.3) 6(1.4) 20(4.6) 5(1.2) 4(0.9) 57(13.1)
Area
Seoul 48(14.8) 169(52.0) 41(12.6) 4(1.2) 11(3.4) 4(1.2) 7(2.2) 41(12.6)
50.995***
Gunpo 44(15.3) 174(60.4) 15( 5.2) 6(2.1) 10(3.5) 3(1.0) 1(0.3) 35(12.2) Changyeong 12( 4.2) 189(65.6) 24( 8.3) 1(0.3) 11(3.8) 2(0.7) 0(0.0) 49(17.0) Total 104(11.5) 532(59.0) 80( 8.9) 11(1.2) 32(3.6) 9(1.0) 8(0.9) 125(13.9)
** p<.01, *** p<.001.
Table 7. First eating behavior after an unsatisfying meal
Table 8. Effects an unsatisfying meal has on studying
was ‘Indifferent’(62.7%), followed by ‘Can’t remember things and learning efficiency drops’(10.5%), and followed by ‘Feels lighter and not affected’(7.6%). It concluded that female students were more affected by unsatisfying meals than male students. This result was similar with the results of a study by Han and Cho(1998).
In the grade, no differences were found. The most frequent response for 10th graders was ‘Indifferent,’ followed by ‘Can’t re- member things and learning efficiency drops,’ followed by ‘Expe- rience a headache and stressed,’ and followed by ‘Feels lighter and not affected.’ On the other hand, the most frequent response for 11th graders was ‘Indifferent,’ followed by ‘Can’t remember things and learning efficiency drops,’ followed by ‘Feels lighter and not affected,’ and followed by ‘Experience a headache and stressed.’ There were statistical differences(p<.01).
Usual Activity after an Unsatisfying Meal
The results of the ‘Usual activity after an unsatisfying meal’
analysis were shown in Table 9. ‘Take a nap’ was the most fre-
quent response with 201(22.3%), followed by ‘Watch TV’ with 189(21.0%), followed by ‘Play computer games’ with 126(14.0%), followed by ‘Focus on studying’ with 72(8.0%), followed by ‘Get together with friends and chat’ with 69 (7.7%), and followed by
‘Exercise' with 56(6.2%). It showed that when students are not satisfied with their meals, they mostly tend to ’take a nap’, ‘watch TV’, and ‘play computer games.’ This is very similar to the results of the first activity after(30 min-hr) a satisfying meal analysis(Table 5).
In the gender, while male students’ preferences were ‘Play computer games’ and ‘Take a nap,’ female students’ preferen- ces were ‘Take a nap’ and ‘Watch TV.’ This results were very similar to the results of the first activity after(30min~hr) a satisfying meal analysis at p<.001. The grade analysis did not show any significant differences. However, in the area analysis, ‘Exercise’,
‘Watch TV’, and “Take a nap’ were the most frequent responses for Seoul, Gunpo and Changyeong area, showing significant di- fferences(p<.001).
Classification
The first eating behavior after an unsatisfying meal
χ2 Only imagine
eating food
Overeat at the next meal
Skip the next meal
Never eat the same food
again
Discard the
food Others
Sex Male 38(7.2) 149(28.1) 22(4.1) 78(14.7) 171(32.2) 73(13.7)
8.232
Female 25(6.8) 81(21.9) 11(3.0) 60(16.2) 147(39.7) 46(12.4)
Grade 10th grade 39(8.4) 104(22.3) 22(4.7) 71(15.2) 165(35.3) 66(14.1)
10.136 11th grade 24(5.5) 126(29.0) 11(2.5) 67(15.4) 153(35.3) 53(12.2)
Area
Seoul 25(7.7) 103(31.7) 20(6.2) 47(14.5) 82(25.2) 48(14.8)
54.836***
Gunpo 19(6.6) 82(28.5) 9(3.1) 41(14.2) 96(33.3) 41(14.2)
Changyeong 19(6.6) 45(15.6) 4(1.4) 50(17.4) 140(48.6) 30(10.4)
Total 63(7.0) 230(25.5) 33(3.7) 138(15.3) 318(35.3) 119(13.2)
*** p<0.001.
Classification
Effects an unsatisfying meal has on studying
χ2 Feels lighter
and not affected
Indifferent
Can't remember things and
learning efficiency drops
Insecure and irritated
Experience a headache and stressed
Others
Sex Male 38(7.2) 319(60.1) 71(13.4) 7(1.3) 32(6.0) 64(12.1)
3.635
Female 20(5.4) 232(62.7) 39(10.5) 6(1.6) 28(7.6) 45(12.2)
Grade 10th grade 26(5.6) 282(60.4) 55(11.8) 7(1.5) 35(7.5) 62(13.3)
3.531
11th grade 32(7.4) 269(62.0) 55(12.7) 6(1.4) 25(5.8) 47(10.8)
Area
Seoul 18(5.5) 183(56.3) 35(10.8) 3(0.9) 27(8.3) 59(18.2)
25.449**
Gunpo 19(6.6) 182(63.2) 35(12.2) 5(1.7) 15(5.2) 32(11.1)
Changyeong 21(7.3) 186(64.6) 40(13.9) 5(1.7) 18(6.3) 18( 6.3)
Total 58(6.4) 551(61.2) 110(12.2) 13(1.4) 60(6.7) 109(12.1)
** p<0.01.
Table 9. Usual activity after an unsatisfying meal
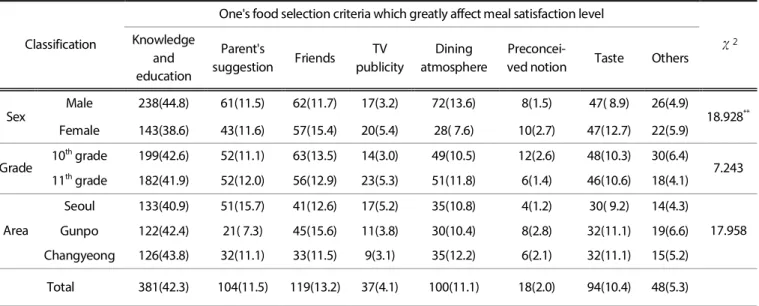
One's Food Selection Criteria Which Greatly Affect Meal Satisfaction Level
The results of the ‘One's food selection criteria which greatly affect meal satisfaction level’ analysis were shown in Table 10.
‘Knowledge and education’ was the most frequent response with 381(42.3%). This finding underpinned the Nutrition Education Theory that described that individuals with nutrition knowledge or who have been educated can practice and achieve the higher level of satisfaction levels(Lee et al., 2006). The ‘Knowledge’ was fo- llowed by ‘Friends’ with 119(13.2%), followed by with 'Taste' 115(12.8%), followed by ‘Parent's suggestion’ with 104(11.5%), followed by ‘Dining atmosphere’ with 100(11.1%), followed by
‘TV publicity ’ with 37(4.1%), and followed by ‘Preconceived no- tion about food’ with 18(2.0%). It showed that students’ foods selection is not based on ‘TV publicity’ or ‘Dining atmosphere,’
but based on ‘knowledge and education.’
The results of this analysis were similar to the results of studies
by Lee et al.(2006) and Backman et al.(2002). While in the study on high school students by Lee et al.(2006), ‘Friends’ was the most frequent response, in another study on factors affecting ado- lescents’ eating behaviors, ‘Mothers and friends’ was the most frequent response. The series of responses confirmed the fact that the dietary lifestyle attitudes are positive when importance of nutrition awareness is high, further substantiating the needs for active nutrition education.
In the gender, there are significant differences between male and female students(p<.01). Male students selected foods through
‘Knowledge and education’ and ‘Dining atmosphere,’ whereas female students selected through ‘Knowledge and education’
and ‘Friends.’ This result also confirmed the fact that the extent of knowledge can lead to dietary behaviors and was a further re- minder that high school students with limited nutrition knowledge can benefit from more dietary-lifestyle-related educational pro- grams.
Classification
Usual activity after an unsatisfying meal
χ2 Focus on
studying Watch TV
Play computer
games
Exercise
Enjoy leisure activities, read
magazines
Take
a nap Others
Sex Male 44( 8.3) 97(18.3) 25( 4.7) 114(21.5) 43(8.1) 107(20.2) 101(19.0)
83.338***
Female 28( 7.6) 92(24.9) 44(11.9) 12( 3.2) 13(3.5) 94(25.4) 87(23.5) Grade 10th grade 30( 6.4) 98(21.0) 35( 7.5) 69(14.8) 29(6.2) 109(23.3) 97(20.8)
3.914 11th grade 42( 9.7) 91(21.0) 34( 7.8) 57(13.1) 27(6.2) 92(21.2) 91(21.0)
Area
Seoul 14( 4.3) 58(17.8) 23( 7.1) 85(26.2) 24(7.4) 60(18.5) 61(18.8)
84.396***
Gunpo 26( 9.0) 66(22.9) 18( 6.3) 32(11.1) 21(7.3) 65(22.6) 60(20.8) Changyeong 32(11.1) 65(22.6) 28( 9.7) 9( 3.1) 11(3.8) 76(26.4) 67(23.3) Total 72( 8.0) 189(21.0) 69( 7.7) 126(14.0) 56(6.2) 201(22.3) 188(20.9)
*** p<0.001.
Table 10. One's food selection criteria which greatly affect meal satisfaction level
Classification
One's food selection criteria which greatly affect meal satisfaction level
χ2 Knowledge
and education
Parent's
suggestion Friends TV publicity
Dining atmosphere
Preconcei-
ved notion Taste Others
Sex Male 238(44.8) 61(11.5) 62(11.7) 17(3.2) 72(13.6) 8(1.5) 47( 8.9) 26(4.9)
18.928**
Female 143(38.6) 43(11.6) 57(15.4) 20(5.4) 28( 7.6) 10(2.7) 47(12.7) 22(5.9) Grade 10th grade 199(42.6) 52(11.1) 63(13.5) 14(3.0) 49(10.5) 12(2.6) 48(10.3) 30(6.4)
7.243 11th grade 182(41.9) 52(12.0) 56(12.9) 23(5.3) 51(11.8) 6(1.4) 46(10.6) 18(4.1)
Area
Seoul 133(40.9) 51(15.7) 41(12.6) 17(5.2) 35(10.8) 4(1.2) 30( 9.2) 14(4.3)
17.958 Gunpo 122(42.4) 21( 7.3) 45(15.6) 11(3.8) 30(10.4) 8(2.8) 32(11.1) 19(6.6)
Changyeong 126(43.8) 32(11.1) 33(11.5) 9(3.1) 35(12.2) 6(2.1) 32(11.1) 15(5.2) Total 381(42.3) 104(11.5) 119(13.2) 37(4.1) 100(11.1) 18(2.0) 94(10.4) 48(5.3)
** p<0.01.
CONCLUSIONS
Based on the findings, this study provides the following con- clusions and suggestions. First, as the same result from studies on the school meals, both male and female students selected ‘Tas- te’(67%) as the most important factor to affect the level of sa- tisfaction of home meals. Therefore, more diverse efforts according to taste should be made, and subsequently the level of meal satisfaction of high school students should be improved. For example, while it is difficult to immediately fix the school food service to suit individual eating habit, it is relatively easy to do it at home. As alternatives, changing the use of nutritionally-balanced ingredients and cooking methods and having students participate in the food preparation processes which will change their awa- reness of bad memories and rejections about particular foods should be attempted. These activities are expected to help achieve whole-nutrition intake.
Second, in the ‘Usual activity after an unsatisfying meal’ ana- lysis, ‘Take a nap’(22.3%) was the most frequent response. In the
‘First activity after (30 min~1 hr) a satisfying meal’ analysis, ‘Wat- ch TV’(35.3%) was the most common response, followed by ‘Enjoy leisure activities, read magazines’ (16.6%), and followed by ‘Take a nap’(12.1%). From these results, generally adolescents appear to be affected by their surrounding environments. The results also imply that adolescents seem to have insufficient sleep and deprived rest. While one recognize the importance of sufficient sleep and rest in an adolescent period that their bodies can go through transformation, other alternatives to replace are nearly absent.
Third, it confirmed that the level of home meal satisfaction aff- ects eating behaviors and learning. Therefore, students should be provided with realistic individual nutrition guidances through which they are informed of foods that can help reduce academic stress, give opportunities to experience new knowledge on a daily basis, and form healthy eating habits. In addition, various gui- delines for desirable eating behaviors should be implemented with an associated system of reward/penalty.
Forth, the most influential factor in the level of meal satisfaction was ‘Knowledge and education.’ The importance of balance diet, as a part of regular school curriculum, is more emphasized than ever. For students, the gained nutrition knowledge will provide a learning effect that will help them form healthy eating habit and maintain good health until their old age.
A few limitations of this study were left as in-depth assignments to be taken care in the future. For example, this study cannot compare the level of meal satisfaction of students of different academic performance and regions.
ACKNOWLEDGEMENT
This paper was prepared during my sabbatical year (2012) at Anyang University.
REFERENCES
An, D. H. (1996). Eating disorders in adolescents. Journal of Korea
Medical Association, 39(12), 1506-1513.
An, K. B., Yon, M. Y., Lee, Y. J., & Kim, W. J. (2009). Comparison of customer satisfaction by operation types of business food service in Chungbuk province. Korean Journal of Food Culture, 24(6), 721-727.
Adachi, Myk, Mo, S. M., Kwon, S. J., & Lee, K. S. (2000). Table of Children Do you know. Kyomun-Sa, Seoul.
Ayas, N. T., White, D. P., Manson, J. E., Stampfer, M. J., Speizer, F. E, Malhotra, A., & Hu, F. B. (2003). A prospective study of sleep duration and coronary heart disease in women. Archives of Internal Medicine, 163(2), 205-209.
Backman, D. R., Haddad, E. H., Lee, J. W., Johnston, P. K., & Hodg- kin, G. E. (2002). Psychological predictors of healthful dietary behavior in adolescents. Journal of Nutrition Education and Behavior, 34(4), 184-192.
Baek, S. K., Choi, K. S., Kim, B. H., Yoon, H. Y., Moo, S. M., Kim, I. S., Kang, S. G., & Kim, J. N. (1990). A study of ecological aspect of food and nutrition of elementary school children in remote village of Chungbuk province. Korean Journal of Dietary Culture, 5(2), 217-228.
Bae, Y. M., Son, D. H., & Ahn, H. S. (2011). Perceptions of trade- tional korean foods and satisfaction levels toward school food service among middle school students and parents of schools serving traditional Korean menus in Gyeonggi pro- vince. Journal of Korean Diet Association, 17(2), 118-129.
Birch, L. (1987). The role of experience in children's food acc- eptance patterns. J. Am. Diet. Assoc. (supp.9 ):536.
Byeon, Y. J. (1995). A study of the relations between parents' rearing attitude, irrational beliefs and stress of adolescents.
Master thesis, Yonsei University, Seoul.
Cason, K. L. (2006). Family mealtimes : More than just eating to- gether. Journal of the American Dietetic Association, 106(4), 532-533.
Cho, H. J., Choi, S. D., Lee, W. Y., Cho, D. Y., & Yoo, B. Y. (2001).
Association between body mass index and the BEPSI - K score of the adolescent in an urban area. Korean Journal of Family Medicine, 22(5), 698-708.
Choi, N. O. (2001). A reserch on the current status of children's eating behavior depending on the mother's employment sta- tus and the presence of other family members during meal- time. Masters thesis, Sookmyung Women's University, Seoul.
Compa, E., Moreno, J., Ruiz, M. T., & Pascual, E. (2002). Doing things together: Adolescent health and family rituals. Journal of Epidemiology & Community Health, 56(2), 89-94.
Chung, H. K., Kim, H. Y., & Lee, H. Y. (2011). The antecedents of coffee satisfaction by lifestyle segments for Korean and Chi- nese university students in Korea. Korean Journal of Commu- nity Nutrition, 16(6), 782-793.
Han, K. S., & Hong, S. H. (2002). A study of the operation of contract food service management and menu preference of middle school students in Seoul. Korean Journal of Community Nutrition, 7(4), 559-570.
Han, M. J., Yoon, Y. J., Kim, N. Y., & Yoo, Y. H. (2004). Satisfaction of meal and service quality in university foodservice institutions.
Korean Journal of Food and Cookery Science, 20(6), 545-552.
Han, M. J., & Cho, H. A. (1998). Dietary habit and perceived stress of college students in Seoul area. Korean Journal of Dietary