MOMENT METHOD/MONTE-CARLO SIMULATON OF RADAR BACKSCATTERING FROM OIL SPILLS ON SEA SURFACES
Seong-Min Park** *
1, Chan-Su Yang**
2, Yisok Oh*
3*Department of Electronics, Information and Communication Engineering, Hongik University, Seoul, Korea
**Korea Ocean Satellite Center
Ocean Satellite Remote Sensing & Observation Technology Research Department Korea Ocean Research & Development Institute, Ansan, Korea
E-mail : 1 [email protected] / [email protected]
ABSTRACT: This paper presents a numerical simulation of the radar backscattering from oil spills on ocean surfaces.
At first, a one-dimensionally rough sea surface is numerically generated by combining both a small-scale and a large- scale roughness. A two-layered medium is generated by adding a thin oil layer on the rough sea surface. The electric fields scattered from the oil spilled sea surface are computed by the Method of Moments. Then, the backscattering coefficients of various oil-layers are statistically obtained for N independent oil-spill surface samples using the Monte Carlo technique for various surface roughness, oil-layer thicknesses, frequencies, polarizations and incidence angles.
Numerical simulation results are compared with theoretical model and measurement data. The reduction of the backscattering coefficients due to oil-spills on sea surfaces has been analyzed, which may help to detect any oil spills on sea surfaces, and consequently, to classify SAR images.
KEY WORDS: Method of Moments, Oil spills, Monte Carlo technique.
1. INTRODUCTION
Oil spills on sea surfaces seriously affect the marine ecosystem. Remote Sensing of the oil spills are essential for monitoring the marine environment. The synthetic aperture radar (SAR) systems have been extensively used for detecting the oil spills on sea surfaces (Adamo et al, 2006; Bentz et al., 2007). The precise computation of the radar backscatter of the oil spill will be useful to detect the oil spills on ocean surface using the SAR images, and also to classify the SAR images. However, the precise estimation of the radar backscatter from the oil spills is a quite complicate problem, because the roughness of a randomly rough sea surface is very complicate and the characterization of the oil layer is also complicate (Cox and Munk, 1954; Ulaby et al., 1986).
This paper presents a precise numerical computation of the radar backscatter of various shapes of oil spills on ocean surfaces. At first, the randomly rough dielectric surface with two-scale roughness is generated based on the wins speed on the ocean surface. A two layered medium is generated by adding a thin oil layer on the rough sea surface (Morchin, 1993; Oh, 1996b). Then, the electric fields scattered from the oil spilled ocean surface are computed by the Method of Moments (Oh, 1998).
The backscattering coefficients of the oil-spilled ocean surfaces are computed by the Monte Carlo technique for various surface roughnesses, oil-layer thicknesses, radar frequencies, radar polarizations and incidence angles.
Numerical simulation results are compared with theoretical models and measurement data. The reduction
of the backscattering coefficients due to oil-spills on sea surfaces has been analyzed, which may help to detect any oil spill on sea surface, and consequently, to classify SAR images.
2. FORMULATION
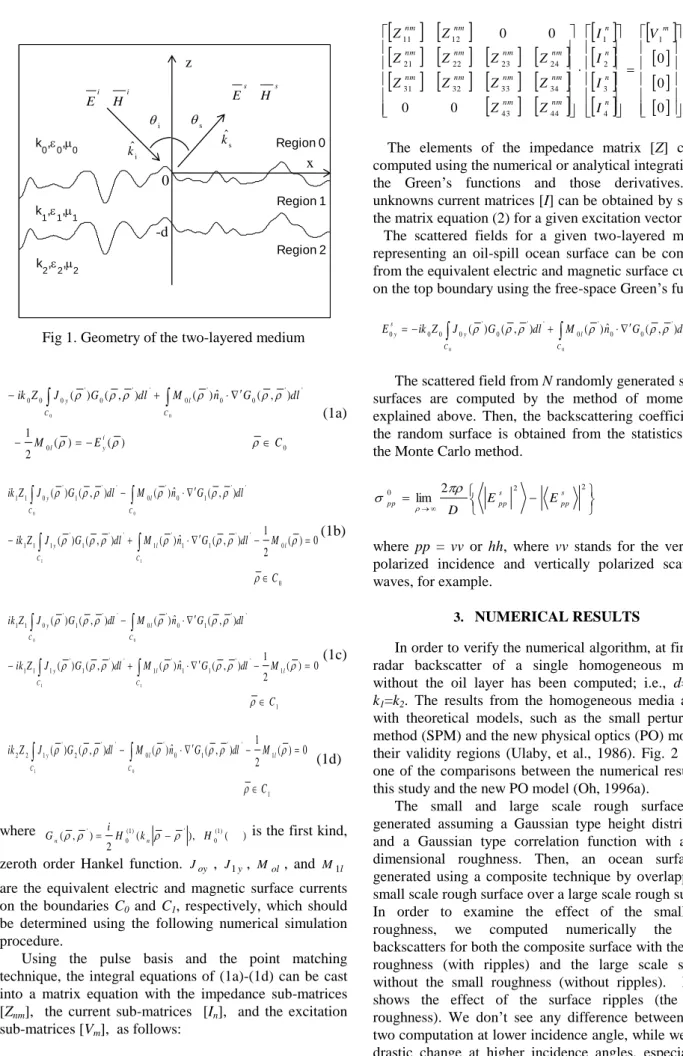
The roughness of ocean surface is usually considered by superposition of a large-scaled rough surface and a small-scaled rough surface (Ulaby at al., 1986). An oil- spilled ocean surface can be modeled by a two-layered medium with a top layer with a low dielectric constant (oil) and a bottom layer of the saline water. Fig. 1 shows the two-layered medium. Regions 0, 1, and 2 represent the air layer, oil layer, and saline water layer, respectively.
The constants k, ε, and μ denote the wave-number, permittivity, and permeability, respectively. The constants have the relations of k , 0r , 0r, where r is the dielectric constant with r0 1 , and
0
r r1 r2 1.
Using the wave equation and the boundary conditions, the electric field integral equation (EFIE) can be derived for computation of the scattered field as shown in (1a)- (1b) on the interface C0 between the air and oil layer, and (1c)-(1d) on the interface C1 between the oil and water layer.
Region 0
Region 1
Region 2 k0,
0,
0
k1,
1,
1
k2,
2,
2
z
i i
H E
s s
H E
i
kˆ s
kˆ
s
i
0
-d
x
Fig 1. Geometry of the two-layered medium
0 0
' ' 0 0 ' 0 ' ' 0 ' 0 0 0
) ( ) ( 2 1
) , ˆ (
) ( )
, ( ) (
0 0
C E
M
dl G n M dl G J Z ik
i y l
C l C
y
(1a)
0 0 ' ' 1 1 ' 1 ' ' 1 ' 1 1 1
' ' 1 0 ' 0 ' ' 1 ' 0 1 1
0 ) ( 2 ) 1 , ˆ ( ) ( ) , ( ) (
) , ˆ ( ) ( ) , ( ) (
1 1
0 0
C M dl G n M dl G J Z ik
dl G n M dl G J Z ik
l C
l C
y
C l C
y
(1b)
1 1 ' ' 1 1 ' 1 ' ' 1 ' 1 1 1
' ' 1 0 ' 0 ' ' 1 ' 0 1 1
0 ) ( 2 ) 1 , ˆ ( ) ( ) , ( ) (
) , ˆ ( ) ( ) , ( ) (
1 1
0 0
C M dl G n M dl G J Z ik
dl G n M dl G J Z ik
l C
l C
y
C l C
y
(1c)
1 1 ' ' 1 0 ' 0 ' ' 2 ' 1 2 2
0 ) ( 2 ) 1 , ˆ ( ) ( ) , ( ) (
0 1
C M dl G n M dl G J Z
ik l
C l C
y
(1d)
where ( ), ( )
2 ) ,
( ' iH0(1) k ' H0(1)
Gn n is the first kind, zeroth order Hankel function. Joy , J1y, Mol, and M1l are the equivalent electric and magnetic surface currents on the boundaries C0 and C1, respectively, which should be determined using the following numerical simulation procedure.
Using the pulse basis and the point matching technique, the integral equations of (1a)-(1d) can be cast into a matrix equation with the impedance sub-matrices [Znm], the current sub-matrices [In], and the excitation sub-matrices [Vm], as follows:
0 0 0
0 0
0
0 1
4 3 2 1
44 43
34 33 32 31
24 23 22 21
12 11
m
n n n n
nm nm
nm nm nm nm
nm nm nm nm
nm
nm V
I I I I
Z Z
Z Z Z Z
Z Z Z Z
Z Z
(2)
The elements of the impedance matrix [Z] can be computed using the numerical or analytical integrations of the Green’s functions and those derivatives. The unknowns current matrices [I] can be obtained by solving the matrix equation (2) for a given excitation vector [V].
The scattered fields for a given two-layered medium representing an oil-spill ocean surface can be computed from the equivalent electric and magnetic surface currents on the top boundary using the free-space Green’s function.
' ' 0 0 ' 0 ' ' 0 ' 0 0 0 0
0 0
) , ˆ (
) ( )
, ( )
( G dl M n G dl
J Z ik E
C l C
y s
y
(3)The scattered field from N randomly generated sample surfaces are computed by the method of moments as explained above. Then, the backscattering coefficient of the random surface is obtained from the statistics using the Monte Carlo method.
2 2
0 2
lim pps spp
pp E E
D
(4)
where pp = vv or hh, where vv stands for the vertically polarized incidence and vertically polarized scattering waves, for example.
3. NUMERICAL RESULTS
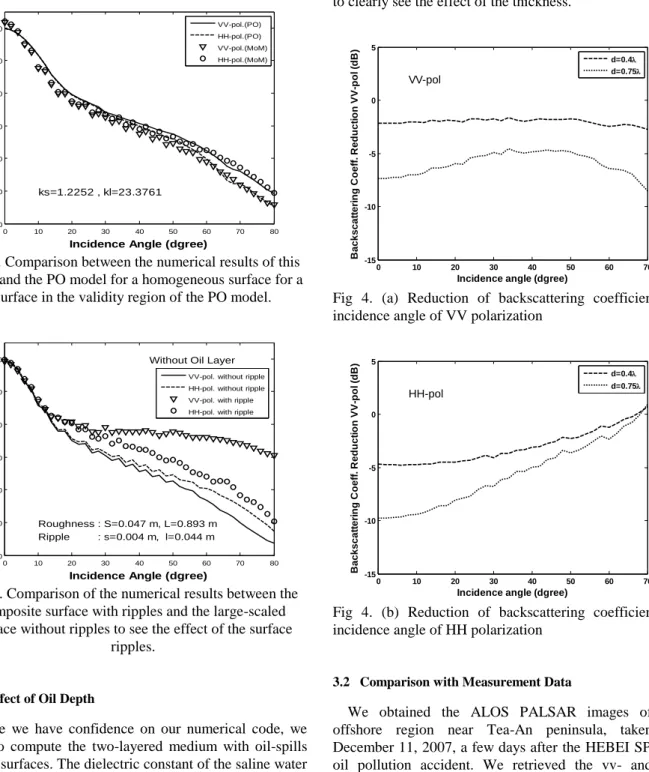
In order to verify the numerical algorithm, at first, the radar backscatter of a single homogeneous medium without the oil layer has been computed; i.e., d=0, or k1=k2. The results from the homogeneous media agreed with theoretical models, such as the small perturbation method (SPM) and the new physical optics (PO) model in their validity regions (Ulaby, et al., 1986). Fig. 2 shows one of the comparisons between the numerical results of this study and the new PO model (Oh, 1996a).
The small and large scale rough surfaces are generated assuming a Gaussian type height distribution and a Gaussian type correlation function with a one- dimensional roughness. Then, an ocean surface is generated using a composite technique by overlapping a small scale rough surface over a large scale rough surface.
In order to examine the effect of the small-scale roughness, we computed numerically the radar backscatters for both the composite surface with the small roughness (with ripples) and the large scale surface without the small roughness (without ripples). Fig. 3 shows the effect of the surface ripples (the small roughness). We don’t see any difference between these two computation at lower incidence angle, while we see a drastic change at higher incidence angles, especially at
vv-polarization, as shown in Fig. 3. This trend agrees with the SPM model; i.e., the vv-polarized radar backscatter is much higher than the hh-polarized case for small perturbed surfaces at higher incidence angles.
0 10 20 30 40 50 60 70 80
-50 -40 -30 -20 -10 0 10
Incidence Angle (dgree)
Backscattering Coeff. (dB)
ks=1.2252 , kl=23.3761
VV-pol.(PO) HH-pol.(PO) VV-pol.(MoM) HH-pol.(MoM)
Fig 2. Comparison between the numerical results of this study and the PO model for a homogeneous surface for a
surface in the validity region of the PO model.
0 10 20 30 40 50 60 70 80
-50 -40 -30 -20 -10 0 10
Incidence Angle (dgree)
Backscattering Coeff. (dB)
Without Oil Layer
Roughness : S=0.047 m, L=0.893 m Ripple : s=0.004 m, l=0.044 m
VV-pol. without ripple HH-pol. without ripple VV-pol. with ripple HH-pol. with ripple
Fig 3. Comparison of the numerical results between the composite surface with ripples and the large-scaled surface without ripples to see the effect of the surface
ripples.
3.1 Effect of Oil Depth
Once we have confidence on our numerical code, we tried to compute the two-layered medium with oil-spills on sea surfaces. The dielectric constant of the saline water has been obtained using the formulae in (Ulaby, et al., 1986). The dielectric constants of various oils are not available for us yet. Therefore, we used the dielectric constant of r1=2.39 - 0.29i, which was measured for a kerosene oil at 1.25GHz by using a ring resonator type dielectric probe (Sarabandi and Li, 1997). For a different oil type, we can substitute the dielectric constant for the numerical computation. Fig. 4 shows the effect of the oil depth. The reduction of backscattering coefficient by oil
spill on sea surfaces for VV-polarization is almost independent on the incidence angles. However, the reduction for HH-polarization reduces as the incidence angle increases. We should note that we assumed very thick oil layers (probably much thicker than real situation) to clearly see the effect of the thickness.
0 10 20 30 40 50 60 70
-15 -10 -5 0 5
Incidence angle (dgree)
Backscattering Coeff. Reduction VV-pol (dB)
VV-pol
d=0.4 d=0.75
Fig 4. (a) Reduction of backscattering coefficient by incidence angle of VV polarization
0 10 20 30 40 50 60 70
-15 -10 -5 0 5
Incidence angle (dgree)
Backscattering Coeff. Reduction VV-pol (dB)
HH-pol
d=0.4 d=0.75
Fig 4. (b) Reduction of backscattering coefficient by incidence angle of HH polarization
3.2 Comparison with Measurement Data
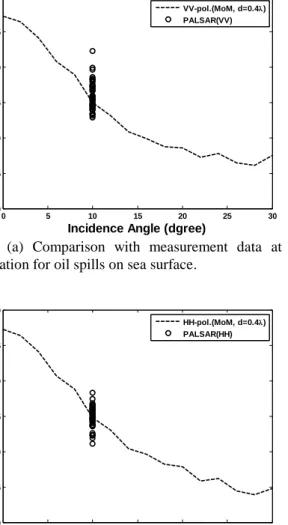
We obtained the ALOS PALSAR images of the offshore region near Tea-An peninsula, taken on December 11, 2007, a few days after the HEBEI SPIRIT oil pollution accident. We retrieved the vv- and hh- polarized radar backscattering coefficients of the oil- spilled ocean surfaces from the SAR images. The root- mean square (RMS) height and the correlation length of the ocean surface are calculated from the wind speed at that time. Fig. 5 (a) and (b) show that numerical simulation results compare with measurement data. Even though the measurement data were obtained only at a single incidence angle, we can see that the numerical simulation results agree quite well with the measurement data in an average sense. Some measurement data show a
high deviation, because the roughness is changing continuously by wind speed and wind direction, while a fixed wind speed has been used for this simulation.
0 5 10 15 20 25 30
-20 -15 -10 -5 0 5 10
Incidence Angle (dgree)
Backscattering Coeff. (dB)
VV-pol.(MoM, d=0.4) PALSAR(VV)
Fig 5. (a) Comparison with measurement data at vv polarization for oil spills on sea surface.
0 5 10 15 20 25 30
-20 -15 -10 -5 0 5 10
Incidence Angle (dgree)
Backscattering Coeff. (dB)
HH-pol.(MoM, d=0.4) PALSAR(HH)
Fig 5. (b) Comparison with measurement data at hh polarization for oil spills on sea surface
4. CONCLUSIONS
In this study, a numerical simulation of radar backscattering from oil spills on sea surface was performed using the Method of Moments and Monte Carlo method. The reduction of the backscattering coefficients due to oil-spills on sea surfaces has been analyzed. It was found that the reduction increase as the depth of oil spill increases. The numerical results were compared with measurement data of the ALOS PALSAR.
It was found that the numerical computation agreed well with the SAR measurements. It will help to detect oil spills on sea surfaces, and also help to classify SAR images.
Acknowledgements
This research is funded by Korea Research Council of Fundamental Science & Technology (PG47271) and
Korea Ocean Research & Development Institute (PE98333).
REFERENCES
M. Adamo, G. De Carolis, V. De Pasquale, G.
Pasquariello, 2006. Oil Spill Surveillance and Tracking with Combined use of SAR and Modis Imagery: A Case Study, IEEE Intern. Geoscience and Remote Sensing Symp. (IGARSS) 2006, Digest, pp. 1327 - 1330.
C. M. Bentz, A. T. Politano, and N. F. F. Ebecken, 2007.
Automatic Recognition of Coastal and Oceanic Environmental Events with Orbital Radars, IGARSS 2007, Digest, pp. 914 - 916.
C. Cox and W. Munk, 1954. Measurement of the Roughness of the Sea Surface from Photographs of the Sun’s Glitter, J. Opt. Soc. Am, Vol. 44, pp. 838-850.
W. Morchin, Radar Engineer’s Sourcebook, Artech House, 1993.
Y. Oh, 1996a. An Exact Evaluation of Kirchhoff Approximation For Backscattering From a One- dimensional Rough Surface, IEEE 1996 AP-S Digest., vol.
2, pp. 1522-1525.
Y. Oh, 1996b. Numerical study for wave scattering from randomly rough dielectric surfaces, 1996 Microwave Symposium, Digest, POSTECH, pp. 234-237.
Y. Oh, 1998. Numerical simulation of radar backscattering from oil spills on sea surfaces, IEEE Antennas and Propag., vol. 1, pp. 21-26.
K. Sarabandi and E. S. Li, 1997. Microstrip Ring Reasonator for Soil Moisture Measurements, IEEE Trans.
Geosci. Remote Sensing, vol. 35, pp. 1223-1231.
F.T. Ulaby, R. K. Moore and A. K. Fung 1986.
Microwave Remote Sensing Active and Passive, Artech House.
T. Wu and L. L. Tsai 1977. Electromagnetic fields induced inside arbitrary cylinders of biological tissues, IEEE Trans. Microwave Theory Tech., no. 1, pp. 61-65.