Estimation of Soil Moisture Content in Corn Field Using Microwave Scatterometer Data
Yihyun Kim, Sukyoung Hong*, Kyoungdo Lee, Sangil Na, and Gunho Jung
1Climate Change and Agroecology Division, National Academy of Agricultural Science, RDA, Suwon 441-707, Korea
1
Upland Crop Research Division, National Institute of Crop Science, RDA, Suwon 441-857, Korea
(Received: August 6 2014, Revised: August 8 2014, Accepted: August 24 2014)
A ground-based microwave scatterometer has an advantage for monitoring soil moisture content using multi-polarization, multi-frequencies and various incidence angles. In this paper, ground-based multi-frequency (L-, C-, and X-band) polarimetric scatterometer system capable of making observations every 10 min was used to monitor the soil moisture conditions in a corn field over an entire growth cycle. Measurements of volumetric soil moisture were obtained and their relationships to the backscatter observations were examined.
Time series of soil moisture content was not corresponding with backscattering coefficient pattern over the whole growth stage, although it increased until early July (Day Of Year, DOY 160). We examined the relationship between the backscattering coefficients from each band and soil moisture content of the field.
Backscattering coefficients for all bands were not correlated with soil moisture content when considered over the entire stage (r≤0.48). However, L-band Horizontal transmit and Horizontal receive polarization (HH) had a good correlation with soil moisture (r=0.85**) when LAI was lower than 2. Prediction equations for soil moisture were developed using the L-HH data. Relation between L-HH and soil moisture shows linear pattern and related with soil moisture content (R
2=0.77). Results from this study show that backscattering coefficients of microwave scatterometer appear to be effective to estimate soil moisture content in the field level.
Key words: Backscattering coefficients, Corn, Correlation coefficients, Microwave scatterometer, Soil moisture
Correlation analysis between backscattering coefficients and soil moisture content revealed that L-band HH polarization (L-HH) had a good correlation with soil moisture (r=0.85**) when a threshold of Leaf Area Index (LAI) < 2 was used in the analysis.
Growth stage L-band C-band X-band
HH VV HV HH VV HV HH VV HV
Entire period 0.48
ns0.45
ns0.44
ns0.39
ns0.36
ns0.36
ns0.34
ns0.31
ns0.31
nsLAI<2 0.85** 0.81** 0.80** 0.76** 0.78** 0.75** 0.72* 0.70* 0.68*
* and ** : Significant at the 0.05, 0.01 significance levels, respectively.
ns
: not significant at the 0.05 level.
1)
*Corresponding author : Phone: +82632382510, Fax: +82632383823, E-mail: [email protected]
§
Acknowledgement: This study was carried out with the support of “Research Program for Agricultural Science & Technology
Development (PJ00936701)”, National Academy of Agricultural Science, Rural Development Administration, Republic of Korea.
물 생육변화를 연속적으로 모니터링 할 수 있는 큰 장점을 가지고 있다 (Brisco et al., 1990; Inoue et al., 2002; Kim et al., 2009).
토양수분은 수문 및 환경모델링에 가장 주요한 인자로 가뭄, 홍수, 산사태, 산불 등 재해관리뿐 만 아니라 지하수, 지표수 등의 수자원 관리와 이용 등 많은 분야에서 활용되 고 있다. 마이크로파는 토양의 수분 함량에 따른 전기적 성 질과 표면 거칠기 (surface roughness)에 매우 민감하게 반 응한다. 따라서 마이크로파인 레이더자료를 통하여 토양의 수분함량을 추출하려는 노력이 오랫동안 있어왔다 (Schmugg, 1980; Jackson and Schmugg, 1989; Njoku et al., 2003;
Ryu et al., 2007).
마이크로파 토양표면에서 산란되는 전파의 크기는 토양 의 유전율의 증가에 따라 커지게 되고, 그 유전율은 다시 토 양의 수분함유량이 증가함에 따라 증가하는 관계를 갖는다 (Ulaby et al., 1982; Hallikainen et al., 1985).
레이더 시스템을 이용하여 토양수분을 관측 연구는 1970년 대부터 시작 되었으며 (Ulaby, 1974), 항공이나 위성 Synthetic Aperture Radar (SAR, 합성개구 레이더) 출현으로 원격으 로 토양 수분함유량을 탐지하는 연구가 활발히 수행되기 시 작하였다 (Schmugg, 1978; Jackson et al., 1981; Dobson and Ulaby, 1986, Jackson and O’Neill, 1986; Wang et al., 1989). Bindlish and Barros (2001)는 토양수분함량 실측값과 토양수분함량 추정 모형인 Integral Equation Model (IEM, 적분 방정식 모델)에서 얻어진 추정값 비교를 통해 적분 방정 식 모델 유효성을 검증하였다. Njoku et al. (2003)은 미국 애 리조나 사막지역을 대상으로 Advanced Microwave Scanning Radiometer (AMSR-E) 이용하여 영상으로부터 밝기온도 (brig- htness temperature)를 산출하고 지표면 거칠기를 제거한 토양수분추정 알고리즘을 개발하였다. Bartsch et al. (2007) 은 Vertical transmit and Vertical receive polarization (VV)- 편파모드의 ENVISAT ASAR 영상을 이용하여 지중해 여름 철 가뭄발생 지역에 대해 토양수분의 시간적 변화를 모니터 링 하고 토양수분지도를 작성하였다. Kim et al. (2012)은 지상관측시스템 (L, C, X-밴드)을 이용하여 후방산란계수 와 콩 연구지역 토양수분함량과의 관계를 분석하였는데 L- 밴드 안테나에서 토양수분함량과 상관계수가 가장 높게 나 타났다 (r=0.90**).
레이더 자료를 이용한 토양수분함량 관측과정에서 지표
C, X-밴드 안테나를 장착한 마이크로파 산란계를 이용하여 옥수수 생육기간 동안 산란계에서 얻어진 안테나별 후방산 란계수와 토양수분함량과의 관계를 분석하고 두 변수간 상 관성이 높은 후방산란계수를 이용하여 토양수분함량을 추 정하였다.
Materials and Methods
연구지역
농촌진흥청 국립식량과학원 시험포장 (Latitude 37.2597, Longitude 126.9757)에서 2013년 옥수수 (품종:광평옥) 생육기간 동안 마이크로파 산란계를 이용하여 토양 수분함량 변화를 모니터링 하였다. 시험포장의 면적은 20 m x 40 m,재식밀도 70 cm x 25 cm 이었고, 옥수수 파종일은 4월 4일 (Day Of Year, DOY 91), 수확일은 8월 28일 (DOY 240) 이었다.
토양수분함량 및 작물생육 조사
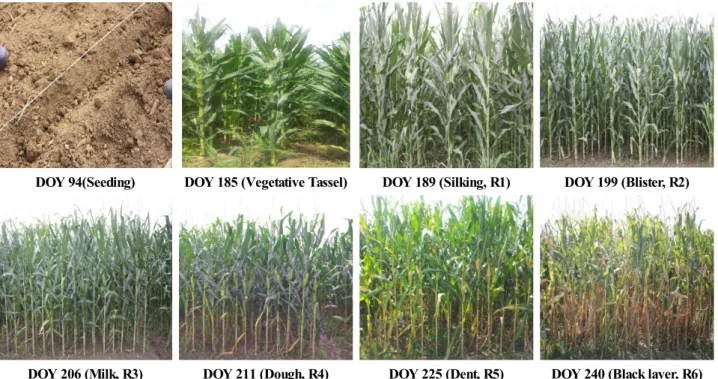
옥수수 생육단계는 영양생장기와 생식생장기로 크게 나눌 수 있는데 영양생장 기는 파종기 (Seeding, DOY 94) 부터 발아기 (Vegetative Emergence), 복엽기를 거쳐 출웅기 (Vegetative Tassel, DOY 185)까지이며, 생식생장기는 출사기 (Silking, R1, DOY 189), 유수형성기 (Blister, R2, DOY 199), 유숙기 (Milk, R3, DOY 206), 호숙기 (Dough, R4, DOY 211), 황숙기 (Dent, R5, DOY 225), 성숙기 (Black layer, R6, DOY 240)로 나뉜다 (Denmead and Shaw, 1960). 본 연구에서의 해당 옥수수 생 육단계는 Fig. 1과 같다.연구지역 2지점에서 토양수분센서 (Trime-Pico 64, IMKO GmbH, Etingen, Germany)를 표토 10 cm에 설치하여 옥수 수 생육기간 동안 10분 단위로 토양수분 함량변화를 측정하고, 일 평균 용적 수분함량을 계산하였다. 초장 (Plant height), 엽 면적지수 (Leaf area index), 생체중 (Fresh weight), 건물 중 (Dry weight), 식생수분함량 (Vegetation water content) 등 생육조사를 수확기까지 정기적으로 조사 (1회/주)하였다.
엽면적지수는 개엽을 모두 떼어내어 LI-3100 (LI-COR Inc, Lincoln, USA)을 이용하여 직접 면적을 측정한 후 재식밀도 로 나누어 구하였다. 연구지역 인근 수원기상대 (37°16′21.1 5″N, 126°59′07.52″E) Automatic Weather Station (AWS) 을 이용하여 일 단위 기상자료를 수집하였다. 수집 시기는 4월 1일 (DOY 91)부터 옥수수 수확기 (8월 28일, DOY 240)
DOY 94(Seeding) DOY 185 (Vegetative Tassel) DOY 189 (Silking, R1) DOY 199 (Blister, R2)
DOY 206 (Milk, R3) DOY 211 (Dough, R4) DOY 225 (Dent, R5) DOY 240 (Black layer, R6) Fig. 1. Field photos of corn in various growth stages.
Table 1. Specification of the L, C and X-band automatic scatterometer system.
Parameters L-Band C-Band X-band
Frequency (GHz) 1.27±0.06 5.3±0.3 9.65 ± 0.5
Antenna Gain (dB) 12.4 20.1 22.4
Antenna Type Dual polarimetric square horn Number of
Frequency points 201 801 1601
band Width (MHz) 120 600 1000
Wavelength (m) 0.23 0.056 0.031
Slant range
resolution (m) 1.23 0.25 0.15
Polarization HH
1), VV
2), HV
3)Incident angle (°) 40
Platform height (m) 4.16
Measurement time 1 per 10minutes 1) Horizontal transmit and Horizontal receive polarization 2) Vertical transmit and Vertical receive polarization 3) Horizontal transmit and Vertical receive polarization
까지 이었고 기상자료에는 풍향 (°), 풍속 (m s-1), 상대습도(%), 강수량 (mm), 온도 (℃)가 포함되어있다.
밴드별 후방산란계수와 토양수분 함량과의 상관분석 및 회귀분석은 SigmaPlot 프로그램 (SigmaPlot ver.10, Systat Software Inc., USA)을 이용하였다. 본 시험에 이용된 자료 에 대해서는 SAS Enterprise Guide 4.2을 이용하여 t-검정 (p=0.05)으로 밴드별 후방산란계수와 토양수분함량 간의 유의성을 분석하였다.
안테나별 후방산란계수 변화 관측
지상 마이크로파 산란계 L, C, X-밴드 안테나 자동관측시스템을 이용하여 옥수수 생육시기에 따른 토양수분 함량변화를 관측하였다.시스템은 강우, 바람 등 기후의 영향을 최소화하기 위해 측정 시스템 건물을 제작하였고 네트워크 분석기, General Purpose Interface Bus (GPIB)―USB, Radio Frequency (RF) cable, 레이더 주파수 변환장치 (Radio Frequency switch), 측정 프로그램이 내장된 노트북 컴퓨터는 건물 내부에 설치하였 다. 또한 L, C, X-밴드 안테나는 각 RF cable들과 연결되는 부분을 밀봉하여 건물 외부에 설치하였다.
Table 1은 마이크로파 산란계 자동관측시스템의 구성 항목 을 설명해주고 있다. 시스템 calibration을 위해 Calibration Kit (SMA, 85052D)을 이용하여 네트워크 분석기와 안테나 사이 cable 간의 내부 보정 (calibration)을 하였고, corner reflector를 이용하여 안테나로 들어오는 noise를 제거하였 다. 안테나는 dual-polarization square horn 안테나를 사 용하였고, 향후 레이더 영상에 적용하고 농업적으로 활용하 기 위해서 현재 운영되고 있는 레이더 위성 안테나들과 중
심 주파수를 동일하게 제작되었다 (Kim et al., 2011). 시스 템은 모든 편파에 대한 산란특성을 측정 할 수 있도록 하였 고, 레이더 주파수 변환장치 (Radio frequency switch)를 이 용하여 10분당 1회씩 자동으로 산란특성을 측정하도록 설계 함으로써 자료의 질을 향상 시켰다 (Kim et al., 2011). 안테 나별 후방산란계수는 레이더 방정식을 이용하여 산출하였 다 (Ulaby and Elachi, 1990).
Fig. 2. Temporal variation of soil moisture and precipitation during the corn growth period.
Fig. 3. Temporal variation of L-band backscattering coefficients and soil moisture content during the corn growth period.
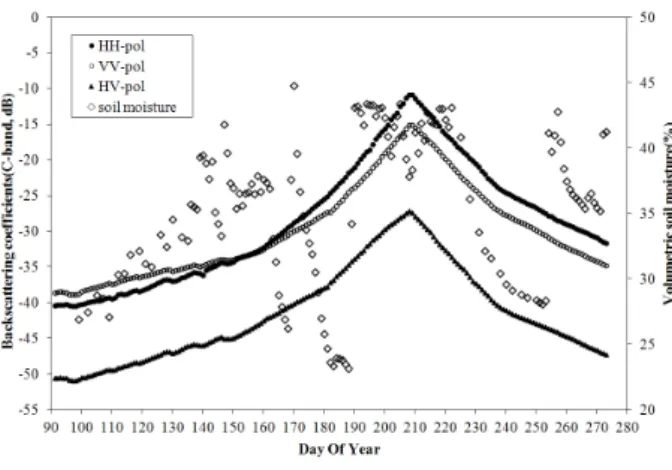
Fig. 4. Temporal variation of C-band backscattering coefficients and soil moisture content during the corn growth period.
Fig. 5. Temporal variation of X-band backscattering coefficients and soil moisture content during the corn growth period.
낮은 시기에서는 낮게 나타나 기상요소 중 강우량 변화와 관계가 높았다(Fig. 2). 전체 생육기간에서는 후방산란계수 와 토양수분 함량 간에 상관성이 나타나지 않았다. L, C, X-밴드 후방산란계수와 토양수분 함량 변화를 모니터링하 고 그 결과를 분석한 결과는 Fig. 3-5와 같다. 3개 안테나 중에서 L-밴드 후방산란계수 값이 가장 높게 나타났고, 그 다음이 C-밴드, X-밴드 순이었다. Fig. 3은 L-밴드 편파별 후방산란계수와 토양수분 함량 변화를 보여주고 있다. 모든 편 파에서 옥수수 생육초기에는 Vertical transmit and Vertical receive polarization (VV)-편파가 Horizontal transmit and Horizontal receive polarization (HH)-, Horizontal transmit
C-밴드 후방산란계수와 토양수분 함량 변화를 관측한 결 과는 Fig. 4와 같다. L-밴드 후방산란계수와 같이 생육초기 에는 VV-편파가 HH-편파보다 후방산란계수가 높게 나타 났지만, 6월 5일 (DOY 156)이후 HH-편파가 VV-편파보다 후방산란계수가 높게 나타나기 시작하였다. 전체 생육기간 의 자료를 이용했을 때는 편파별 후방산란계수와 토양수분 함량 간에 상관성이 나타나지 않았으며 L-밴드와 같이 6월 초순 (6월 10일, DOY 160)까지 두 변수 간에 변화가 비슷하 게 나타났다. X-밴드 편파별 후방산란계수와 토양수분 함 량 변화는 Fig. 5와 같다. L, C-밴드에 비해 상대적으로 고 주파에 의한 침투력 차이로 인해 편파별 후방산란계수가 낮 게 나타났다. L, C-밴드 후방산란계수 변화와 같이 생육초 기에는 VV-편파가 HH-편파보다 후방산란계수가 높게 나
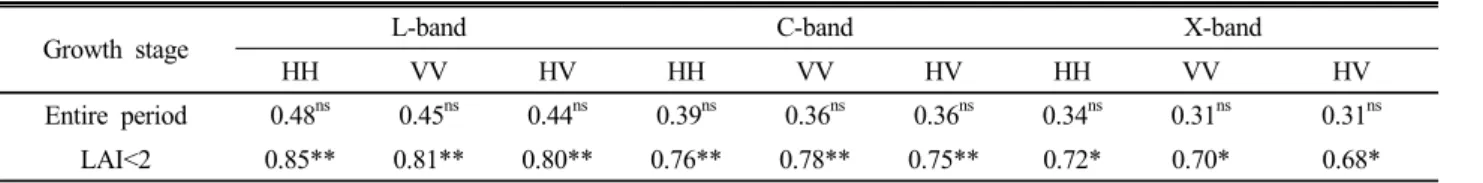
Table 2. Correlation coefficients between backscattering coefficients and soil moisture content.
Growth stage L-band C-band X-band
HH VV HV HH VV HV HH VV HV
Entire period 0.48
ns0.45
ns0.44
ns0.39
ns0.36
ns0.36
ns0.34
ns0.31
ns0.31
nsLAI<2 0.85** 0.81** 0.80** 0.76** 0.78** 0.75** 0.72* 0.70* 0.68*
* and ** Significant at the 0.05, 0.01 significance levels, respectively.
ns
not significant at the 0.05 level.
Table 3. Statistical performance of soil moisture content retrievals using regression equation extracted from backscattering coefficients of L, C, and X-bands. The maximum R-squared is highlighted in bold for soil moisture and radar channels.
y x Regression equation R
2soil moisture(%) L-band HH-polarization(dB) y = 1.0104x + 66.195 0.77**
soil moisture(%) L-band VV-polarization(dB) y = 1.3750x + 76.754 0.71**
soil moisture(%) L-band HV-polarization(dB) y = 1.3434x + 92.605 0.70**
soil moisture(%) C-band HH-polarization(dB) y = 1.2229x + 78.363 0.65*
soil moisture(%) C-band VV-polarization(dB) y = 1.8193x + 98.117 0.67*
soil moisture(%) C-band HV-polarization(dB) y = 1.3003x + 94.486 0.65*
soil moisture(%) X-band HH-polarization(dB) y = 1.2382x + 83.496 0.64*
soil moisture(%) X-band VV-polarization(dB) y = 1.7551x + 102.640 0.62*
soil moisture(%) X-band HV-polarization(dB) y = 1.4432x + 105.430 0.61*
타났고 DOY 156 이후부터 HH-편파가 VV-편파보다 후방 산란계수가 높았는데 이런 경향은 C-밴드와 동일하였다.
X-밴드에서 생육기간 중 HH-편파와 VV-편파 후방산란계 수 차이가 L, C-밴드에 비해 낮게 나타났다. 옥수수 전체 생육기간 동안 밴드별 후방산란계수와 토양수분 함량 간에 는 유사한 패턴을 보이지 않았지만 6월 초순까지는 (엽면적 지수 2이하 일 때) 두 변수간에 비슷한 변화 경향을 보였다.
즉 옥수수 생육기간 중 엽면적지수가 낮은 경우에는 후방산 란계수가 토양에 영향을 많이 받지만 엽면적지수가 높아질 수록 토양에 대한 영향은 감쇄된다. 밭작물에서는 군락이 형성되고 있는 시기 까지는 레이더 파가 토양 거칠기, 토양 수분함량에 영향을 많이 받지만 군락이 형성된 이후에는 토 양수분함량의 영향을 적게 받는다 (Jackson et al., 1982;
Fung, 1994; Wigneron et al., 1995; Owe et al., 2001; Prasad, 2009). 따라서 작물 군락형성의 지표인 엽면적지수를 이용 하여 밴드 및 편파별 후방산란계수와 토양수분함량과의 상 관성을 분석하였다.
밴드별 후방산란계수와 토양수분함량과의 상관성 분 석
옥수수 전체 생육기간 동안 밴드별 후방산란계수와 토양수분 함량과의 상관성을 분석한 결과는 Table 2와 같 다. L-밴드, C-밴드, X-밴드 순으로 상관계수가 높았고, L-밴드 HH-편파에서 상관계수가 가장 높았다. 하지만 모 든 밴드에 따른 편파별 후방산란계수가 토양수분함량과 상 관관계가 낮게 나타났다 (r≤0.48ns).옥수수 파종 (4월 4일, DOY 91) 이후 6월 초순 (6월 10일, DOY 160)까지 밴드별 후방산란계수와 토양수분함량이 증가 하는 경향이 비슷하게 나타났기 때문에 엽면적지수 2 이하 조건에서 밴드별 후방산란계수와 토양수분함량과의 상관성 을 분석하였다. 엽면적지수 2 이하 일 때 모든 밴드 및 편파 에서 토양수분함량과의 상관계수가 전체 생육단계에서 조 사한 것 보다 높게 나타났다. L-밴드 HH-편파가 상관계수 가 가장 높게 나타났고 (r=0.85**), L-밴드 다른 편파에서도 상관성이 나타났다 (r≥0.80**). C-밴드에서는 모든 편파에 서 상관계수가 비슷하게 나타났고 (r=0.78** - 0.75**), L- 밴드보다 토양수분함량과의 상관성이 낮았다. X-밴드의 경 우 HV-편파에서 토양수분함량과의 상관성이 가장 낮게 나 타났고 (r=0.68*), 다른 밴드에 비해 상관계수가 낮았다 (r
≤0.72*). HH-편파가 다른 편파들에 비해 토양수분함량과 의 상관성이 높게 나타났는데 작물 군락뿐 만 아니라 토양 에서도 다른 편파들에 비해 더 효율적으로 표면에 침투하는 것으로 판단된다.
후방산란계수를 이용한 토양수분함량 추정
밴드별 후방산란계수를 이용하여 토양수분 함량을 추정하였다. L- 밴드 HH-편파 후방산란계수를 이용하여 토양수분 함량을 추정한 결과 결정계수가 0.77로 높게 나타났다 (Table 3).또한 L-밴드 다른 편파 후방산란계수들에서도 토양수분 함 량과의 관계에서 결정계수가 0.70 이상 이었다. C-밴드 HH-편파 후방산란계수를 이용 토양수분 함량을 추정한 결
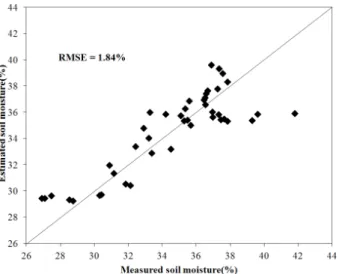
Fig. 6. Comparison between measured and estimated soil moisture using L-band HH polarization backscattering coefficients.
과 결정계수가 0.65 이었고, C-밴드 VV-편파 후방산란계수 를 이용 토양수분 함량을 추정한 결과 결정계수가 0.67로 L- 밴드에 비해 토양수분 함량 추정값이 낮게 나타났다 (Table 3). 또한 X-밴드 HH-편파 후방산란계수를 이용 토양수분 함량을 추정한 결과 결정계수가 0.64 이었고, VV-편파 후 방산란계수를 이용하여 토양수분 함량을 추정한 결과 결정 계수가 0.62로 나타났다. 토양수분 실측값과 L-밴드 HH- 편파 후방산란계수를 이용한 추정값을 비교한 결과 RMSE=
1.84%로 나타났다 (Fig. 6). 마이크로파 산란계 시스템에서 얻어진 밴드별 후방산란계수를 이용하여 토양수분 함량을 추정했을 때 L-밴드 > C-밴드 > X-밴드 순서로 추정값이 높게 나타났고, 추정 회귀식 형태는 linear 형태였다. L-밴 드 HH-편파 후방산란계수를 이용하는 것이 토양수분 함량 을 가장 높게 예측할 수 있었다. 하지만 본 연구는 포장단위 (field)에서 수행하였기 때문에 지역 및 광역단위에서 적용 하기에는 아직 한계가 있다. 따라서 현장지점 단위에서 지 역단위, 광역단위로 자료를 확장할 수 있는 알고리즘 개발 (field to regional-scale technique)을 포함하여 레이더 영 상에 연계 및 적용하려는 연구가 필요하다.
Conclusions
옥수수 생육기간 동안 지상 마이크로파 산란계 시스템 (L, C, X-밴드 안테나)에서 얻어진 편파별 후방산란계수와 토양수분 함량과의 상관관계를 분석하고 후방산란계수를 이용하여 토양수분 함량을 추정하고자 하였다. 편파별 후방 산란계수 변화에서 생육 초기에는 VV-편파가 HH, HV-편 파보다 후방산란계수가 높게 나타났지만 6월 초순 (6월 5 일, DOY 156)부터 HH-편파가 다른 편파들 보다 후방산란 계수가 높게 나타나 수확기까지 지속되었다.
계수가 낮았다 (r≤0.72*). 후방산란계수를 이용하여 토양 수분함량을 추정 한 결과 L-밴드 HH-편파 후방산란계수와 토양수분함량과의 관계에서 결정계수가 높게 나타났다 (R2= 0.77). 레이더 산란계 시스템에서 얻어진 후방산란계수를 이용하여 작물생육 초기단계 (엽면적지수 2이하)에서 토양 수분함량을 추정할 수 있음을 확인하였다.
References
Bartsch, A., C. Pathe, and W. Wagner. 2007. Relative soil moisture from C- and L-band SAR time series, The 1st Joint PI Symposium of ALOS Data Nodes for ALOS Science Program, Kyoto, Japan. 19-23 Nov. 2007.
Bindlish, R. and A.P. Barros. 2001. Parameterization of vegetation backscatter in radar-based soil moisture estimation. Remote Sens. Environ. 76:130-137.
Brisco. B., R.J. Brown., J.A. Koehler., G.J. Sofko, and M.J.
McKibben. 1990. The Diurnal Pattern of Microwave backscattering by wheat. Remote Sens. Environ. 34: 37-47.
Denmead, O.T. and R.H. Shaw. 1960. The effects of soil moisture stress at different stages of growth on the development and yield of corn. Agron. J. 52(5):272-274.
Dobson, M.C. and F.T. Ulaby. 1986. Active microwave soil moisture research. IEEE Trans. Geosci. Remote Sens. 24:23-36.
Fung, A.K. 1994. Microwave scattering and emission models and their applications. Artech House Inc., Norwood, MA, USA.
Hallikainen, T., F.T. Ulaby., M.C. Dobson., M.A. El-Rayes, and L. Wu. 1985. Microwave dielectric behavior of wet soil. Part-I:
Empirical models and experimental observation. IEEE Trans.
Geosci. Remote Sens. 23:25-34.
Inoue, Y., T. Kurosu., H. Maeno., S. Uratsuka., T. Kowu., K.
Dabrowska-Zielinska, and J. Qi. 2002. Season-long daily measurements of multi-frequency(Ka, Ku, X, C, and L) and full-polarization backscatter signatures over paddy rice field and their relationship with biological variables. Remote Sens.
Environ. 81: 194-204.
Jackson, T.J., A. Chang, and T.J. Schmugge. 1981. Aircraft active microwave measurements for estimating soil moisture.
Photogramm. Eng. Rem. Sens. 47:801-805.
Jackson, T.J., T.J. Schmugge, and J.R. Wang. 1982. Passive microwave sensing of soil moisture under vegetation canopies.
Water. Resour. Res. 18(4):1137-1142.
Jackson, T.J. and P. O’Neill. 1986. Temporal observations of surface soil moisture using a passive microwave sensor.
Remote Sens. Environ. 21:281-296.
Jackson, T.J. and T.J. Schmugge. 1989. Passive microwave remote sensing system for soil moisture: some supporting research. IEEE Trans. Geosci. Remote Sens. 27(2):225-235.
Kim, S.B., L. Tsang., J.T. Joel., H. Shaowu., V.Z. Jakob, and E.
Njoku. 2012. Soil moisture retrieval using time-series radar observation over bare surfaces. IEEE Trans. Geosci. Remote Sens. 50(5):1853-1863.
Kim, Y. H., S.Y. Hong, and H.Y. Lee. 2009. Estimation of paddy rice growth parameters using L, C, X-bands polarimetric scatterometer. Korean J. Remote Sens. 25: 31-44.
Kim, Y.H., S.Y. Hong., H.Y. Lee, and J.E. Lee. 2011. Monitoring soybean growth using L, C, and X-bands automatic radar scatterometer measurement. Korean J. Remote Sens. 27(2):191-201.
Kim, Y.H., S.Y. Hong, and J.E. Lee. 2012. Estimation of soil moisture content from backscattering coefficients using a radar scatterometer. Korean J. Soil Sci. Fert. 45(2):127-134.
Njoku, E.G., T.J. Jackson., V. Lakshmi., T.K. Chan, and S.V.
Nghiem. 2003. Soil moisture retrieval from AMSR-E. IEEE Trans. Geosci. Remote Sens. 41(2):215-229.
Oh, Y.S. 2004. Quantitative retrieval of soil moisture content and surface roughness from multipolarized radar observations of bare soil surfaces. IEEE Trans. Geosci. Remote Sens. 42(3):
596-601.
Owe, M., R.D. Jeu, and J. Walker. 2001. A methodology for surface soil moisture and vegetation optical depth retrieval using the microwave polarization difference index. IEEE Trans. Geosci. Remote Sens. 39(8):1643-1654.
Prasad, R. 2009. Retrieval of crop variables with field-based X-band microwave remote sensing of ladyfinger. Advanced in space research. 43:1356-1363.
Ryu, D., T.J. Jackson., R. Bindlish, and D.M. Le Vine. 2007.
L-band microwave observations over land surface using a
two-dimensional synthetic aperture radiometer. Gephys. Res.
Lett. 34(14):1-6.
Schmugge, T.J. 1978. Remote sensing of surface soil moisture. J.
Appl Meteorol. Clim. 17:1549-1557.
Schmugge, T.J. 1980. Effect of texture on microwave emission from soils. IEEE Trans. Geosci. Remote Sens. GE-18:353-361.
Shi, J.C., J. Wang., A.Y. Hsu., P.E. O'Neill, and E.T. Engman.
1997. Estimation of bare surface soil moisture and surface roughness parameter using L-band SAR image data. IEEE Trans. Geosci. Remote Sens. 35(5):1254-1266.
Ulaby, F.T. 1974. Radar measurement of soil moisture content.
IEEE Trans. Antennas Propag. 22:257-265.
Ulaby, F.T., P.P. Batlivala, and M.C. Dobson, 1978. Microwave backscatter dependence on surface roughness, soil moisture, and soil texture. IEEE Trans. Geosci. Electron. 16(4):286-295.
Ulaby, F.T., M.K, Moore, and A.K. Fung. 1982. Microwave Remote Sensing. Active and Passive. Artech House Inc., Norwood, MA, USA.
Ulaby, F.T. and C. Elachi. 1990. Radar Polarimetry for Geoscience Applications. Artech House Inc., Norwood, MA, USA.
Wang, J.R., T.J. Schmugge, and E.T. Engman. 1989. Mapping surface soil moisture with L-band radiometric measurements.
Remote Sens. Environ. 27:305-312.
Wang, S.G., X. Li, X. J. Han, and R. Jin. 2011. Estimation of surface soil moisture and roughness from multi-angular ASAR imagery in the Watershed Allied Telemetry Experimental Research (WATER). Hydrol. Earth Syst. Sci. 15:1415–1426.
Wigneron, J.P., A. Chanzy, J.C. Calvet, and N. Bruguier. 1995.
A simple algorithm to retrieve soil moisture and vegetation biomass using passive microwave measurements over crop fields. Remote Sens. Environ. 51(3):331-341.
Yang, D., F.T. Ulaby, and M.C. Dobson. 2000. Sensitivity to soil moisture by active and passive microwave sensors. IEEE Trans. Geosci. Remote Sens. 38(1):105-114.