SAR를 이용한 토양수분 및 수문인자 산출 연구동향*
정지훈
1·이용관
2※·김성준
3Research Trends on Estimation of Soil Moisture and Hydrological Components Using Synthetic Aperture
Radar*
Jee-Hun CHUNG
1·Yong-Gwan LEE
2※·Seong-Joon KIM
31
요 약
영상레이더(Synthetic Aperture Radar, SAR)는 기상조건이나 주야, 일조에 상관없이 지표면 을 촬영할 수 있고, 토양수분이나 지하수 등 수문인자의 탐색이 가능하여 수자원 분야에서 그 중 요성이 점차 두드러지고 있다. SAR는 1970년대부터 인공위성에 탑재되기 시작하여 2020년 현재 15기 이상의 SAR 위성이 운용되고 있고 향후 5년 내에도 10기 내외의 위성이 발사될 예정이다.
최근에는 관측 폭 및 해상도 증진, 다중 편파 및 다중주파수, 관측 각도의 다양화 등 다양한 형태 의 SAR 기술들이 개발 및 활용 중이다. 이에 본 고에서는 SAR 시스템의 간략한 역사와 더불어 토양수분 및 수문인자 산출과 관련된 연구동향을 조사하였다. 현재까지 SAR 위성을 활용하여 산 출 가능한 수문인자는 토양수분, 해저지하수유출, 강수, 적설분포면적, 식생지수 등이 있으며, 그 중 토양수분은 물리적 모델인 IEM(Integral Equation Model)과 인공지능 기반의 ANN(Artificial Neural Network)을 대표적으로 활용하여 우리나라를 포함한 북미, 유럽, 인도 등 총 17개국에서 연구가 진행되고 있다. 위성 탑재체는 RADARSAT-1, ENVISAT ASAR, 그리고 ERS-1/2가 가장 많이 사용되었으나 현재는 운영이 종료되었으며, 현재 운영 중인 RADARSAT-2, Sentinel-1, SMAP 등의 활용도 점차 늘어나고 있는 것으로 나타났다. 우리나라는 2025년 발사 를 목표로 C-band SAR를 탑재한 수자원·수재해 중형위성을 개발 중이므로, SAR를 이용한 다 양한 수문인자 산출 연구가 활성화될 것으로 예상된다.
주요어 : Synthetic Aperture Radar, 수문인자, 원격탐사, 토양수분
2020년 06월 12일 접수 Received on June 12, 2020 / 2020년 07월 27일 수정 Revised on July 27, 2020 / 2020년 07월 28일 심사완료 Accepted on July 28, 2020
* 본 연구는 환경부 한국환경산업기술원의 수요대응형 물공급서비스 연구사업(2016002650003)에 의해 수행되었습니다.
1 건국대학교 일반대학원 사회환경플랜트공학과 석사과정 Dept. of Civil, Environmental and Plant Engineering, Graduate School, Konkuk University, Graduate Student
2 건국대학교 일반대학원 사회환경플랜트공학과 박사수료 Dept. of Civil, Environmental and Plant Engineering, Graduate School, Konkuk University, Ph.D. Candidate
3 건국대학교 공과대학 사회환경공학부 교수 Division of Civil and Environmental Engineering, College of Engineering, Konkuk University, Professor
※ Corresponding Author E-mail : [email protected]
ABSTRACT
Synthetic Aperture Radar(SAR) is able to photograph the earth’s surface regardless of weather conditions, day and night. Because of its possibility to search for hydrological factors such as soil moisture and groundwater, and its importance is gradually increasing in the field of water resources. SAR began to be mounted on satellites in the 1970s, and about 15 or more satellites were launched as of 2020, which around 10 satellites will be launched within the next 5 years. Recently, various types of SAR technologies such as enhancement of observation width and resolution, multiple polarization and multiple frequencies, and diversification of observation angles were being developed and utilized. In this paper, a brief history of the SAR system, as well as studies for estimating soil moisture and hydrological components were investigated. Up to now hydrological components that can be estimated using SAR satellites include soil moisture, subsurface groundwater discharge, precipitation, snow cover area, leaf area index(LAI), and normalized difference vegetation index(NDVI) and among them, soil moisture is being studied in 17 countries in South Korea, North America, Europe, and India by using the physical model, the IEM(Integral Equation Model) and the artificial intelligence-based ANN(Artificial Neural Network).
RADARSAT-1, ENVISAT, ASAR, and ERS-1/2 were the most widely used satellite, but the operation has ended, and utilization of RADARSAT-2, Sentinel-1, and SMAP, which are currently in operation, is gradually increasing. Since Korea is developing a medium-sized satellite for water resources and water disasters equipped with C-band SAR with the goal of launching in 2025, various hydrological components estimation researches using SAR are expected to be active.
KEYWORDS : Synthetic Aperture Radar, Hydrological Components, Remote Sensing, Soil Moisture
서 론
영상레이더(Synthetic Aperture Radar, SAR)는 광학 카메라나 적외선 센서와는 달리 전자파를 이용함으로써, 강우나 구름 등의 기상 조건이나 주야 관계없이 지구 표면의 고해상도 영상을 획득할 수 있어 차세대 위성 탑재체로써 주목을 받고 있다. SAR는 1978년 미국의 SEASAT-A부터 인공위성에 탑재되기 시작하여 유럽의 ERS-1, 2, ENVISAT, 일본의 JERS-1, ALOS PALSAR, 캐나다의 RADARSAT-1, 2, 독일의 TerraSAR-X, TanDEM-X, 이탈리아의 COSMO-SkyMED, 우리나라의 KompSAT-5 등 현재까지 수많은 인공위성에 탑재되어 다양
한 응용 분야에서 널리 활용되고 있다. 대표적 으로는 빙하 및 해류 이동 분석, 토지피복지도 제작, 농작물 및 식생 모니터링, 재난 관리(지진 및 화산 모니터링), 토양수분, 가뭄, 홍수 및 하 천 범람 모니터링 등에 활용되고 있다(Han and Lee, 2019). 특히, 수자원 분야에서 SAR는 저 주파수를 이용한 표토층 하부의 얼음이나 물 등 의 유무 확인과 더불어 해수나 담수의 양, 식생, 토양수분 관측 등이 가능하여 수자원의 관리 및 감시에 효과적인 활용이 가능하다(Kwak, 2011;
Lim and Ahn, 2013).
토양수분은 현열과 잠열의 배분 비율을 조절 하여 지구복사에너지 평형에 영향을 미치며, 강 수의 유출과 침투량을 결정하여 물순환에 영향 을 주는 중요한 수문인자로, 수문학 연구에 있
어 토양수분 함량을 파악하는 것은 매우 중요하 다. 일부 지역에서는 관측 장비(Flux tower, TDR: Time Domain Reflectometry 등)를 통 해 토양수분을 측정하고 있으나 이러한 관측기 기는 관측 범위의 제한이 있고 운영을 위한 예 산 및 인력 확보에 어려움이 있어 전국에 설치, 운영하기에는 한계가 있으므로 원격탐사 장비를 활용한 수문인자의 산출이 대안으로 제시되고 있다.
원격탐사 장비를 활용한 토양수분의 산출은 광학 위성 자료를 활용한 간접적인 방법과 마이 크로파(Microwave) 위성 자료를 활용한 직접 적인 방법 크게 2가지로 구분된다. 이 두 가지 방법은 활용하는 전자기 스펙트럼의 파장 영역, 전자기파의 에너지원, 반사파의 측정 방법, 반사 파와 토양수분과의 물리적 관계에 주된 차이점 이 있다. 간접적인 방법은 MODIS(MODerate- resolution Image Spectroradiometer) 위성의 정 규식생지수(Normalized Difference Vegetation Index, NDVI), 지표면온도(Land Surface Temperature, LST)와 같은 인자와 토양수분 과의 상관관계를 활용해 토양수분을 산정하는 방법이다. 직접적인 방법은 토양 내의 수분함량 에 따른 유전 상수(Dielectric constant)의 상관 특성에 따라 달라지는 후방 산란(Backscatter) 및 밝기 온도(Brightness temperature) 신호로 부터 토양수분을 직접적으로 측정한다(Kim and Kim, 2011; Lee et al., 2019). Microwave 위 성은 능동형과 수동형 센서로 구분되며 수동형 센서는 SMOS(Soil Moisture and Ocean Salinity) 위성의 MIRAS(Microwave Imaging Radiometer with Aperture Synthesis), GCOM- W1(Global Change Observation Mission- Water) 위성의 AMSR2(Advanced Microwave Sacanning Radiomter 2), 그리고 능동형 센서 로는 SMAP(Soil Moisture Active Passive) 위성이 10~36㎞ 해상도의 토양수분 자료를 제 공하고 있다. Microwave 위성 자료는 매일 전 지구를 커버하지만, 저해상도 영상으로 공간적 불확실성이 크기 때문에 국지규모의 수문분석에 사용하기에는 어려움이 있다. 능동형 레이더 센
서는 송신 전파의 주파수를 조절하여 짧고 강한 마이크로파를 이용할 수 있어 고해상도의 토양 수분 산출이 가능하며, SMAP 위성의 레이더가 3km 해상도의 토양수분 자료를 제공할 예정이 었으나 기계적인 결함으로 2015년 발사 직후 자료 제공이 중단되었고, 현재는 유럽우주국 (European Space Agency, ESA)의 Sentinel-1(C-band, 5.405GHz)이 활용 가능 한 실정이다.
우리나라는 X-band(9.66GHz) 영상레이더를 탑재한 아리랑 5호(KompSAT-5)가 2013년 8월에 발사되어 고해상도, 표준, 광역 촬영 모 드(mode)에서 촬영된 다양한 해상도의 영상을 제공하고 있다. 1m 공간 해상도의 고해상도 촬 영 모드는 High Resolution mode(HR), Enhanced High Resolution mode(EH), Ultra High Resolution mode(UH)로 분류되며, 3m 공간 해상도의 표준 촬영 모드는 Standard mode(ST), Enhanced Standard mode(ES)로 분류되고, 20m 공간 해상도의 광역 촬영 모드 는 Wide Swath mode(WS), Enhanced Wide Swath mode(EW)로 분류된다(SIIS, 2015).
현재까지 KompSAT-5 영상을 활용한 연구는 상대적 영상 세기(Intensity)를 활용한 임곗값 설정 혹은 영상의 구조 및 특징 분석(Texture feature analysis) 기반 기름 유출 탐지 (Harahsheh, 2016), 선박탐지 연구(Hwang et al, 2017; Kim et al., 2018; Kim et al., 2020), 해상풍 산출(Jang et al., 2018), 수치 지형도(Digital Elevation Map, DEM) 제작 (Lee and Jung, 2018)이 수행되었다. 하지만, 일기 및 주야의 제약이 없고 고해상도의 영상을 제공한다는 장점에도 불구하고 KompSAT-5 영상레이더를 이용한 수자원 관련 연구는 수위 선 탐지(Lee, 2011), 해빙 탐지(Han et al., 2017), 수체 및 수계변화 탐지(Park, 2016;
Kim et al., 2019) 이외에는 전무한 실정이다.
본 고에서는 간략한 SAR 시스템의 개발 역 사와 현재까지 SAR를 이용한 토양수분 및 수문 인자 산출에 있어 일반적으로 사용되는 방법론 및 다양한 연구사례를 조사하여 SAR 영상을 활
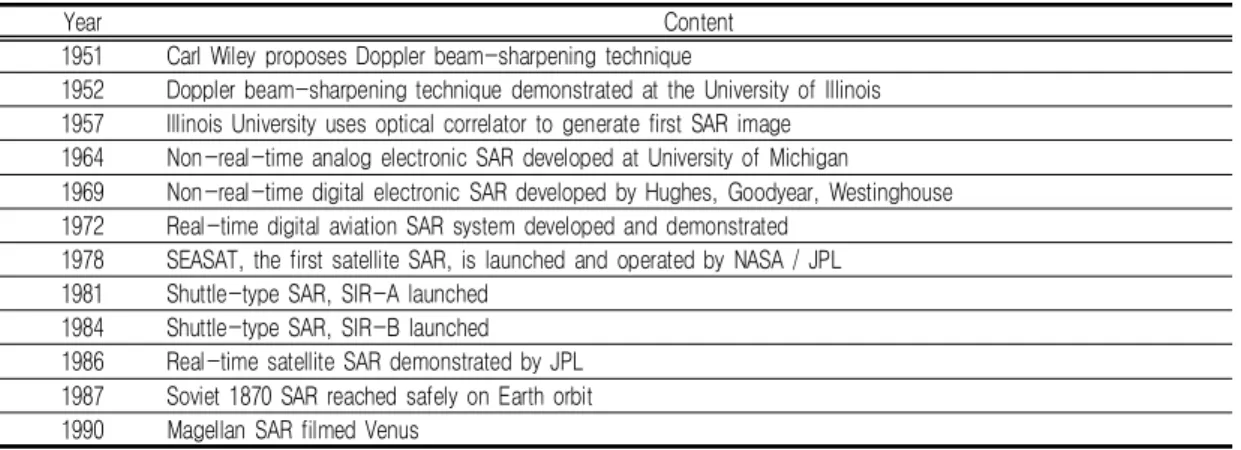
Year Content 1951 Carl Wiley proposes Doppler beam-sharpening technique
1952 Doppler beam-sharpening technique demonstrated at the University of Illinois 1957 Illinois University uses optical correlator to generate first SAR image 1964 Non-real-time analog electronic SAR developed at University of Michigan
1969 Non-real-time digital electronic SAR developed by Hughes, Goodyear, Westinghouse 1972 Real-time digital aviation SAR system developed and demonstrated
1978 SEASAT, the first satellite SAR, is launched and operated by NASA / JPL 1981 Shuttle-type SAR, SIR-A launched
1984 Shuttle-type SAR, SIR-B launched 1986 Real-time satellite SAR demonstrated by JPL 1987 Soviet 1870 SAR reached safely on Earth orbit 1990 Magellan SAR filmed Venus
TABLE 1. Development history of SAR system 용하는 연구자들에게 토양수분 및 수문인자를 산출하기 위한 적절한 방법론을 식별할 수 있는 배경을 제공하고자 한다.
SAR 시스템의 개발 역사
SAR의 개념은 1950년대 Goodyear Aircraft Cooperation의 Carl Wiley에 의해 처음으로 제 안되었다. 이후, SAR 영상 생성의 기본 이론이 된 Doppler beam-sharpening은 Goodyear사 와 일리노이 대학에 의해 연구되었으며, 비행기 에 탑재된 X-band 레이더를 이용하여 촬영하 였다. 1972년에는 NASA/JPL에서 개발된 세계 최초의 위성인 SEASAT이 해양 관측을 목적으 로 운용되었으며 해상의 다양한 SAR 영상을 제 공하였다. 이후의 대략적인 SAR 시스템의 개발 역사는 다음의 표 1과 같다.
SAR 지구관측 위성(이하 SAR 위성)의 개발 은 해양 정보수집을 목적으로 발사된 1978년 SEASAT을 시작으로 미국에 의해 주도적으로 연구되다가 1990년대에 접어들게 되면서 유럽, 일본, 캐나다에서 SAR 위성개발에 박차를 가하 기 시작하였다. SAR 위성은 연구 및 활용 목적 에 따라 주파수 밴드, 공간 해상도, 편파특성, 관측 범위 등을 기준으로 다양한 요구조건을 수 용하여 개발되어왔다. 주로 자연환경 감시 및 자원관리에 주 활용 목적을 둔 위성은 C-band
와 L-band 탑재 센서를 개발하는 추세이고 공 간 해상도의 정밀도를 기대하거나 국방 활용에 초점을 두고 개발 중인 위성은 주로 X-band 탑재 센서 개발에 주력하고 있다. 여기서, 마이 크로파는 0.3GHz(100cm)에서 100GHz(0.3cm)까 지의 범위를 가지고 있으며, 파장대는 장파장 대 역인 L-band(0.39 – 1.55GHz), 중간 대역인 C-band(3.9 – 5.75GHz), 단파장 대역인 X-band(5.75 – 10.9GHz)로 구분된다(Ulaby et al., 1981). 또한, 점차 위성 궤도의 정밀도 향상 기술을 바탕으로 한 여러 개의 위성이 하나 의 군을 이루는 방식도 등장하여 재방문 주기를 증가시켜 감시능력의 극대화를 꾀하고자 하는 노 력도 엿보인다. 다양한 사용자의 요구조건을 수용 하기 위한 각국의 전문가로 구성된 실무그룹 (Working group)을 조성하여 전 지구적인 규모 의 검 보정 사이트 구축 및 상호 기술공유 또한 활성화되는 추세이다(Yoon et al., 2006). 세계 각국은 경쟁적으로 SAR 탑재 인공위성을 개발하 고 있으며 현재 15기 이상의 SAR 위성이 운용되 고 있고 향후 5년 내에도 10기 내외의 위성이 발 사될 예정이다. 더불어 우리나라에서는 수자원·
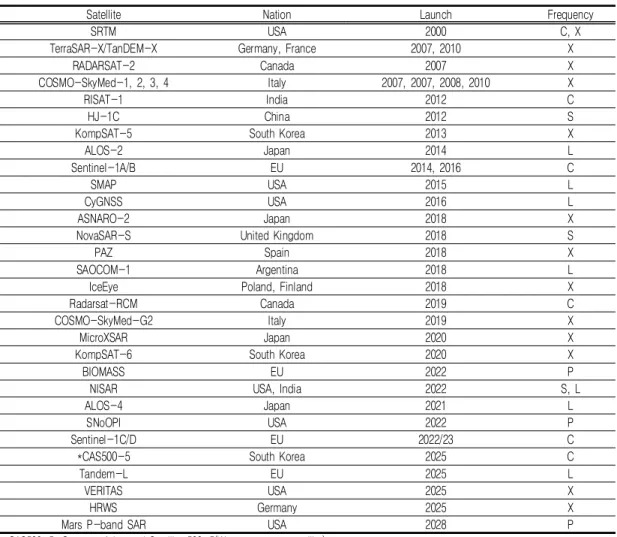
수재해 전용 C-band SAR 중형위성(Compact Advanced Satellite 500-5, CAS500-5)을 개 발하여 2025년 발사를 목표로 하고 있다. 현재 운용 중인 SAR 위성과 향후 발사 예정인 위성의 대략적인 정보는 다음과 같다(표 2).
Satellite Nation Launch Frequency
SRTM USA 2000 C, X
TerraSAR-X/TanDEM-X Germany, France 2007, 2010 X
RADARSAT-2 Canada 2007 X
COSMO-SkyMed-1, 2, 3, 4 Italy 2007, 2007, 2008, 2010 X
RISAT-1 India 2012 C
HJ-1C China 2012 S
KompSAT-5 South Korea 2013 X
ALOS-2 Japan 2014 L
Sentinel-1A/B EU 2014, 2016 C
SMAP USA 2015 L
CyGNSS USA 2016 L
ASNARO-2 Japan 2018 X
NovaSAR-S United Kingdom 2018 S
PAZ Spain 2018 X
SAOCOM-1 Argentina 2018 L
IceEye Poland, Finland 2018 X
Radarsat-RCM Canada 2019 C
COSMO-SkyMed-G2 Italy 2019 X
MicroXSAR Japan 2020 X
KompSAT-6 South Korea 2020 X
BIOMASS EU 2022 P
NISAR USA, India 2022 S, L
ALOS-4 Japan 2021 L
SNoOPI USA 2022 P
Sentinel-1C/D EU 2022/23 C
*CAS500-5 South Korea 2025 C
Tandem-L EU 2025 L
VERITAS USA 2025 X
HRWS Germany 2025 X
Mars P-band SAR USA 2028 P
* CAS500-5: Compact Advanced Satellite 500-5(Water resources satellite)
TABLE 2. Brief information of now and upcoming SAR satellites
최근 영상레이더 활용 및 기술 동향은 SAR 영상의 이용 가능한 관측량을 증대시키는 방법, 예를 들어 영상 관측 폭 및 해상도의 증가, 다 중채널 운용(다중 편파 및 다중주파수), 시계열 관측(Time Series), 관측 각도와 다양화 (Tomography, Multi-static SAR) 등으로 발 전하고 있다. 이를 실현하기 위해 디지털 빔포 밍, 다중 빔 및 채널(개구), Multi-static 영상 획득 형태, 다차원 파형 부호화 등 다양한 형태 의 SAR 기술들이 개발 및 활용되고 있다 (Yang, 2018).
SAR 위성을 이용한 수문인자 산출
SAR 위성을 이용한 본격적인 연구가 시작된 1980년대부터 다양한 위성을 이용한 수문인자 산출 연구가 수행되었으며, 주요 연구 분야로는 토양수분(Soil Moisture), 해저 지하수 유출 (Submarine Groundwater Discharge, SGD), 강수(Precipitation), 적설 분포면적(Snow Cover Area, SCA), 엽면적지수(Leaf Area Index, LAI), NDVI가 있다. 다음의 표 3은 그 항목과 국내 및 국외 기술 수준을 간략히 정리 한 것이다.
Field Primary techniques Foreign technical level Domestic technical level
Soil Moisture
- Oh/Dubois Model - Integral Equation Model - TU-Wien Change Detection
Algorithm - Regression Model - Artificial Neural Network
- Research on estimation of soil moisture using SAR has been conducted since the 1990s
- Soil moisture estimation by using SAR image and regression model and ANN has been conducted recently
Submarine Groundwater Discharge(SGD)
- Oh Model
- Integral Equation Model - None
- In the early stages of research to distinguish SGD using SAR images
Precipitation - Early stage of research - Early stages of precipitation
estimation using C-band SAR - None Snow Cover
Area(SCA)
- Baghdadi algorithm - Nagler algorithm
- Research on estimation of SCA using SAR has been conducted since the 1990s
- None
Leaf Area Index(LAI)- Water Cloud Model - Regression Model
- Research on estimation of LAI using SAR has been conducted since the 1980s
- None Normalized
Difference Vegetation Index(NDVI)
- Regression Model
- A study of estimating NDVI using regression model between Sentinel-1 SAR image and Sentinel-2 NDVI product was conducted recently
- None TABLE 3. SAR image-based research cases
1. 토양수분
다양한 수문학 및 기상학적 응용에 있어, 특 히 수문인자의 산출을 위해 토양수분은 매우 중 요한 상태 변수이다. 토양수분과 토양과 대기 사이의 관련된 플럭스는 지구의 기후체계에서 중요한 역할을 하며, 토양수분과 대기 사이에서 일어나는 결합은 특히 식생의 역할을 고려할 때 지구의 기후 시스템에 심각한 영향을 미칠 수 있다(Seneviratne et al., 2010). 토양수분으로 인한 수문학적, 기후학적 과정의 복합적인 영향 은 가뭄과 홍수와 같은 극한 현상에서 식생 및 환경 분포변화를 초래하는 등 커다란 영향을 줄 수 있다. 따라서, 토양수분 함량의 정량적인 파 악은 더 나은 모델링 및 의사결정 지원 도구 개 발에 기여할 수 있다.
SAR는 마이크로 방사파를 지표로 송신하고 센서로 돌아오는 반사파의 양을 측정하여 지표 특성을 추정하며, 기상 현상에 대한 영향이 적 기 때문에 토양수분을 포함한 지표특성을 수 미 터에서 수십 미터의 공간 해상도로 감시할 수 있다(Ulaby et al., 1982). 하지만 SAR 센서로
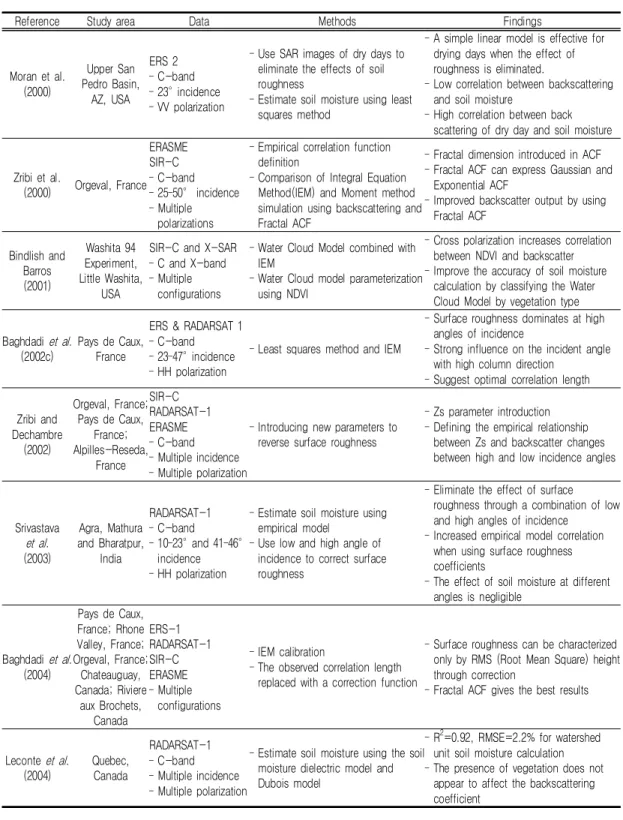
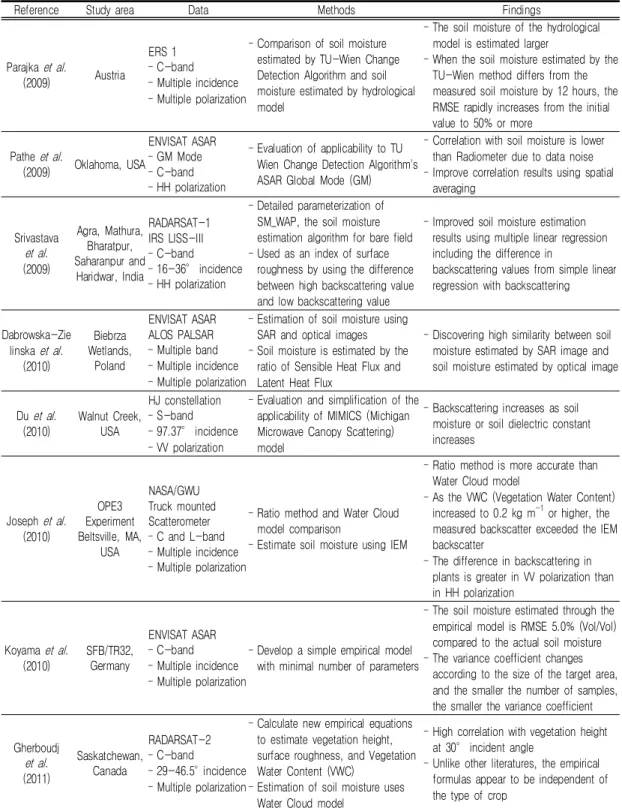
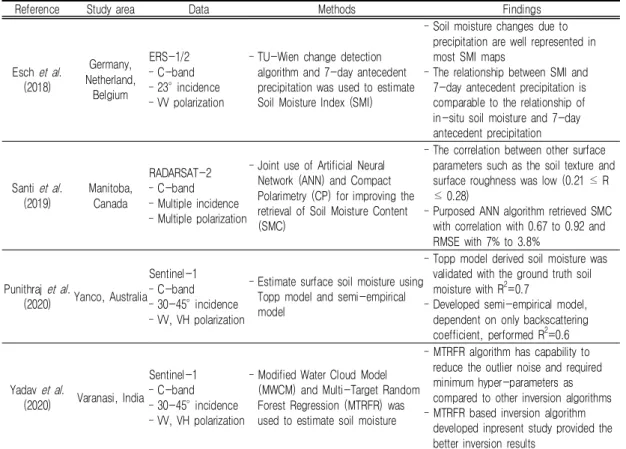
회수된 토양수분 정보를 해석하는 것은 레이더 후방 산란 신호의 고유한 복잡성과 후방 산란 모형의 역전 현상 때문에 또 다른 어려움이 있 다. 이러한 문제를 해결하기 위해 많은 연구가 수행되었으나, 수동형 토양수분 관측자료 취득 의 어려움과 동반하여 실제 SAR 영상을 활용한 고해상도 토양수분 산출연구에 제약이 되어 왔 다. 자연 표면에서 후방 산란 된 에너지의 양은 레이더의 구성, 토양 및 식생 특성에 따라 다르 며, 다양한 구성 요소의 영향과 상호작용은 초 목과 표면을 관통하는 능력과 결합되어 레이더 원격탐사 자료의 해석을 어렵게 하는 요소가 된 다. 그럼에도 불구하고, 적절한 처리로 유전체 상수를 분리하고, 레이더 신호로부터 토양수분 을 산정하기 위한 다양한 연구가 수행되어왔다 (표 4).
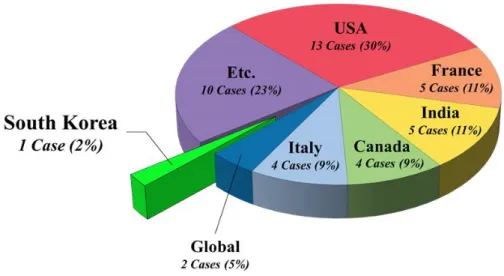
연구 대상 지역을 국가별로 살펴보면, 우리나 라를 포함한 17개국에서 SAR 영상을 이용한 토양수분 산출 연구가 진행되었으며 미국이 13 건으로 가장 많고 프랑스와 인도가 5건, 캐나다 와 이탈리아가 각 4건으로 뒤를 이어 북미와 유
Reference Study area Data Methods Findings
Moran et al.
(2000)
Upper San Pedro Basin,
AZ, USA ERS 2 – C-band – 23°incidence – VV polarization
– Use SAR images of dry days to eliminate the effects of soil roughness
– Estimate soil moisture using least squares method
– A simple linear model is effective for drying days when the effect of roughness is eliminated.
– Low correlation between backscattering and soil moisture
– High correlation between back scattering of dry day and soil moisture
Zribi et al.
(2000) Orgeval, France ERASME SIR-C – C-band – 25–50° incidence – Multiple
polarizations
– Empirical correlation function definition
– Comparison of Integral Equation Method(IEM) and Moment method simulation using backscattering and Fractal ACF
– Fractal dimension introduced in ACF – Fractal ACF can express Gaussian and
Exponential ACF
– Improved backscatter output by using Fractal ACF
Bindlish and Barros (2001)
Washita 94 Experiment, Little Washita,
USA
SIR-C and X-SAR – C and X-band – Multiple
configurations
– Water Cloud Model combined with IEM
– Water Cloud model parameterization using NDVI
– Cross polarization increases correlation between NDVI and backscatter – Improve the accuracy of soil moisture
calculation by classifying the Water Cloud Model by vegetation type
Baghdadi et al. (2002c)
Pays de Caux, France
ERS & RADARSAT 1 – C-band – 23–47°incidence – HH polarization
– Least squares method and IEM
– Surface roughness dominates at high angles of incidence
– Strong influence on the incident angle with high column direction
– Suggest optimal correlation length
Zribi and Dechambre (2002)
Orgeval, France;
Pays de Caux, France;
Alpilles-Reseda, France
SIR-C RADARSAT-1 ERASME – C-band – Multiple incidence – Multiple polarization
– Introducing new parameters to reverse surface roughness
– Zs parameter introduction – Defining the empirical relationship
between Zs and backscatter changes between high and low incidence angles
Srivastava et al. (2003)
Agra, Mathura and Bharatpur,
India
RADARSAT-1 – C-band
– 10–23°and 41–46°
incidence – HH polarization
– Estimate soil moisture using empirical model
– Use low and high angle of incidence to correct surface roughness
– Eliminate the effect of surface roughness through a combination of low and high angles of incidence
– Increased empirical model correlation when using surface roughness coefficients
– The effect of soil moisture at different angles is negligible
Baghdadi et al. (2004)
Pays de Caux, France; Rhone Valley, France;
Orgeval, France;
Chateauguay, Canada; Riviere
aux Brochets, Canada
ERS-1 RADARSAT-1 SIR-C ERASME – Multiple
configurations
– IEM calibration
– The observed correlation length replaced with a correction function
– Surface roughness can be characterized only by RMS (Root Mean Square) height through correction
– Fractal ACF gives the best results
Leconte et al. (2004)
Quebec, Canada
RADARSAT-1 – C-band – Multiple incidence – Multiple polarization
– Estimate soil moisture using the soil moisture dielectric model and Dubois model
– R2=0.92, RMSE=2.2% for watershed unit soil moisture calculation – The presence of vegetation does not
appear to affect the backscattering coefficient
TABLE 4. Case studies of SAR image-based soil moisture estimation
Reference Study area Data Methods Findings
Wang et al.
(2004) Arizona, USA ERS 2 – C-band – Multiple incidence – Multiple polarization
Optical / Microwave synergistic model using Landsat image and SAR image to estimate soil moisture in grassland / grass area
– When the soil is dry (<10%), the contribution to vegetation backscattering is large, and when the vegetation density is high, dominant backscattering occurs in vegetation, making it impossible to calculate soil moisture Manninen
et al. (2005)
Suonenjoki, Finland
ENVISAT ASAR – C-band – Multiple incidence – Multiple polarization
– Comparison of SPOT NDVI and depolarization ratio to calculate LAI
– LAI estimated with ASAR shows better results than LAI estimated with SPOT – HH / VV polarization ratio is sensitive to
LAI
Álvarez-Mozos et al. (2006)
La Tejeria Watershed, Navarre, Spain
RADARSAT 1 – C-band – Low incidence – HH polarization
– Water Cloud Model(WCM) parameterization using Landsat-7 NDVI
– Combine Watercloud model and IEM
– IEM calculation through Newton-Raphson iteration method
– Large dispersion between IEM and measured value due to spatial variability of surface roughness
– At the watershed unit scale, the IEM/WCM is relatively consistent with the measured values.
Baghdadi et al. (2006a)
Villamblain, France;
Toulouse, France;
ENVISAT ASAR – C-band – Multiple incidence – HH, HV, VV
polarization
– Least squares method and IEM – Multiple polarization, multiple
incident angle data
– Multi-polarized data show no significant improvement in soil moisture calculation
Lakhankar et al. (2006)
SGP97 Oklahoma, USA
RADARSAT-1 – C-band – HH polarization
– Comparison of artificial neural network and fuzzy logic for IEM calculation
– Using NDVI to parameterize vegetation
– Neural networks provide better results but require a lot of training
– Fuzzy logic is less accurate than neural networks, but produces consistent results
Mattia et al.
(2006) Matera, Italy
ENVISAT ASAR – C-band – 15–31° incidence – HH and VV
polarization
– estimate soil moisture using Variation assimilation method and IEM and GO models
– Thornthwaite-type model used for dictionary information
– Low quality dictionary information can reduce errors by 4%, while high quality dictionary information can reduce errors by 8%
– Preliminary estimation of surface roughness improves soil moisture calculation results
Notarnicola et al. (2006)
SMEX 02 Walnut Gulch, USA
AirSAR – C and L-band – 40°incidence – HH and VV
polarization
– IEM calculation using Bayesian method
– Eliminate vegetation effects using NDVI and NDWI
– Removal of vegetation is more effective in C-band than in L-band
– Double bounce is more pronounced in L-band, reducing soil moisture – NDWI removes vegetation effect better Srivastava
et al. (2006)
Agra, Mathura and Bharatpur,
India
RADARSAT-1 – C-band – 10–23°incidence – HH polarization
– Empirical model using least squares method to estimate soil moisture
– The estimated soil moisture has a low correlation with weight and volume moisture content and a high correlation with free water
Kasischke et al. (2007)
Delta Junction, Alaska, USA
ERS 1/2 – C-band – Multiple incidence – Multiple polarization
– Calculation of soil moisture through linear regression between backscattering and actual soil moisture for forest fires
– The accuracy of calculating soil moisture varies depending on the organic layer depth, and it is most accurate when it has a layer depth between 2.5-7.5cm
Rahman et al. (2007)
Walnut Gulch, USA
RADARSAT-1 – C-band – 47°incidence – HH polarization
– Derivation of correlation between surface roughness and correlation length using images of dry days – IEM calculation using look-up table
– Correlation length changes with surface roughness
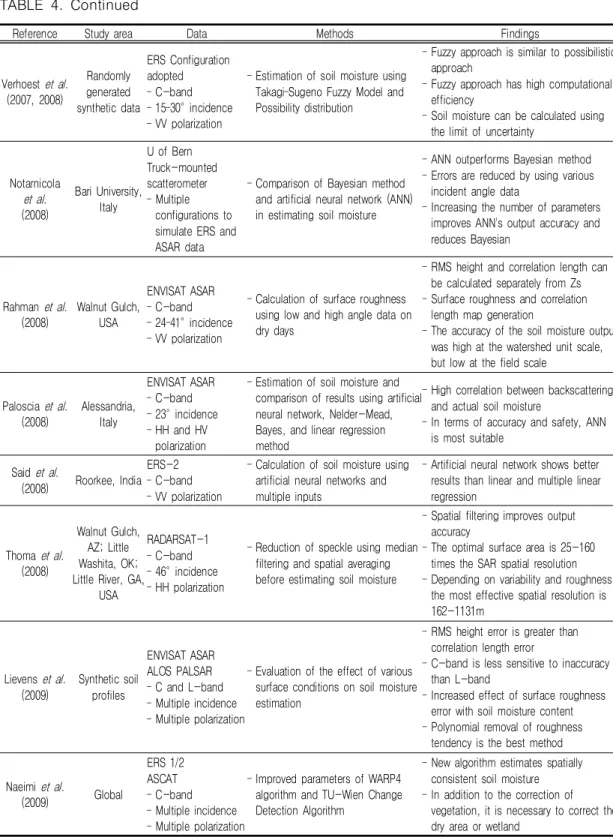
– For dry surfaces, correlation length can be calculated only by RMS height TABLE 4. Continued
Reference Study area Data Methods Findings
Verhoest et al. (2007, 2008)
Randomly generated synthetic data
ERS Configuration adopted – C-band – 15–30°incidence – VV polarization
– Estimation of soil moisture using Takagi–Sugeno Fuzzy Model and Possibility distribution
– Fuzzy approach is similar to possibilistic approach
– Fuzzy approach has high computational efficiency
– Soil moisture can be calculated using the limit of uncertainty
Notarnicola et al. (2008)
Bari University, Italy
U of Bern Truck-mounted scatterometer – Multiple
configurations to simulate ERS and ASAR data
– Comparison of Bayesian method and artificial neural network (ANN) in estimating soil moisture
– ANN outperforms Bayesian method – Errors are reduced by using various
incident angle data
– Increasing the number of parameters improves ANN's output accuracy and reduces Bayesian
Rahman et al. (2008)
Walnut Gulch, USA
ENVISAT ASAR – C-band – 24–41°incidence – VV polarization
– Calculation of surface roughness using low and high angle data on dry days
– RMS height and correlation length can be calculated separately from Zs – Surface roughness and correlation
length map generation
– The accuracy of the soil moisture output was high at the watershed unit scale, but low at the field scale
Paloscia et al. (2008)
Alessandria, Italy
ENVISAT ASAR – C-band – 23°incidence – HH and HV
polarization
– Estimation of soil moisture and comparison of results using artificial neural network, Nelder-Mead, Bayes, and linear regression method
– High correlation between backscattering and actual soil moisture
– In terms of accuracy and safety, ANN is most suitable
Said et al.
(2008) Roorkee, India ERS-2 – C-band – VV polarization
– Calculation of soil moisture using artificial neural networks and multiple inputs
– Artificial neural network shows better results than linear and multiple linear regression
Thoma et al. (2008)
Walnut Gulch, AZ; Little Washita, OK;
Little River, GA, USA
RADARSAT-1 – C-band – 46°incidence – HH polarization
– Reduction of speckle using median filtering and spatial averaging before estimating soil moisture
– Spatial filtering improves output accuracy
– The optimal surface area is 25-160 times the SAR spatial resolution – Depending on variability and roughness,
the most effective spatial resolution is 162-1131m
Lievens et al. (2009)
Synthetic soil profiles
ENVISAT ASAR ALOS PALSAR – C and L-band – Multiple incidence – Multiple polarization
– Evaluation of the effect of various surface conditions on soil moisture estimation
– RMS height error is greater than correlation length error
– C-band is less sensitive to inaccuracy than L-band
– Increased effect of surface roughness error with soil moisture content – Polynomial removal of roughness
tendency is the best method
Naeimi et al.
(2009) Global
ERS 1/2 ASCAT – C-band – Multiple incidence – Multiple polarization
– Improved parameters of WARP4 algorithm and TU-Wien Change Detection Algorithm
– New algorithm estimates spatially consistent soil moisture – In addition to the correction of
vegetation, it is necessary to correct the dry area or wetland
TABLE 4. Continued
Reference Study area Data Methods Findings
Parajka et al.
(2009) Austria
ERS 1 – C-band – Multiple incidence – Multiple polarization
– Comparison of soil moisture estimated by TU-Wien Change Detection Algorithm and soil moisture estimated by hydrological model
– The soil moisture of the hydrological model is estimated larger
– When the soil moisture estimated by the TU-Wien method differs from the measured soil moisture by 12 hours, the RMSE rapidly increases from the initial value to 50% or more
Pathe et al.
(2009) Oklahoma, USA
ENVISAT ASAR – GM Mode – C-band – HH polarization
– Evaluation of applicability to TU Wien Change Detection Algorithm's ASAR Global Mode (GM)
– Correlation with soil moisture is lower than Radiometer due to data noise – Improve correlation results using spatial
averaging
Srivastava et al. (2009)
Agra, Mathura, Bharatpur, Saharanpur and
Haridwar, India
RADARSAT-1 IRS LISS-III – C-band – 16-36° incidence – HH polarization
– Detailed parameterization of SM_WAP, the soil moisture estimation algorithm for bare field – Used as an index of surface
roughness by using the difference between high backscattering value and low backscattering value
– Improved soil moisture estimation results using multiple linear regression including the difference in
backscattering values from simple linear regression with backscattering
Dabrowska-Zie linska et al.
(2010)
Biebrza Wetlands,
Poland
ENVISAT ASAR ALOS PALSAR – Multiple band – Multiple incidence – Multiple polarization
– Estimation of soil moisture using SAR and optical images – Soil moisture is estimated by the
ratio of Sensible Heat Flux and Latent Heat Flux
– Discovering high similarity between soil moisture estimated by SAR image and soil moisture estimated by optical image
Du et al. (2010)
Walnut Creek, USA
HJ constellation – S-band – 97.37° incidence – VV polarization
– Evaluation and simplification of the applicability of MIMICS (Michigan Microwave Canopy Scattering) model
– Backscattering increases as soil moisture or soil dielectric constant increases
Joseph et al. (2010)
OPE3 Experiment Beltsville, MA,
USA
NASA/GWU Truck mounted Scatterometer – C and L-band – Multiple incidence – Multiple polarization
– Ratio method and Water Cloud model comparison
– Estimate soil moisture using IEM
– Ratio method is more accurate than Water Cloud model
– As the VWC (Vegetation Water Content) increased to 0.2 kg m-1or higher, the measured backscatter exceeded the IEM backscatter
– The difference in backscattering in plants is greater in VV polarization than in HH polarization
Koyama et al. (2010)
SFB/TR32, Germany
ENVISAT ASAR – C-band – Multiple incidence – Multiple polarization
– Develop a simple empirical model with minimal number of parameters
– The soil moisture estimated through the empirical model is RMSE 5.0% (Vol/Vol) compared to the actual soil moisture – The variance coefficient changes
according to the size of the target area, and the smaller the number of samples, the smaller the variance coefficient
Gherboudj et al. (2011)
Saskatchewan, Canada
RADARSAT-2 – C-band
– 29-46.5°incidence – Multiple polarization
– Calculate new empirical equations to estimate vegetation height, surface roughness, and Vegetation Water Content (VWC)
– Estimation of soil moisture uses Water Cloud model
– High correlation with vegetation height at 30° incident angle
– Unlike other literatures, the empirical formulas appear to be independent of the type of crop
TABLE 4. Continued
Reference Study area Data Methods Findings Lawrence et al.
(2011) Synthetic Data Laboratory radar data– Apply FEM model to estimate backscattering on rough surfaces
– FEM is not more accurate than MoM, but provides an alternative to multi-layer structures
Balenzano et al. (2012)
Demmin, Germany;
Flevoland, Netherlands;
Matera, Italy
ENVISAT ASAR RADARSAT-2 – C-band – Multiple incidence – HH and VV
polarization
– Applying SMOSAR Algorithm based on temporal change of
backscattering in a short revisit cycle
– VV polarization in the back scattering at low spatial resolution has lower soil moisture estimation accuracy than HH polarization
Crooks and Cheke (2014)
Karoo, South Africa
RADARSAT-2 ERS-2 – C-band – 19.4-31.0°
incidence – HH polarization
– Estimate soil moisture using IEM and Water Cloud model
– If only the standard deviation of the surface is the variable, the accuracy of calculating soil moisture is
±0.06cm3cm-3
– The accuracy of RADARSAT is lower as
±0.14cm3cm-3
Vreugdenhil et al. (2016)
Global
ASCAT AMSR-E – C-band – Multiple incidence Multiple polarization
– Analysis of vegetation correction method of TU-Wien Change Detection Algorithm
– Estimation of vegetation optical depth of water cloud model
– High temporal correlation of vegetation optical depth in temperate and continental climate regions
– In arid regions and tropical climates, the correlation is low or negative
Alexakis et al.
(2017) Chania, Greece
Sentinel-1 – C-band – 38-41°incidence – HH and VV
polarization
– Combination of Dubois model and Topp model to apply vegetation and surface roughness effects – Estimate soil moisture using ANN
– Nonlinear approach to actual soil moisture accounts for about 89.5%
uncertainty
– When estimating soil moisture, the angle of incidence is the least sensitive and the NDVI is the most sensitive
Kim et al.
(2017) Global
SMAP – L-band – Multiple incidence – HH, VV, and HV
polarization
– Global soil moisture mapping considering various soil moisture, surface roughness, and vegetation conditions
– Using forward model that considers different radar mechanisms between vegetation types
– After optimizing the model, the evaluation results for 14 verification areas around the world show that the soil moisture recovery rate is 0.052 m3/m3
Lee et al.
(2017) South Korea
Sentinel-1 – C-band – 30-45°incidence – VV and VH
polarization
– Estimation of soil moisture using linear regression and SVR (Support Vector Machine)
– Comparison of estimation results according to polarization, angle of incidence, and precipitation
– Overall Root Square Error (RMSE) 6.5%
occurred
– The estimation accuracy is high when there is sufficient and evenly distributed moisture on the ground
Bauer-Marschal linger et al.
(2018)
Umbra, Italy
Sentinel-1 – C-band – 30-45°incidence – VV polarization
– Estimation of high-resolution, high-frequency soil water index product named Scatterometer Synthetic Aperture Radar Soil Water Index (SCATSAR-SWI) by fusion of Metop ASCAT and Sentinel-1 SAR image
– Estimated SCATSAR-SWI yields comprehensively high agreement with the reference data (Median R = 0.61 vs. in situ; 0.71 vs. model; 0.83 vs.
ASCAT SSM).
– With SM2RAIN approch, SCATSAR-SWI shows good capability to estimate 5-day accumulated rainfall with R=0.89 TABLE 4. Continued
Reference Study area Data Methods Findings
Esch et al. (2018)
Germany, Netherland,
Belgium
ERS-1/2 – C-band – 23°incidence – VV polarization
– TU-Wien change detection algorithm and 7-day antecedent precipitation was used to estimate Soil Moisture Index (SMI)
– Soil moisture changes due to precipitation are well represented in most SMI maps
– The relationship between SMI and 7-day antecedent precipitation is comparable to the relationship of in-situ soil moisture and 7-day antecedent precipitation
Santi et al. (2019)
Manitoba, Canada
RADARSAT-2 – C-band – Multiple incidence – Multiple polarization
– Joint use of Artificial Neural Network (ANN) and Compact Polarimetry (CP) for improving the retrieval of Soil Moisture Content (SMC)
– The correlation between other surface parameters such as the soil texture and surface roughness was low (0.21 ≤ R
≤ 0.28)
– Purposed ANN algorithm retrieved SMC with correlation with 0.67 to 0.92 and RMSE with 7% to 3.8%
Punithraj et al.
(2020) Yanco, Australia Sentinel-1 – C-band – 30-45°incidence – VV, VH polarization
– Estimate surface soil moisture using Topp model and semi-empirical model
– Topp model derived soil moisture was validated with the ground truth soil moisture with R2=0.7
– Developed semi-empirical model, dependent on only backscattering coefficient, performed R2=0.6
Yadav et al.
(2020) Varanasi, India
Sentinel-1 – C-band – 30-45°incidence – VV, VH polarization
– Modified Water Cloud Model (MWCM) and Multi-Target Random Forest Regression (MTRFR) was used to estimate soil moisture
– MTRFR algorithm has capability to reduce the outlier noise and required minimum hyper-parameters as compared to other inversion algorithms – MTRFR based inversion algorithm
developed inpresent study provided the better inversion results
TABLE 4. Continued
럽, 그리고 인도에서 주도적으로 연구가 진행되 고 있음을 알 수 있다(그림 1). 위성 탑재체의 경우 RADARSAT-1이 11건으로 가장 많이 사용되었고 ENVISAT ASAR가 9건, ERS-1 과 ERS-2가 각 6건과 7건, SIR-C/X-SAR가 4건으로 나타났으나 5개의 위성 탑재체들은 모 두 운영이 종료되었고, 현재 운영 중인 RADARSAT-2, Sentinel-1, SMAP 등을 활 용한 연구는 각 4건, 5건 및 1건으로 상대적으 로 그 수가 많지 않으나 점차 증가할 것으로 보 인다(표 5). 근미래(2025년)에 발사될 예정인 차세대 중형위성에 탑재될 센서가 C-band SAR임을 고려할 때 국내를 대상으로 한 토양수 분 산출 선행 연구에 활용될 여지가 있는 위성 탑재체는 RADARSAT-2와 Sentinel-1이라고 할 수 있다. Sentinel-1은 ESA에서 무료로 영상
을 제공하고 있지만, RADARSAT-2의 경우 캐나다의 MDA 社에서 영상 1장당 최소
$3,600, 최대 $7,800에 판매하고 있어(MDA, 2020) 개인 연구자들에게 있어 활용하기 어려 워 보인다. 또한, 산출 토양수분의 검증에 활용 되는 실측 토양수분 자료의 경우 우리나라에서 는 대표적으로 기상청, 한국수자원조사기술원, K-water, 농촌진흥청에서 실측을 수행하고 있 으며(Lee et al., 2019), 4개 기관 중 가장 많 은 200여 관측지점에서 토양수분을 측정하는 농촌진흥청의 경우 2014년부터 자료의 획득이 가능하여 Sentinel-1의 발사 시기인 2014년과 비교적 일치한다. 위성영상과 실측 토양수분 자 료의 접근성 및 활용성을 고려했을 때 Sentinel-1 위성이 국내를 대상으로 한 연구에 가장 활용 가치가 높을 것으로 판단된다.
FIGURE 1. Current status of research on estimating soil moisture by country
Observing system Launch date Frequency band
Temporal resolution (days)
Spatial resolution
(m) Operation status Cases
RADARSAT-1 1995 C 24 10~100 End (2013.03) 11
ENVISAT ASAR 2002 C 35 30~150 End (2012.04) 9
ERS-2 1995 C 35 30 End (2011.07) 7
ERS-1 1991 C 35 30 End (2000.03) 6
Sentinel-1 2014/16 C 12 5~100 O 5
SIR-C/X-SAR 1994 L, C, X - 10~30 End (1994.04) 4
RADARSAT-2 2007 C 24 3~100 O 4
ERASME at times at times at times at times at times 2
ALOS PALSAR 2006 L 46 7~100 End (2011.04) 2
Truck Mounted
Scatterometer at times at times at times at times at times 2
AirSAR at times at times at times at times at times 1
HJ-1C 2012 S 4 20 O (2012~2019) 1
NASA/GWU at times at times at times at times at times 1
SMAP 2015 L 1 3~36km O 1
TABLE 5. Satellites used for SAR image-based soil moisture estimation 토양수분 산출연구에 사용된 모델은 물리적 모
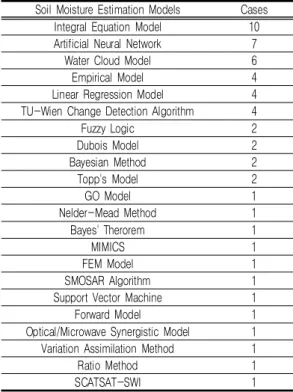
델인 IEM(Integral Equation Model)이 10건으 로 가장 많이 사용되었으며, ANN(Artificial Neural Network)과 WCM(Water Cloud Model)이 각 7건과 6건씩으로 나타나 이론적 모델이나 물리적 모델 이외에도 인공지능을 이 용한 연구가 점차 증가함을 시사한다(표 6).
IEM이나 WCM의 표면 매개 변수인 지표면 표
준편차, 상관 길이, 토양 유전 상수는 보통 미지 수로 간주 되거나 실측을 통해 얻어진다. 실험실 환경이 아닌 광범위한 현장에서의 표면 매개 변 수의 실측은 토양의 자연적 변동성으로 특성화하 기 어렵고 실측이 이루어지지 않은 경우, 모형의 적용이 어려운 한계점이 있다(Srivastava et al., 2008). 따라서, 현장조사가 필요치 않은 TU-Wien Change Detection Algorithm이나
Soil Moisture Estimation Models Cases
Integral Equation Model 10
Artificial Neural Network 7
Water Cloud Model 6
Empirical Model 4
Linear Regression Model 4
TU-Wien Change Detection Algorithm 4
Fuzzy Logic 2
Dubois Model 2
Bayesian Method 2
Topp's Model 2
GO Model 1
Nelder-Mead Method 1
Bayes' Therorem 1
MIMICS 1
FEM Model 1
SMOSAR Algorithm 1
Support Vector Machine 1
Forward Model 1
Optical/Microwave Synergistic Model 1 Variation Assimilation Method 1
Ratio Method 1
SCATSAT-SWI 1
TABLE 6. A models used to estimate soil moisture based on SAR images
Regression Model, ANN이 비교적 간단하게 국내에 적용 가능할 것으로 보이며, 표면 매개 변수의 실측이 수반될 경우 IEM과 WCM 등의 이론적 모델도 활용 가능할 것으로 판단된다.
SAR를 이용해 산출된 토양수분 자료(이하 토양수분 자료)는 수문학 및 기상 응용 분야에 활용 가치가 높은 것으로 알려져 있다. 특히, 수 문학적 모델은 지표수나 에너지 플럭스의 시뮬 레이션을 위해 기상 데이터나 토양수분의 초기 상태 등의 다양한 입력 데이터의 가용성과 정확
성에 의존되는데, 토양수분 자료는 동화
(Assimilation)를 통해 모델에 존재할 수 있는 불확실성을 줄일 수 있다(Merlin et al., 2006.;
Lowe et al., 2009; Bolten et al., 2010). 또 한, 흐름이 일시적이거나 매우 가변적인 유역 (Wooldridge et al., 2003), 혹은 기후변화의 영향을 받는 유역(Merz et al., 2011; Peel and Bloschl, 2011; Ahn et al., 2013)에 대해
토양수분 자료가 수문학적 모델의 매개 변수화 및 교정(Calibration)에 도움을 줄 수 있으며, 전 지구에 달하는 SAR 위성의 촬영 범위는 미 계측 유역의 매개 변수화에 대한 잠재적 이점을 가진다.
토양수분 자료는 데이터의 가용성 부족과 산 출된 토양수분 자료의 정확도가 높지 않다는 단 점이 있지만, 이는 토양수분 산출에서의 성능 지표가 실측 토양수분과의 단순 비교에 초점이 맞춰져 있고 토양수분의 공간적 이질성(Spatial heterogeneity)이나 응용 단계에서의 장점을 설 명하지 않기 때문이다(Konelsen et al., 2013).
토양수분의 공간적 패턴은 유출 면적과 같은 중 요한 패턴을 잘 식별할 수 있어 다수의 연구에서 수문학적 모델의 시뮬레이션 성능이 토양수분의 산출 정확도보다 공간적 이질성에 더 영향을 받 는 것으로 나타났다(Bronstert and Bardossy, 1999; Pan and Wood, 2010). 따라서, 토양수 분 자료의 이점은 토양수분 산출 자체보다는 유 역 단위의 공간적 패턴 식별에 있다고 할 수 있 다(Parada and Liang, 2008; Wagner et al., 2008).
1) 반경험적 모델
많은 논문에서 레이더의 후방산란계수(Backscattering coefficient)와 토양수분 간 경험적 모델을 제시 하였다(Oh et al., 1992; Wang et al., 1997;
Quesney et al., 2000; Le Hegarat-Mascle et al., 2002; Zribi and Dechambre, 2002;
Zribi et al., 2005). 이러한 경험적 모델들은 후방산란계수로부터 토양수분을 적절히 산출 가 능하나, 일반적으로 적용이 불가능한 단점이 있 는데(Oh et al., 1992; Dubois et al., 1995 a,b; Moran et al., 2000; Le Hegarat- Mascle et al., 2002), 반경험적 모델은 광범위 하게 분포된 경험적 모델의 단순성과 이론적/물 리적 기초를 결합한 절충점을 제공할 수 있다.
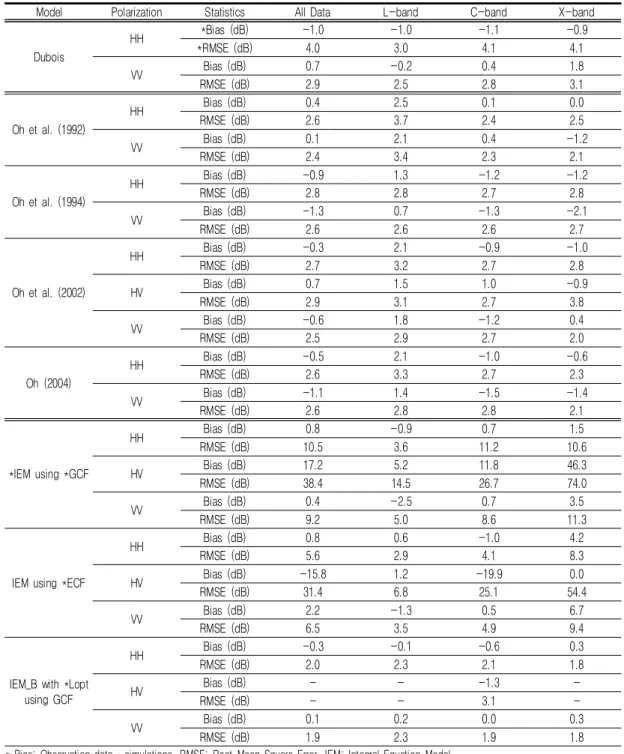
일반적으로 사용되는 반경험적 모델은 Oh model(Oh et al., 1992)과 Dubois model (Dubois et al., 1995a)이 있다.