http://dx.doi.org/10.7839/ksfc.2014.11.1.014
엔진윤활용 가변 베인펌프의 수학적 모델 해석 Analysis of the Mathematical Model
of a Variable Displacement Vane Pump for Engine Lubrication
딩광청
1․안경관
1*․이재신
2D. Q. Truong, K. K. Ahn and J. S. Lee
Received: 7 Jan. 2014, Revised: 22 Feb. 2014, Accepted: 25 Feb. 2014
Key Words:Engine Lubrication(엔진윤활), Vane Pump(베인펌프), Variable Displacement(가변용량), Modeling
(모델링)
Abstract: Variable displacement vane-type oil pumps represent one of the most innovative pump types for
industrial applications, especially for engine lubrication systems. This paper presents a complete and accurate mathematical model for a typical variable displacement vane-type oil pump. Firstly, its theoretical model is revised. Secondly, an analysis of power loss factors of this pump type is carefully investigated to optimize the modeling accuracy. Finally, the estimated pump performance using the complete pump model is verified by numerical simulations in comparison with the practical tests.
* Corresponding author: [email protected]
1 School of Mechanical Engineering, University of Ulsan, Ulsan, Korea.
2 School of Materials Science and Engineering, University of Ulsan, Ulsan, Korea.
Copyright Ⓒ 2014, KSFC
This is an Open-Access article distributed under the terms of the Creative Commons Attribution Non-Commercial License(http://
creativecommons.org/licenses/by-nc/3.0) which permits unrestricted non-commercial use, distribution, and reproduction in any medium, provided the original work is properly cited.
1. Introduction
In recent years, the design requirements for engine lubrication systems, especially for vehicle applications, have been oriented to a general performance improvement, coupled with a contemporary reduction of power losses, weights and volumes. A fixed displacement lubricating pump is generally operates effectively at a target speed and a maximum operating lubricant temperature. Meanwhile, the lubrication requirements of the machine do not directly correspond to its operating speed. It results in an oversupply of lubricating oil at most machines. A
pressure relief valve is then provided to return the
surplus lubricating oil back into the pump inlet or
a reservoir to avoid over pressure conditions in the
mechanical system. The result is a significant
amount of energy being used to pressurize the
lubricating oil which is subsequently exhausted
through the relief valve. Subsequently, a potential
trend for machine lubrication is the employment of
variable displacement vane pumps as lubrication oil
pumps. To vary the displacement, there are two
common approaches which are the use of a linear
translating cam ring1-3), and the use of a pivoting
cam ring
4‐12). By the second method, each pump
generally includes a control ring combined with
other mechanisms such as springs, which can be
operated to alter the volumetric displacement of
the pump and thus its output at an operating
speed. The pump control mechanisms are normally
supplied with pressurized lubricating oil from the
pump output to drive the pump displacement and
to avoid over pressure situations in the engine
throughout the expected operating range of the
mechanical system. Therefore, development of a
variable displacement vane‐type oil pump model is indispensable and can be considered as a priority task in order to investigate the pump working performance as well as to optimize the pump design structure. Some studies relating to this field have been done to investigate the pump performances
8‐11). Giuffrida and Lanzafame
8)derived a mathematical model for a fixed displacement balanced vane pump to analyze the theoretical flow rate through the cam shape design and vane thickness. Staley et al.
9)carried out a study on a variable displacement vane pump for engine lubrication. Loganathan et al.
10)also developed a variable displacement vane pump for automotive applications by simulations and experiments. In another study, Kim et al.
11)investigated an electronic control variable displacement lubrication oil pump through a simple mathematical model.
Although these studies bring some interesting results, a detailed analysis of the theoretical performance as well as a careful investigation on the power losses of a variable displacement vane‐
type oil pump in order to derive an accurate model based on practical experiments was not considered.
This paper is to investigate carefully the power loss factors of the actual pump during its operation. It is based on the pump geometric and dynamic analyses, and its theoretical model developed by the authors in the previous work
13). As a result, the actual pump performance can be estimated well by using this model. It can be considered as mandatory steps for a deeper understanding of pump operation as well as for effectively implementing pump control mechanism to satisfy the urgent lubrication demands.
2. Overview of The Researched Vane Pump and Its Theoretical Model
2.1 The researched vane‐type oil pump
In this study, a variable displacement vane‐type oil pump made by MyungHwa Co. Ltd.
11)as displayed in Fig. 1 was used for the investigation.
During the pump operation, the vanes slide out of
the rotor slots and the vane tip‐edges always contact with the ring inside contour due to their centrifugal effects. Subsequently, it performs pumping chambers between succeeding vanes to carry oil from the inlet to the outlet. The increase in volumes forming by pumping chambers allows the oil to be pushed in by atmospheric pressure from oil sump through suction pipe.
Fig.1 The vane‐type oil pump for research
The pumping chamber volumes continue to increase in size for the first half of each rotation.
The oil is then carried to the other side where the pumping chamber volumes begin to be reduced.
Finally, the oil is squeezed out at the outlet as the pumping chamber's size decreases. For varying the pump displacement, rotation of the main ring around the pivot pin is controlled by pressurized oil itself in the control chamber through the orifice, the pumping chambers, centrifugal force effects and the return spring.
From the previous results
13), the pump
theoretical model is presented in Section 2.2.
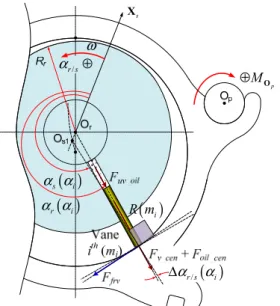
2.2 Pump theoretical model 2.2.1 Flow rate analysis
The analysis of a generic vane i
this carried out on a cross section of the pump as in Fig. 2. Points O
rand O
sare in turn the centers of rotor and main ring inside surface of which their radii are R
rand R
s. The eccentricity between the rotor and the ring inner surface is e
c. There are N vanes with thickness t
vand radius R
vat its tip curve (center point O
vi). The rotor rotates with a constant velocityω (pump speed is n).
The vane lift (l
v) can be obtained as
O B O O
vi r i r r vi v r
l = −R = +R −R
(1)
αi i
β γi
ρi
ω
Fig. 2 Geometric analysis of a generic vane
For a small rotational angle of the rotor d
α, the volume derivative of the chamber under vane
ithis
dVuv( )
αi/
dαand, the volume derivative of a chamber between two consecutive vanes (i
thand (i+1)
th) is
dVbv( α αi, i+1)
/dα . Then the theoretical flow rate of the pump can be computed as
( ) ( )
(( )
)( )
(( )
)( )
(( )
)1
1 1
1 1
1 1
1 1
2 1 ,
, 1
2
1 , , 1
2
N uv i
th uv i
i
N bv i i
bv i i
i bv
N bv N
Q dV sign dV
d
dV sign dV
d
dV sign dV d
α ω α α
α
ω α α α α
α
ω α α α α
α
=
− +
= +
⎡ ⎤
= ⎣ − ⎦
⎡ ⎤
+ ⎣ − ⎦
⎡ ⎤
+ ⎣ − ⎦
∑
∑
(2)
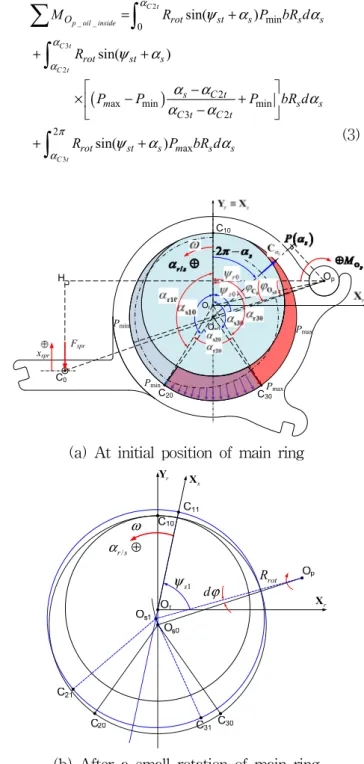
2.2.2 Main ring rotation analysis
a) Force due to pressurized oil inside main ring
Total moment acting on the ring caused by the pressurized oil inside the ring can be computed as the bellow equation (Fig. 3):
( )
2 _ _
3 2
3
0 min
ax min 2 min
3 2
2
ax
sin( )
sin( )
sin( )
C t p oil inside C t C t
C t
O rot st s s s
rot st s
s C t
m s s
C t C t
rot st s m s s
M R P bR d
R
P P P bR d
R P bR d
α
α α
π α
ψ α α
ψ α
α α α
α α
ψ α α
= +
+ +
⎡ − ⎤
×⎢ − + ⎥
⎣ − ⎦
+ +
∑ ∫
∫
∫ (3)
Os0
Op
Fspr
C0
H
xspr
Pmin Pmax
C30
C10
C20 Or
Pmax
Pmin
(a) At initial position of main ring
/
αr s⊕ ω
dϕ
Yr
Xr
Xs
1
ψs Rrot
(b) After a small rotation of main ring Fig. 3 Pressure distribution inside main ring
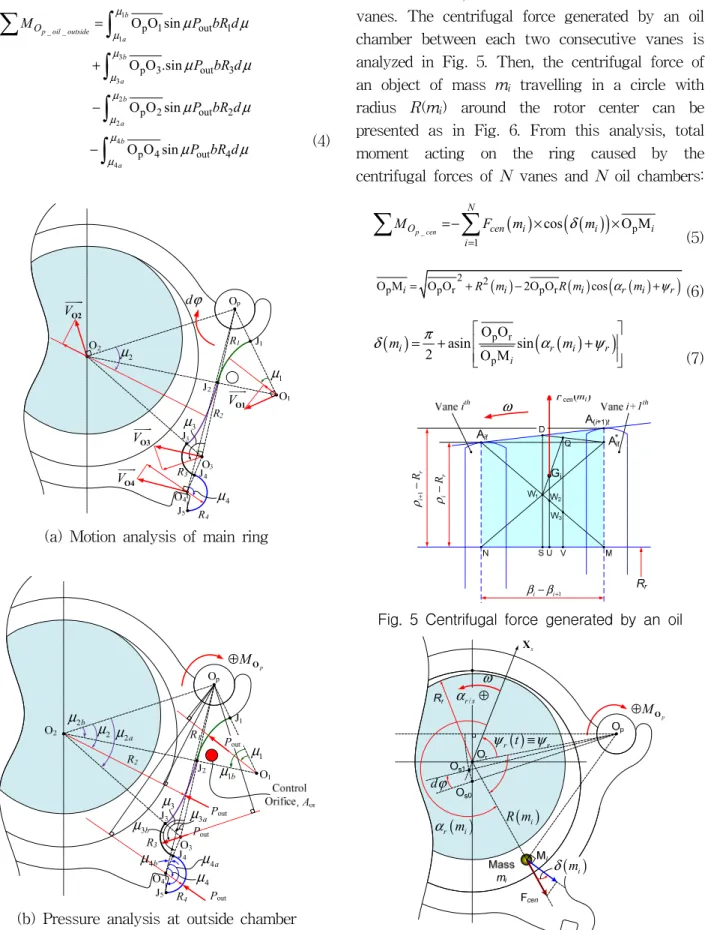
b) Force due to pressurized oil outside main ring (through the control orifice)
Total moment acting on the ring outer surface caused by the pressurized oil is derived (see Fig.
4)
1 _ _
1 3
3 2
2 4 4
p 1 out 1
p 3 out 3
p 2 out 2
p 4 out 4
O O sin
O O .sin
O O sin
O O sin
b p oil outside
a b
a b
a b a
MO P bR d
P bR d
P bR d
P bR d
μ μ μ μ
μ μ μ μ
μ μ
μ μ
μ μ
μ μ
=
+
−
−
∑ ∫
∫
∫
∫ (4)
μ1
μ2
μ3
μ4
dϕ
VuuurO1 VuuurO2
VuuurO3 VuuurO4
(a) Motion analysis of main ring
μ1
μ1b
μ2a
μ2b
μ2
μ3a
μ3
μ3b
μ4a
μ4
μ4b
M p
⊕ O
(b) Pressure analysis at outside chamber Fig. 4 Pressure distribution outside main ring
c) Force due to centrifugal effects of vanes and
oil volumes between vanesHere, centrifugal forces are due to oil volume between vanes, oil volumes under vanes and vanes. The centrifugal force generated by an oil chamber between each two consecutive vanes is analyzed in Fig. 5. Then, the centrifugal force of an object of mass m
itravelling in a circle with radius R(m
i) around the rotor center can be presented as in Fig. 6. From this analysis, total moment acting on the ring caused by the centrifugal forces of N vanes and N oil chambers:
( )
(( )
)_ p
1
cos O M
p cen
N
O cen i i i
i
M F m
δ
m=
=− × ×
∑ ∑ (5)
( ) ( ) ( ( ) )
2 2
p p r p r
O Mi= O O +R mi −2O OR mi cosαr mi +ψr
(6)
( )
p r (( )
)p
asin O O sin
2 O M
i r i r
i
m
π
mδ
= + ⎡⎢α
+ψ
⎤⎥⎢ ⎥
⎣ ⎦
(7)
1
i i
β β− +
ω
irRρ−
1irRρ+−
Fig. 5 Centrifugal force generated by an oil
M p
⊕ O
( )
r mi
α
( )
miδ dϕ
Xs
( )
r t r
ψ ≡ψ
/
αr s⊕ω
( )
iR m
Fig. 6 Centrifugal force effect on ring rotation
d) Force of compression spring
From Fig. 3, the moment generated by the spring force can be computed as
( )
O Hcosp
Ospr spr C
M =−F ×
ϕ (8)
where
Fspris derived as
( )
0
0
;
is pre-loadforceof thespringat initial position
spr spr spr spr
spr
F F k x
F
= +
(9) Finally, the ring rotation defined by summing moments acting on the ring around the pivot point:
_ _
_
p oil inside p_oil_outside
p cen spr
ring O O
O O
I M M
M M
ϕ
= ++ +
∑ ∑
∑
&&
(10) here I
ringis the ring moment of inertia.
3. Actual Power Loss Analysis
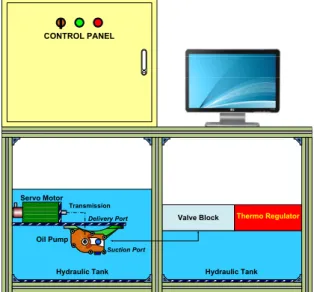
3.1 Experimental analysis
To investigate the actual performance of the vane pump, an apparatus has been setup as in Fig.
7. The system hardware mainly includes the pump driven by an AC servo motor, a flow control valve, a thermo regulator, an oil sump and proper sensors. The system control part includes an electric control box and a compatible PC. During the operation, the pump speed is ensured by the
Hydraulic Tank
Thermo Regulator Valve Block
CONTROL PANEL
Servo Motor
Hydraulic Tank Oil Pump
Transmission
Suction Port Delivery Port
Fig. 7 Experimental apparatus
motor while the pump flow rate is adjusted by the fabricated actuator. The lubrication oil used for experiments was SAE 5W-20 series.
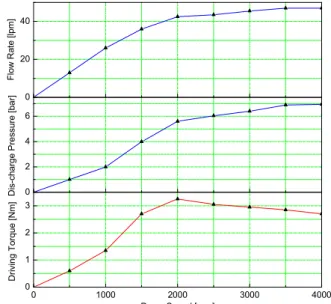
The load and oil conditions are created by the flow control valve and thermo regulator, respectively. For evaluating the system, torque and speed sensors are used to measure the driving torque and speed of the pump while pressure gauge and flow meter are used to measure the pump output pressure and flow rate. To ensure the suitable oil level of the oil sump during the tests, lever switch sensors are employed. To represent as the real lubrication conditions, the fixed flow restriction valve was employed. For the experiments, the pump speed was varied from 0 to 4000rpm with a step of 500rpm while the valve opened area was set to 60%. The working temperature during these experiments was controlled to be constant at 120
oC by using a thermo‐regulating system. The experimental results were then obtained as shown in Fig. 8.
From this figure, it can be seen that the actual pump flow rate is largely different with the theoretical flow rate
13). The reason for it is the loss of power during the system operation.
3.2 Actual power loss analysis 3.2.1 Power loss due to leakages
Internal leakage is generally caused by the pressure distribution within the pump and the clearances associated with the pumping chambers.
Because the volumes of chambers under vanes are significantly small in comparison with those of chambers between vanes, the leakage flows are only investigated with chambers between vanes.
For a generic chamber between two consecutive vanes represented by the angles
. There are 8 leakage flows can be counted as:
• Ql1
: leakage between the rotor inner area and the oil chamber due to a clearance, ζ :
l1( )
(( )
)( )
31 1 min
1 1
, ,
12
l i i
l i i
oil r ri
b P P
Q R R
ζ α α
α α η
+ +
= −
−
(11)
here η is the dynamic viscosity of oil.
oil• Ql2
: leakage between the rotor inner area and the oil chamber due to a clearance, ζ :
l2( ) ( ( ) )
( )
1 1 32 1 min
2 1
, ,
12
i i ri v l l i i
l i i
oil r ri
R t P P
Q R R
α α ζ ζ α α
α α η
+ +
+
⎡ − − − ⎤ −
⎣ ⎦
= −
(12)
• Ql3
: leakage between the rotor inner area and the oil chamber due to a clearance, ζ :
l3( )
(( )
)( )
33 1 min
3 1
, ,
12
v l i i
l i i
oil r ri
t P P
Q R R
ζ α α
α α η
+ + −
= −
(13)
• Ql4
: leakage between the oil chamber and its previous chamber due to a clearance, ζ
l4 ≡ζ
l3:
( )
( )1 34((
1 2) (
1)
)4 1
, ,
, 12
l i i i i
v i
l i i
oil v
l P P
Q t
ζ α α α α
α α η
+ + +
+ +
= −
(14)
• Ql5
: leakage between the oil chamber and its next chamber due to a clearance, ζ
l5 ≡ζ
l3:
( )
35((
1) (
1)
)5 1
, ,
, 12
vi l i i i i
l i i
oil v
l P P
Q t
ζ α α α α
α α η
+ −
+
= −
(15)
• Ql6
: leakage between the oil chamber and the area outside ring due to a clearance, ζ :
l6( )
(( )
)( )
1 3
1 6 1 min
6 1
2 ,
, 12
i i
i i l i i
l i i
oil se s
P P
Q R R
α α ρ ρ ζ α α
α α η
+ + +
+
+
⎡ ⎤
− −
⎢ ⎥
⎣ ⎦
= −
(16)
• Ql7
: leakage between the oil chamber and its previous chamber due to a clearance between the vane front side (vane tip) and the ring inner contour.
• Ql8
leakage between the oil chamber and its next chamber due to a clearance between the vane tip and the ring inner contour.
During the operation, the vane tip edges contact with the inner contour of the ring in most cases due to the pressurized oil in the chambers under vanes and the centrifugal forces. Since, the leakages, Q
l7and Q
l8, are neglected. Hence, the
total leakage flow of an oil chamber between two consecutive vanes is obtained:
(
1)
4(
1)
6(
1)
1
, 2 , ,
leak i i l i i li i i
i
Q
α α
+ Qα α
+ Qα α
+=
Δ = −
∑
(17) 3.2.2 Power loss due to temperature and
pressure changes
For evaluating the effects of temperature and pressure on the pump flow rate, an equivalent laminar flow Q
eqof oil through a long cylindrical pipe, with radius R
eqand length L
eq, is used. Theequivalent flow rate can be computed using Poiseuille’s equation:
( )
4( )
max( )
min8
eq eq
oil eq
R P t P
Q t
t L
π η
= × × −
(18)
( ) ( ) ( )
oil t oil t oil t
η
=υ
×ρ (19)
where υ
oil( )
tis kinematic viscosity of oil; and the oil density is derived from its defined value at time t=0 as
( )
1(
1 0)
1(
0max1 max 0)
/oil oil
oil oil
t T T P P
ρ ρ
λ β
=⎡⎣ + − ⎤ ⎡⎦ ⎣ − − ⎤⎦
(20)
where λ is volumetric temperature expansion
oilcoefficient; T
0–P
max0and T
1–P
max1are in turn the initial and final working temperature–pressure.
0 20 40
Flow Rate [lpm]
0 2 4 6
Dis-charge Pressure [bar]
0 1000 2000 3000 4000
0 1 2 3
Driving Torque [Nm]
Pump Speed [rpm]
Fig. 8 Actual performance of the researched vane
pump
To eliminate the error in evaluating the flow variation due to temperature and pressure changes, only the derivative of flow rate caused by these factors is used as in (21) to evaluate the flow rate loss.
( ) ( )
( ) ( ) ( )
4 1
8 1
eq
TP eq oil oil
R P t P t
Q t
L t t
π
η η
⎡Δ Δ − ⎤
Δ ≡ × ×⎢ − ⎥
⎢ − ⎥
⎣ ⎦
(21)
3.2.3 Power loss due to friction
In the ideal pump, the driving torque, τ ,
thwithout energy loss is derived by
(
max min)
2
th Dth
P P
τ
=π
−(22)
where D
this the theoretical displacement of the pump.
th Qth
D = n
(23)
Due to the friction problem, the actual pump driving torque is larger than the ideal torque an amount called friction torque τ
Δ:
(
max min)
act Qth
P P
τ τ
nΔ = − −
(24)
The friction factors are known as
• Friction between the vane tips and the ring inner contour
• Friction between the pump shaft and oil seals
• Friction between the pump shaft and bearings
• Friction between the ring, rotor and vanes with the pump cover
Among the friction factors mentioned above, only the friction between the vane tips and the ring inner contour is varied correspondingly to the variation of the working pressure and pump speed while the other friction factors can be considered to be constant values during the pump operation (see Fig. 9). The friction force, F
frv, between a generic vane and the ring inner contour is computed as
( )
(( ) ( ) ( )
)( )
_ _ _
cos /
frv i v cen i oil cen i uv oil i
r s i
F
α χ
Fα
Fα
Fα
α α
= ⎡⎣ + +
× Δ ⎤⎦
(25)
where
+ χ is kinetic frictional coefficient between the vane and ring in the lubrication condition.
+
Fv cen_( ) α , andi Foil cen_ ( ) α are the centrifugal i
forces of the vane i
th, and the oil chamber under this vane.
+
Fuv oil_( ) α is caused by the pressurized oil in the i
chamber under the considered vane:
( ) ( )
_
uv oil i i v
F
α
=Pα
× ×b t(26)
+
Δα
r s/( ) αi is the angle difference between the direction of forces
Fv cen_ ( ) αi ,Foil cen_ ( ) αi ,Fuv oil_ ( ) α i
and the direction perpendicular to the tangent of the ring at its contact point with the vane tip:
( ) αi ,Fuv oil_ ( ) α i
and the direction perpendicular to the tangent of the ring at its contact point with the vane tip:
and the direction perpendicular to the tangent of the ring at its contact point with the vane tip:
( ) ( ) ( )
r s/ i r i s i
α α α α α α
Δ = −
(27)
From (50), the friction torque between a generic vane and the ring inner contour can be calculated as
( ) ( )
cos /( )
frv i Ffrv i r s i i
τ α
=α
× Δα α
×ρ (28)
Hence, the total friction torque between the vanes and ring inner contour is given:
( )
1 N
frv frv i
i
τ τ α
=
=
∑ (29)
In other words, the pump flow rate lost due to this friction factor can be evaluated as
( )
max min2 frv Qfrv t n
P P
Δ =
πτ
−
(30)
Finally, the friction torque added to the driving torque of the pump is derived:
0 frv fr
τ τ τ
Δ = +
(31)
where τ is constant friction torque which is the
fr0sum of friction torques due to: friction between the
pump shaft and oil seals/ bearings, and friction
between the ring, rotor and vanes with the pump
cover. This factor is determined from the actual
performance of the pump.
M p
⊕ O
( )
r i
α α
( )
/
r s i
α α
ΔXs
/
α
r s⊕ω( )
iR m
( )
s i
α α
Fig. 9 Analysis of friction force between a generic vane and the ring inner contour
And the total pump flow rate lost due to all the friction factors is computed as
( ) ( )
0fric frv fr
Q t Q t Q
Δ = Δ + Δ
(32)
where
ΔQfr0is the lost flow corresponding to the constant friction torque τ .
fr03.2.4 Power loss due to incomplete filling effect The incomplete filling effect of pumping chambers with oil is normally as a function of excessive flow restriction in the flow path to the pump at a specific rotation speed.
The probability of this incomplete filling effect increases with higher rotational speed of the pump.
In the ideal working condition, the pumping chambers have enough time to fill their volumes before connecting to the delivering port, subsequently generating the pressurized oil as described in Section 2.2.2. On the contrary, in defective filling condition–at high working speeds, the large amount of fluid is proportionally passed through the feed ducts and intake valves of the system. For a constant fluid pressure at the pump intake, a certain critical speed exists where the amount of fluid required to fill the working chambers cannot enter to the pump at the intake.
Therefore by further increasing the speed above
this critical value, a proportional increase in pump delivery will not occur, or the pump flow rate may even decrease. This problem is remarkable when the pump works at high speed region.
/
α ⊕r s
ω
dϕ
Yr
Xr
Xs
1
ψs Rrot
αadd
Δ
Fig. 10 Pressure re‐distribution due to incomplete filling effect
In addition, when the working chambers connect with the delivering port, oil amounts from this port enter into the chamber vacancies. This undesirably entranced oil is called backflow of oil. It causes the pressure within each chamber to do not increase until the chamber becomes filled after an additional rotation of the rotor. The additional rotation angle is represented by
Δα
add. The pressure distribution analyzed in Section 2.2.2 and Fig. 3 was then adjusted as presented in Fig. 10.
Hence, the total moment acting on the ring caused by the pressurized oil inside the ring in (3) becomes:
( )
( ) ( )
2 _ _
3 2
3
3 3
0 min
2
ax
ax min 2 min
3 2
3 3
sin( )
sin( )
sin( )
;
C t p oil inside
H C t C t
L C t
C t C t
O rot st s s s
rot st s s s
rot st s m s s
s C t
m C t C t
H L
C t add C t add
M R P bR d
R f P bR d
R P bR d
f P P P P
α
α α
π α
ψ α α
ψ α α
ψ α α
α α
α α
α α α α α α
= +
+ +
+ +
⎡ − ⎤
=⎢ − + ⎥
⎣ − ⎦
= + Δ = − Δ
∑ ∫
∫
∫
(33)
Due to the pressure re‐distribution, it makes
the ring be easier to be rotated around the pivot in the direction that reduces the eccentricity between the rotor and the ring. In other words, the pump displacement is also reduced in this situation.
It can be point out that the incomplete filling effect cause a reduction,
, of the pump flow rate which may be proportional to the rotational speed. The higher working speed, the large value of the additional angle
Δα
addand the large amount of lost flow are obtained. Hence, to determine this pump flow reduction, the tendency of the additional angle
Δα
addis determined by using a comparison between the theoretical flow rate and the actual flow rate and iterative method.
From all the above analyses, an estimation of the actual pump flow rate can be established in (34).
est th leak TP fric fill
Q =Q + ΔQ + ΔQ − ΔQ − ΔQ
(34)
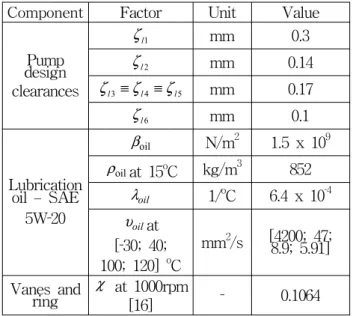
4. Estimation of actual pump performance using the complete model
In order to estimate the actual pump flow rate, simulations with the complete pump model based on the power loss analysis have been performed with the same testing conditions set for the experiments (Section 3.1). The parameters set for the complete model are displayed in Table 1.
Component Factor Unit Value
Pump design clearances
1
ζ
lmm 0.3
2
ζ
lmm 0.14
3 4 5
l l l
ζ
≡ζ
≡ζ mm 0.17
6
ζ
lmm 0.1
Lubrication oil – SAE
5W‐20
β
oilN/m
21.5 x 10
9ρ at 15
oil oC kg/m
3852
λ
oil1/
oC 6.4 x 10
‐4υ at
oil[‐30; 40;
100; 120]
oC
mm
2/s [4200; 47;
8.9; 5.91]
Vanes and
ring χ at 1000rpm
[16] ‐ 0.1064
By employing the power loss analysis presented above, the fitted curve of the additional angle caused by the incomplete filling effect was found as shown in Fig. 11 in a comparison with the set of this angle approximated using the linear interpolation. It can be seen that this angle was mostly varied proportionally with the pump speed.
As the result, the estimated and actual pump performances were obtained and compared as plotted in Fig. 12 while the power loss was analyzed in Fig. 13. As seen in Fig. 13, the power losses were remarkable, especially at high working speeds of the pump. Most of the lost energy was due to the friction and leakage problems. The results point out that the complete model not only could show the theoretical pump flow rate but also could analyze well most of the power loss factors then, consequently, brings to the accurate estimation of actual pump flow.
However, Fig. 11 points out that, the slope of the additional angle trajectory actually tended to be smaller values at higher pump speeds. It was due to the reduction of the pump eccentricity which, consequently, reduces the pump compression ratio as well as the cavitation and aeration levels. In addition, the other small power loss factors such as leakages caused by clearance variations due to temperature and/or surface finish condition changes, etc, were not considered in this study. As a result, the predicted pump performance
0 1000 2000 3000 4000
0 5 10 15 20 25 30
Additional Angle [deg]
Pump Speed [rpm]
Approximated Curve using Linear Interpolation Fitted Curve using Experimental Data
Fig. 11 Comparison of fitted and approximated
curves of the additional angle
0 10 20 30 40 50
0 2 4 6
Flow Rate [lpm]
Actual Flow Rate Estimated Flow Rate
Working Pressure [bar]
Actual Working Pressure Estimated Working Pressure
0 1000 2000 3000 4000
0 1 2 3
Driving Torque [Nm]
Pump Speed [rpm]
Actual Driving Torque Estimated Driving Torque
Fig. 12 Comparison of actual and estimated pump performances
0 1 2 3
0 8 16
0 1000 2000 3000 4000
0 10 20 30
Flow Loss [lpm]
Flow Loss due to Incomplete Filling Effect
Flow Loss [lpm]
Flow Loss due to Friction
0.00 0.07 0.14
Flow Variation [lpm]
Flow Variation due to Temperature-Pressure Change
Flow Loss [lpm]
Pump Speed [rpm]
Flow Loss due to Leakages
![Fig. 12 Comparison of actual and estimated pump performances 0123 0816 0 1000 2000 3000 40000102030Flow Loss [lpm]](https://thumb-ap.123doks.com/thumbv2/123dokinfo/5532407.463546/10.892.84.433.96.860/fig-comparison-actual-estimated-pump-performances-flow-loss.webp)
