• 검색 결과가 없습니다.

Positive Effects of the National Cigarette Price Increase Policy on Smoking Cessation in South Korea

N/A
N/A
Protected

Academic year: 2021

Share "Positive Effects of the National Cigarette Price Increase Policy on Smoking Cessation in South Korea"

Copied!
10
0
0

로드 중.... (전체 텍스트 보기)

전체 글

(1)

Introduction

Consistent with the global trend and based on inflation, South Korea has gradually increased its cigarette tax by 10%–

30% in an attempt to reduce the smoking rate

1

. However, even with these increases, the price of cigarettes in South Korea was still low, and the prevalence of smoking was high compared to other Organisation for Economic Co-operation and Devel- opment countries

2

. Moreover, the price of cigarettes in South Korea had not increased in 10 years from 2004 to 2014

3

. From 2008 to 2011, the smoking rate among male South Koreans did not vary very much, reduce from 47.7% to 47.3%, slightly decreased to 43.7% in 2012, and to 42.1% in 2013

4

. In January 2015, the government abruptly increased the cigarette tax, and the retail price of cigarettes increased by 80% compared to the previous year (Figure 1A). In addition, smoke-free areas

Positive Effects of the National Cigarette Price Increase Policy on Smoking Cessation in South Korea

Do Sun Kwon, M.D. 1 , Tae Hee Kim, M.D. 1 , Min Kwang Byun, M.D., Ph.D. 1 , Hyung Jung Kim, M.D., Ph.D. 1 , Hye Sun Lee, Ph.D. 2 , Hye Jung Park, M.D., Ph.D. 1 and Korean Smoking Cessation Study Group

1

Department of Internal Medicine, Gangnam Severance Hospital, Seoul,

2

Biostatistics Collaboration Unit, Yonsei University College of Medicine, Seoul, Korea

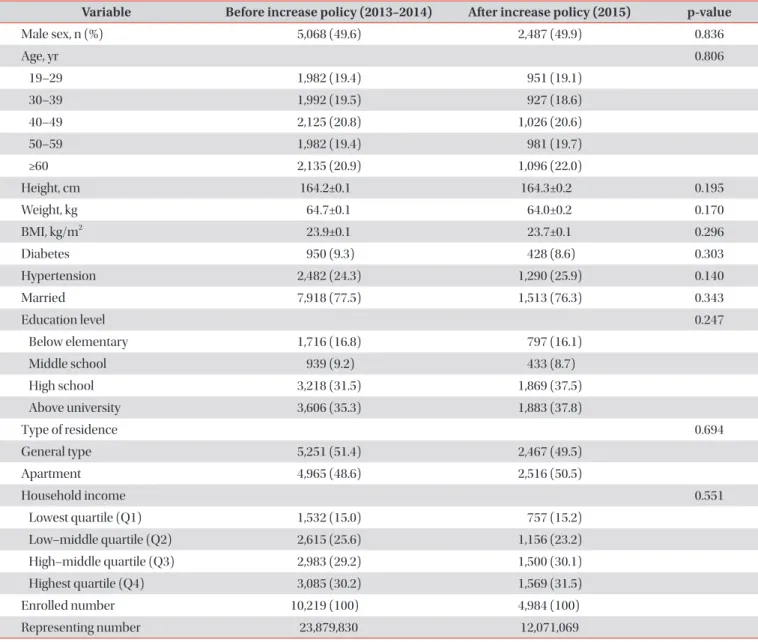
Background: In January 2015, South Korea’s government raised the cigarette tax, and the retail price of cigarettes abruptly increased by 80% compared to the previous year. This research aimed to determine the effect of this increase on smoking cessation among South Korean smokers.

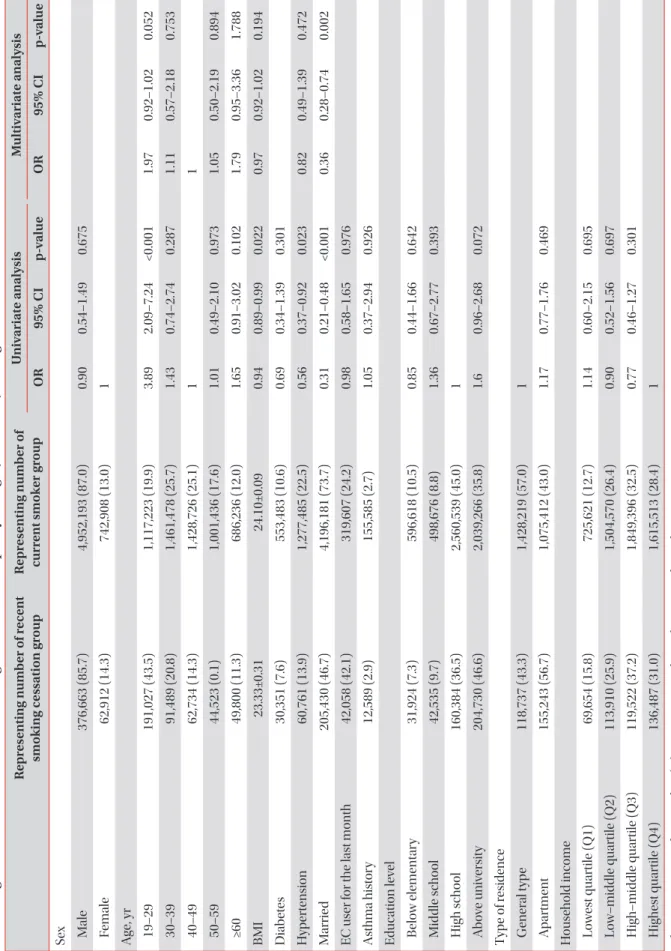
Methods: We analyzed data collected by the 2013–2015 South Korea National Health and Nutrition Examination Survey of 15,203 South Koreans over 19 years old using regression analysis. We examined the recent non-smoking period of nonsmoking people, prepared according to the survey, and analyzed the recent smoking cessation ratio.

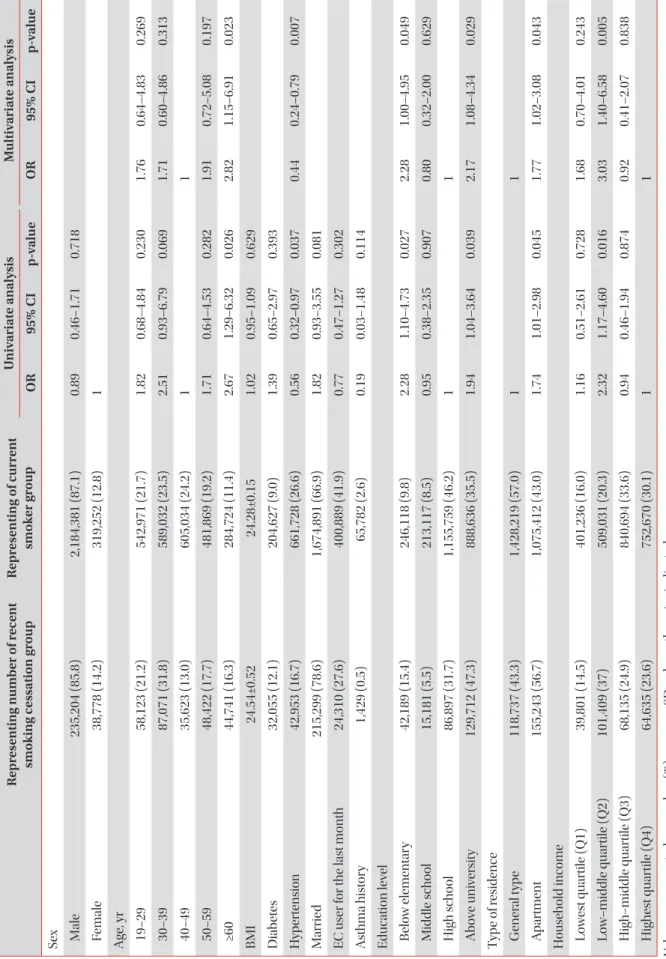
Results: Among smokers, from 2013 to 2014, the smoking cessation rate was 7.2%, and it increased to 9.9% in 2015 after the increase in the cigarette tax. In 2015, the recent smoking cessation rate was higher among people over the age of 60 (odds ratio [OR], 2.67) compared to those between the ages of 40 and 49. The recent smoking cessation rate was higher among people with below elementary education (OR, 2.28) and above university education (OR, 1.94) compared to high school, higher for those with apartments (OR, 1.74) compared to general type residences, and higher among those with a household income in the low-middle quartile (Q2) (OR, 2.32) compared to the highest quartile (Q4).

Conclusion: This innovative policy including increase in cigarette prices affected smoking cessation, and its impact varied by sub-group of smokers in South Korea.

Keywords: Cigarette Price; South Korea; Smoking; Policy

Address for correspondence: Hye Jung Park, M.D., Ph.D.

Department of Internal Medicine, Gangnam Severance Hospital, Yonsei University College of Medicine, 211 Eonju-ro, Gangnam-gu, Seoul 06273, Korea

Phone: 82-2-2019-3302, Fax: 82-2-3463-3882 E-mail: [email protected]

Received: Feb. 11, 2019 Revised: Jun. 10, 2019 Accepted: Aug. 30, 2019 Published online: Nov. 7, 2019

cc

It is identical to the Creative Commons Attribution Non-Commercial License (http://creativecommons.org/licenses/by-nc/4.0/).

Copyright © 2020

The Korean Academy of Tuberculosis and Respiratory Diseases.

(2)

were expanded from public places to indoor areas, including worksites, restaurants, coffee shops, and bars. Although previ- ous studies have examined the effects of national policy on smoking prevalence

5

, there has been no study on the signifi- cant effects of the recent policy, which increased the price of cigarettes by 80% in January 2015, on smoking cessation.

The South Korea National Health and Nutrition Examina- tion Survey (KNHANES) is a large-scale annual survey con- ducted systemically by the South Korea Centers for Disease Control and Prevention (KCDC). The data in the KNHANES represents the entire general population of South Korea

6

. The KNHANES survey includes various questionnaires that con- tain demographics and clinical manifestations. In addition, detailed questionnaires concerning smoking habits are in- cluded, especially in the 2013–2015 surveys. Thus, KNHANES data will be useful for confirming any significant changes in the smoking habits of South Korean smokers before and after the implementation of the new policy.

The goal of this study was to determine the effects of the in- novative policy including the increase in tobacco prices and expansion of smoke-free areas on cigarette smoking cessa- tion among South Korean smokers, and which sub-groups of smokers more readily responded to the new policy.

Materials and Methods

1. Participants

We used data from the KNHANES, a national survey per- formed in 2013–2015. The survey used complex probability

procedures to provide a sample representative of the South Korean general population, with stratification and multiple stages of cluster selection using age, sex, residence type, edu- cation level, and other variables. We followed the guidelines for reporting sample weight (sampling weights) and stratifica- tion as indicated by the KCDC; this information is available on the KNHANES website (http://knhanes.cdc.go.kr).

Among 20,482 subjects surveyed in 2013–2015, a total of 15,203 subjects ≥19 years of age responded to the health sur- vey, including a questionnaire concerning smoking habits.

Using regression analysis, 3,086 subjects who were current smokers and who had smoked more than 100 cigarettes in their lifetime or who had stopped smoking within the past six months were examined to detect the significant factors for recent smoking cessation. Recent smoking cessation was de- fined as having stopped smoking within the past six months:

they answered, “I smoked cigarettes in the past but do not smoke now” to a question asking “Current smoking status,”

and gave a variable period less than 6 months to a question asking “Non-smoking period.” The recent smoking cessation rate (%) was calculated as follows: subjects with recent smok- ing cessation×100 (%)/total enrolled subjects (current smoker and ever smoker including subjects with recent smoking cessation). This retrospective study was approved by the In- stitutional Review Board (IRB) of Yongin Severance Hospital (No. 3-2017-0020). The requirement of informed consent was waived considering the retrospective nature of this study.

2. Definition of variables

All data were collected by self-reported questionnaires, Figure 1. Effects of abrupt cigarette price increase on recent smoking cessation rate in Korea. (A) The price change for one pack of cigarettes from 1989 to 2015 in Korea. (B) Habit changes after cigarette price increase. (C) Changes in recent smoking cessation rates before (2013–2014) and after (2015) cigarette price increase. *p<0.05 signifies changes in recent smoking cessation rates according to year.

5,000

4,000

3,000

2,000

1,000

Cost of one pack of cigarette (won)

Year 0

1990 1995 2000 2005 2010 2015

58%

32%

2% 8%

Quit Decrease No change Increase

A B

2013 2014 12

10 8 6 4

2

Recent smoking cessation rate (%)

0

2015

*

C

(3)

including diabetes status, hypertension status, marital sta- tus, education level, residence type, and household income.

Household income was determined based on each subject’s self-reported monthly household income in South Korea.

Income level was categorized into four quartiles. Body mass index (BMI; measured as body weight divided by the square of the body weight, and expressed in units of kg/m

2

) was mea- sured by the healthcare provider.

3. Statistical analysis

We used KNHANES stratification variables and sampling weights. Differences in categorized variables and continuous

variables from before and after the policy change were ana- lyzed by chi-square tests and t-tests, respectively. Univariate and multivariate logistic regression analyses were conducted to identify factors associated with recent smoking cessation.

The interaction odds ratio (OR) value refers to the relative size of the OR value after the increase of cigarette tax in prepa- ration for a before-tax change. This was used to determine if there were significant differences in the critical factors; that is, if the interaction OR value is greater than 1, it is a positive ef- fect that relatively increases the smoking cessation rate, and if it is smaller than 1, it has a negative effect that has a relatively lower smoking cessation rate.

Table 1. Clinical characteristics of total enrolled subjects before and after policy change

Variable Before increase policy (2013–2014) After increase policy (2015) p-value

Male sex, n (%) 5,068 (49.6) 2,487 (49.9) 0.836

Age, yr 0.806

19–29 1,982 (19.4) 951 (19.1)

30–39 1,992 (19.5) 927 (18.6)

40–49 2,125 (20.8) 1,026 (20.6)

50–59 1,982 (19.4) 981 (19.7)

≥60 2,135 (20.9) 1,096 (22.0)

Height, cm 164.2±0.1 164.3±0.2 0.195

Weight, kg 64.7±0.1 64.0±0.2 0.170

BMI, kg/m

2

23.9±0.1 23.7±0.1 0.296

Diabetes 950 (9.3) 428 (8.6) 0.303

Hypertension 2,482 (24.3) 1,290 (25.9) 0.140

Married 7,918 (77.5) 1,513 (76.3) 0.343

Education level 0.247

Below elementary 1,716 (16.8) 797 (16.1)

Middle school 939 (9.2) 433 (8.7)

High school 3,218 (31.5) 1,869 (37.5)

Above university 3,606 (35.3) 1,883 (37.8)

Type of residence 0.694

General type 5,251 (51.4) 2,467 (49.5)

Apartment 4,965 (48.6) 2,516 (50.5)

Household income 0.551

Lowest quartile (Q1) 1,532 (15.0) 757 (15.2)

Low–middle quartile (Q2) 2,615 (25.6) 1,156 (23.2)

High–middle quartile (Q3) 2,983 (29.2) 1,500 (30.1)

Highest quartile (Q4) 3,085 (30.2) 1,569 (31.5)

Enrolled number 10,219 (100) 4,984 (100)

Representing number 23,879,830 12,071,069

Values are presented as percentage or mean±SD unless otherwise indicated.

(4)

Results

1. Clinical characteristics of enrolled subjects before and after the policy change

We enrolled 10,219 subjects (representing a population of 23,879,830) and 4,984 subjects (representing a population of 12,071,069) in 2013–2014 (before the policy change) and in 2015 (after the policy change), respectively. Subjects from be- fore and after the price increase policy were not significantly different in clinical characteristics, including sex, age, height, weight, BMI, diabetes, hypertension, marital status, education level, type of residence, and household income (Table 1).

2. Effects of policy change on smoking cessation and smoking habits

We analyzed data of 3,086 smokers to define the effects of policy change on smokers. Cigarette prices had not changed for ten years before the announcement of the new policy;

however, in January 2015, the government abruptly increased the price of cigarettes (Figure 1A). There was a question in KNHANES on the impact of an 80% increase in cigarette prices in 2015. Some smokers commented that because of the new policy they had stopped (7.5%) or reduced (32.1%) their cigarette smoking (Figure 1B). A smoking cessation period in the past was investigated in the 6th KNHANES (2013–2015), and this illustrated that before the policy change, the recent smoking cessation rate was 7.2% from 2013 to 2014. Com- pared to 2013–2014, however, it significantly increased to 9.9%

in 2015, after the policy change (p=0.047) (Figure 1C).

3. Significant factors for recent smoking cessation before the policy change among smokers

We defined the significant factors for subjects who recently stopped smoking within the past six months (recent smoking cessation) among 3,086 smokers. In the univariate analysis, age, BMI, hypertension, and marital status were significant fac- tors contributing to recent smoking cessation before the new policy. The multivariate analysis illustrated that marital status was a significant factor for recent smoking cessation (OR, 0.36;

95% confidence interval [CI], 0.28–0.74; p=0.002) (Table 2).

4. Significant factors for recent smoking cessation after the policy change among smokers

In the univariate analysis, age, hypertension, education level, residence type, and household income were significant factors for recent smoking cessation after the policy change.

The multivariate analysis illustrated that the significant factors for recent smoking cessation were: subjects ≥60 years old (OR, 2.82; 95% CI, 1.15–6.91; p=0.023) compared to those 40–49

years old; education levels of below elementary (OR, 2.28; 95%

CI, 1.00–4.95; p=0.049) and above university (OR, 2.17; 95%

CI, 1.08–4.34; p=0.029) compared to high school education;

and subjects living in apartment residences (OR, 1.77; 95% CI, 1.02–3.08; p=0.043) compared to general type residences. In addition, subjects with low-middle quartile (Q2) household income were more likely to stop smoking compared to sub- jects with the highest quartile household income (OR, 3.03;

95% CI, 1.40–6.58; p=0.005). Although there is no significant difference, subjects with the lowest quartile (Q1) household income were more likely to stop smoking than subjects with the highest quartile (Q4) household income (OR, 1.68; 95% CI, 0.70–4.01, p=0.243) (Table 3).

5. Significant factors for recent smoking cessation after policy change compared to those before the policy change

We obtained the interaction OR and p-values to determine whether there is a significant gap between factors before and after the policy change. Subjects between 19 and 29 years of age were more likely to stop smoking compared to those between 40 and 49 before the policy change (OR, 3.89). After the policy went into effect, the recent smoking cessation rate was still higher for people aged between 19 and 29 years of age (OR, 1.82), but it is decreasing. (interaction OR, 0.48; in- teraction p=0.197). However, in women, compared to men, the smoking rate increased (OR, 6.05) after the price increase (Supplementary Tables S1, 2). Married subjects were less likely to stop smoking compared to unmarried subjects before the policy change (OR, 0.31), whereas after the policy went into effect, married subjects were significantly more likely to stop smoking (OR, 1.82). When comparing men and women separately, the recent smoking cessation rate in men’s groups has increased (OR, 1.82) (Supplementary Tables S3, 4). There was also a significant difference between the likelihood before and after the policy was implemented (interaction OR, 5.79;

p<0.001). After the policy change, for the subjects with below elementary school education, there was a statistically increas- ing trend compared to before the policy change (interaction OR, 2.67; p=0.051). Subjects with low-middle quartile (Q2) household incomes were more likely to stop smoking com- pared to subjects with the highest quartile (Q4) household income (OR, 2.32) compared to before the policy change (OR, 0.90) (interaction OR, 2.59; p=0.034) (Table 4).

Discussion

We found that the innovative policy change by the South

Korean government was successful in encouraging smokers

to stop smoking. The stop smoking rate was 7.2% before the

policy change but significantly increased to 9.9% per year after

(5)

Ta ble 2. S ig nific an t f act ors for r ec en t sm ok in g c es sa tion b efor e p ol ic y ch an ge (2013–2014) am on g sm ok er R epr es en tin g n um ber of r ec en t sm ok in g c es sa tion gr oup R epr es en tin g n um b er of cur ren t sm ok er gr oup U niv ar ia te an al ysis M ultiv ar ia te an al ysis OR 95% CI p- valu e OR 95% CI p- valu e Se x M ale 376,663 (85.7) 4,952,193 (87.0) 0.90 0.54–1.49 0.675 F emale 62,912 (14.3) 742,908 (13.0) 1 Ag e, yr 19–29 191,027 (43.5) 1,117,223 (19.9) 3.89 2.09–7.24 <0.001 1.97 0.92–1.02 0.052 30–39 91,489 (20.8) 1,461,478 (25.7) 1.43 0.74–2.74 0.287 1.11 0.57–2.18 0.753 40–49 62,734 (14.3) 1,428,726 (25.1) 1 1 50–59 44,523 (0.1) 1,001,436 (17.6) 1.01 0.49–2.10 0.973 1.05 0.50–2.19 0.894 ≥60 49,800 (11.3) 686,236 (12.0) 1.65 0.91–3.02 0.102 1.79 0.95–3.36 1.788 BMI 23.33±0.31 24.10±0.09 0.94 0.89–0.99 0.022 0.97 0.92–1.02 0.194 D iab ete s 30,351 (7.6) 553,483 (10.6) 0.69 0.34–1.39 0.301 H yp ert ens ion 60,761 (13.9) 1,277,485 (22.5) 0.56 0.37–0.92 0.023 0.82 0.49–1.39 0.472 M arrie d 205,430 (46.7) 4,196,181 (73.7) 0.31 0.21–0.48 <0.001 0.36 0.28–0.74 0.002 EC user for the l as t month 42,058 (42.1) 319,607 (24.2) 0.98 0.58–1.65 0.976 As thma his tor y 12,589 (2.9) 155,585 (2.7) 1.05 0.37–2.94 0.926 Educ ation le vel B elow elementar y 31,924 (7.3) 596,618 (10.5) 0.85 0.44–1.66 0.642 Middle sc ho ol 42,535 (9.7) 498,676 (8.8) 1.36 0.67–2.77 0.393 High sc ho ol 160,384 (36.5) 2,560,539 (45.0) 1 Ab ove univer sit y 204,730 (46.6) 2,039,266 (35.8) 1.6 0.96–2.68 0.072 T yp e of r es idence G ener al t yp e 118,737 (43.3) 1,428,219 (57.0) 1 A partment 155,243 (56.7) 1,075,412 (43.0) 1.17 0.77–1.76 0.469 H ouse hold income Lowes t quartile (Q1) 69,654 (15.8) 725,621 (12.7) 1.14 0.60–2.15 0.695 Low–middle quartile (Q2) 113,910 (25.9) 1,504,570 (26.4) 0.90 0.52–1.56 0.697 High–middle quartile (Q3) 119,522 (37.2) 1,849,396 (32.5) 0.77 0.46–1.27 0.301 Highes t quartile (Q4) 136,487 (31.0) 1,615,513 (28.4) 1 V alues ar e pr esent ed as num ber (%) or me an±S D unles s other wise indic at ed. OR : o dds r atio; CI: confidence int er val; BMI: b od y mas s index ; S D: s tand ar d de vi ation.

(6)

Ta ble 3. S ig nific an t f act ors for r ec en t sm ok in g c es sa tion af ter p ol ic y ch an ge (2015) am on g sm ok er R epr es en tin g n um ber of r ec en t sm ok in g c es sa tion gr oup R epr es en tin g of cur ren t sm ok er gr oup U niv ar ia te an al ysis M ultiv ar ia te an al ysis OR 95% CI p- valu e OR 95% CI p- valu e Se x M ale 235,204 (85.8) 2,184,381 (87.1) 0.89 0.46–1.71 0.718 F emale 38,778 (14.2) 319,252 (12.8) 1 Ag e, yr 19–29 58,123 (21.2) 542,971 (21.7) 1.82 0.68–4.84 0.230 1.76 0.64–4.83 0.269 30–39 87,071 (31.8) 589,032 (23.5) 2.51 0.93–6.79 0.069 1.71 0.60–4.86 0.313 40–49 35,623 (13.0) 605,034 (24.2) 1 1 50–59 48,422 (17.7) 481,869 (19.2) 1.71 0.64–4.53 0.282 1.91 0.72–5.08 0.197 ≥60 44,741 (16.3) 284,724 (11.4) 2.67 1.29–6.32 0.026 2.82 1.15–6.91 0.023 BMI 24.54±0.52 24.28±0.15 1.02 0.95–1.09 0.629 D iab ete s 32,055 (12.1) 204,627 (9.0) 1.39 0.65–2.97 0.393 H yp ert ens ion 42,953 (16.7) 661,728 (26.6) 0.56 0.32–0.97 0.037 0.44 0.24–0.79 0.007 M arrie d 215,299 (78.6) 1,674,891 (66.9) 1.82 0.93–3.55 0.081 EC user for the l as t month 24,310 (27.6) 400,889 (41.9) 0.77 0.47–1.27 0.302 As thma his tor y 1,429 (0.5) 65,782 (2.6) 0.19 0.03–1.48 0.114 Educ ation le vel B elow elementar y 42,189 (15.4) 246,118 (9.8) 2.28 1.10–4.73 0.027 2.28 1.00–4.95 0.049 Middle sc ho ol 15,181 (5.5) 213,117 (8.5) 0.95 0.38–2.35 0.907 0.80 0.32–2.00 0.629 High sc ho ol 86,897 (31.7) 1,155,759 (46.2) 1 1 Ab ove univer sit y 129,712 (47.3) 888,636 (35.5) 1.94 1.04–3.64 0.039 2.17 1.08–4.34 0.029 T yp e of r es idence G ener al t yp e 118,737 (43.3) 1,428,219 (57.0) 1 1 A partment 155,243 (56.7) 1,075,412 (43.0) 1.74 1.01–2.98 0.045 1.77 1.02–3.08 0.043 H ouse hold income Lowes t quartile (Q1) 39,801 (14.5) 401,236 (16.0) 1.16 0.51–2.61 0.728 1.68 0.70–4.01 0.243 Low–middle quartile (Q2) 101,409 (37) 509,031 (20.3) 2.32 1.17–4.60 0.016 3.03 1.40–6.58 0.005 High–middle quartile (Q3) 68,135 (24.9) 840,694 (33.6) 0.94 0.46–1.94 0.874 0.92 0.41–2.07 0.838 Highes t quartile (Q4) 64,635 (23.6) 752,670 (30.1) 1 1 V alues ar e pr esent ed as num ber (%) or me an±S D unles s other wise indic at ed. OR : o dds r atio; CI: confidence int er val; BMI: b od y mas s index ; EC : ele ctr onic cig ar et te; S D: s tand ar d de vi ation.

(7)

the policy change (an increase of 27.3%). In addition, many smokers (39.6%) commented that they had stopped or re- duced smoking because of the 2015 policy.

Cigarette price increase policies have been considered as one of the most effective strategies for smoking cessation

7-9

. Many countries have adopted a cigarette price increase policy and obtained significant effects on the number of individuals who stop smoking

1,10,11

. In South Korea, cigarette prices were relatively low and had not significantly increased beyond the inflation rate in recent periods. The South Korean government decided to increase the cigarette tax suddenly, and the final price of a packet of cigarettes increased from $2.09 in 2014 to

$3.76 in 2015. We demonstrated that this dramatic increase in cigarette prices positively affected the cessation of cigarette

smoking in South Korean smokers.

Smoking rates are higher in subjects with lower socioeco- nomic status. In South Korea, subjects with lower household income are 1.3–2.3 times more likely to smoke cigarettes, compared to subjects with the highest household income

12

. Smokers with a lower socioeconomic status are the main tar- gets for antismoking policies, as many studies have reported that a cigarette price increase policy is more effective on sub- jects with low socioeconomic status

13,14

. We also illustrated that subjects with low household income are more likely to stop cigarette smoking after the implementation of a cigarette price increase policy. Subjects in the low-middle quartile (Q2) of household income were significantly more likely to stop smoking because of the price increase compared to subjects Table 4. Significant factors for recent smoking cessation after policy change, compared to before policy change among smoker

Before increase policy After increase policy Interaction

OR p-value OR p-value OR* p-value

Male sex 0.90 0.675 0.89 0.718 0.987 0.975

Age, yr

19–29 3.89 <0.001 1.82 0.230 0.48 0.197

30–39 1.43 0.287 2.51 0.069 1.76 0.351

40–49 1 1 1

50–59 1.01 0.973 1.71 0.282 1.69 0.397

≥60 1.65 0.102 2.67 0.026 1.62 0.370

BMI 0.94 0.022 1.02 0.629 1.09 0.073

Diabetes 0.69 0.301 1.39 0.393 2.01 0.181

Hypertension 0.56 0.023 0.56 0.037 1 0.994

Married 0.31 <0.001 1.82 0.081 5.79 <0.001

Education level

Below elementary 0.85 0.642 2.28 0.027 2.67 0.051

Middle school 1.36 0.393 0.95 0.907 0.7 0.538

High school 1 1 1

Above university 1.6 0.072 1.94 0.039 1.21 0.642

Type of residence

General type 1 1

Apartment 1.17 0.469 1.74 0.045 1.49 0.252

Household income

Lowest quartile (Q1) 1.14 0.695 1.16 0.728 1.02 0.975

Low–middle quartile (Q2) 0.9 0.697 2.32 0.016 2.59 0.034

High–middle quartile (Q3) 0.77 0.301 0.94 0.874 1.23 0.638

Highest quartile (Q4) 1 1 1

*Ratio of OR after policy changes: if OR >1, it has a positive effect that relatively increases the smoking cessation rate; and if OR <1, it has a negative effect that has a relatively lower smoking cessation rate.

Interaction p-value <0.2 signifies changes in recent smoking cessation rates compared to before policy change.

OR: odds ratio; BMI: body mass index.

(8)

in the highest quartile (Q4) of household income (interac- tion p=0.034). Although we could not demonstrate that this positive effect is stronger with a serial decrease in household income, we can assume that subjects with low household in- comes tend to be more responsive to a price increase policy.

Although a low socioeconomic level is a well-known sus- ceptibility factor for smoking cessation because of an increase in cigarette prices, higher BMI, diabetes, education level, and marital status are not well-known factors. Previous studies abroad have reported that young adults more easily respond to cigarette price increase policies

15,16

. We demonstrated that the smoking cessation rate was high in subjects aged between 19 and 29, but they are less susceptible to an increase policy.

This different result may be due in part to the fact that we excluded adolescents (those under the age of 19). In addi- tion, the South Korean culture’s devotion to children, even if it requires a parent’s own sacrifice, might support this result;

grandparents may give up smoking instead of their grandchild.

People with diabetes want to stay healthy, and the smoking cessation rate has gone up. Married individuals may feel a stronger responsibility to stop smoking compared to those who are unmarried. This may lead a married person to stop smoking after the cigarette price increase policy. Furthermore, we compared the recent smoking cessation rate between men and women. In women, the smoking cessation OR value of 19 to 29 years old has risen from 2.97 to 6.05 after policy changes.

In married women, the recent smoking cessation OR value has decreased from 11.62 to 1.51, and in groups that are above university level education, OR values decreased from 0.28 to 0.2. However, they did not affect when compared with the overall smoking cessation rate. This suggests that the overall smoking cessation rate has changed depending on the influ- ence of men because they make up the majority of smokers (Supplementary Tables S1–4).

There are several ways to stop smoking. Electronic ciga- rettes (EC) are considered as one of the ways to stop smoking.

In one review article, EC helped people to stop smoking for 6 to 12 months compared to a placebo (4% vs. EC 9%), but the result is rated ‘low’ by GRADE standards

17

. The smoking ces- sation effect of EC remains inconclusive and more research is under way

17

. This paper shows EC users’ recent smoking ces- sation rate was low before and after the price increase, but it was not statistically significant (Tables 2, 3).

The policy to expand smoke-free areas was implemented to reduce exposure to second-hand smoke. Previous studies have revealed the positive effects of smoke-free area policy on smoking rate and health

18,19

. Expansion of smoke-free areas also might attribute to the reduction in smokers. However, we think that the price increase policy has more powerful effects on smoking cessation compared to the expansion of smoke- free areas. This was because the difference in the price before and after the policy change was large.

We are well aware that smoking is a significant risk factor for

important diseases, including lung cancer and asthma

20-23

. It is even more harmful to pregnant women and children, and second-hand smoke is also dangerous

24-26

. Tobacco control policies established by governments affect not only smoking cessation but also smoking-related diseases and mortality

27-29

. Although we did not perform an analysis, we can expect that smoke-related diseases, associated admissions, and mortality might be improved after policy changes. Further studies using large-scale national data will help examine the accuracy of this expectation.

The KNHANES data are obtained from a well-designed national program with complex, multi-stage probability sample extraction. We also used a complex sample analysis, recommended by KNHANES; therefore, this data represents 46,946,471 South Koreans, which is close to the total popula- tion of South Korea

30

. The innovative cigarette policy was implemented nationwide, and subsequently, national data is necessary to determine the effects of this new policy. This means that the hypotheses in this research can best be con- firmed using KNHANES data.

The study has some limitations. First, this is a cross-section- al observational study, not a longitudinal cohort study. There- fore, analysis of the smoking cessation rate was conducted us- ing different populations in 2013, 2014, and 2015. As a result, we should be careful in interpreting the results of this study.

Second, we used an operational definition of recent smoking cessation. This measurement of recent smoking cessation may not fully reflect the real recent smoking cessation caused by the policy change. Third, we could not analyze the poten- tial variables that affect smoking cessation, including the se- verity of underlying respiratory disease and lung function, and distances between homes and cigarette stores

31,32

. The avail- able variables are limited because the data was not collected by the authors, but by KCDC. Fourth, this is a questionnaire- based study; therefore, recall bias cannot be excluded. Last, this paper looked at the variables in consideration of the basic sociological variables other than lifestyle and failed to reflect lifestyle indicators such as drinking and exercise that could change. We will be able to follow up on this in future research.

In conclusion, using a large amount of national scale data, this study confirmed that an innovative policy change posi- tively affected smoking cessation of current smokers in South Korea. In addition, this positive effect was more pronounced in people who were married and people with a high BMI, dia- betes, below elementary education level, and with low house- hold incomes.

Many countries have adopted cigarette price increase poli- cies, and these have had a significant impact on the number of individuals who have stopped smoking. This is the first study to determine the positive effects of the national cigarette price increase policy conducted by South Korea’s government.

The retail price of cigarettes abruptly increased by 80% com-

pared to the previous year, and this increased the number of

(9)

people who stopped smoking. This positive effect was more pronounced in people who are ≥60 years of age, married, and with low household incomes. The findings suggest that this in- novative cigarette increase policy should be maintained over the long term to retain this positive effect on the cessation of cigarette smoking in South Korea.

Authors’ Contributions

Conceptualization: Park HJ. Methodology: Kwon DS. Formal analysis: Lee HS. Data curation: Lee HS. Validation: Lee HS. In- vestigation: Kim TH, Byun MK, Kim HJ. Writing - original draft preparation: Kwon DS. Writing - review and editing: Park HJ.

Approval of final manuscript: all authors.

Conflicts of Interest

No potential conflict of interest relevant to this article was reported.

Funding

No funding to declare.

References

1. Chelwa G, van Walbeek C, Blecher E. Evaluating South Afri- ca’s tobacco control policy using a synthetic control method.

Tob Control 2016;26:509-17.

2. Organization for Economic Co-operation and Development.

OECD Factbook 2013. Paris: OECD; 2013.

3. Kang E. Assessing health impacts of pictorial health warn- ing labels on cigarette packs in Korea using DYNAMO-HIA. J Prev Med Public Health 2017;50:251-61.

4. Choi S, Kim Y, Park S, Lee J, Oh K. Trends in cigarette smok- ing among adolescents and adults in South Korea. Epidemiol Health 2014;36:e2014023.

5. Levy DT, Cho SI, Kim YM, Park S, Suh MK, Kam S. SimSmoke model evaluation of the effect of tobacco control policies in Korea: the unknown success story. Am J Public Health 2010;

100:1267-73.

6. Kim Y. The Korea National Health and Nutrition Examination Survey (KNHANES): current status and challenges. Epide- miol Health 2014;36:e2014002.

7. Warner KE. Death and taxes: using the latter to reduce the former. Tob Control 2014;23 Suppl 1:i4-6.

8. Chaloupka FJ, Yurekli A, Fong GT. Tobacco taxes as a tobacco control strategy. Tob Control 2012;21:172-80.

9. Guindon GE, Paraje GR, Chaloupka FJ. The impact of prices

and taxes on the use of tobacco products in Latin America and the Caribbean. Am J Public Health 2015;105:e9-19.

10. Bader P, Boisclair D, Ferrence R. Effects of tobacco taxation and pricing on smoking behavior in high risk populations:

a knowledge synthesis. Int J Environ Res Public Health 2011;8:4118-39.

11. Guindon GE. The impact of tobacco prices on smoking onset:

a methodological review. Tob Control 2014;23:e5.

12. Yun WJ, Rhee JA, Kim SA, Kweon SS, Lee YH, Ryu SY, et al.

Household and area income levels are associated with smok- ing status in the Korean adult population. BMC Public Health 2015;15:39.

13. Brown T, Platt S, Amos A. Equity impact of population-level interventions and policies to reduce smoking in adults: a sys- tematic review. Drug Alcohol Depend 2014;138:7-16.

14. Siahpush M, Wakefield MA, Spittal MJ, Durkin SJ, Scollo MM.

Taxation reduces social disparities in adult smoking preva- lence. Am J Prev Med 2009;36:285-91.

15. Tramacere I, Gallus S, Pacifici R, Zuccaro P, Colombo P, La Vecchia C. Smoking in young and adult population, Italy 2009. Tumori 2011;97:423-7.

16. Gigliotti A, Figueiredo VC, Madruga CS, Marques AC, Pinsky I, Caetano R, et al. How smokers may react to cigarette taxes and price increases in Brazil: data from a national survey.

BMC Public Health 2014;14:327.

17. Hartmann-Boyce J, McRobbie H, Bullen C, Begh R, Stead LF, Hajek P. Electronic cigarettes for smoking cessation. Co- chrane Database Syst Rev 2016;9:CD010216.

18. Marchese ME, Shamo F, Miller CE, Wahl RL, Li Y. Racial dis- parities in asthma hospitalizations following implementation of the smoke-free air law, Michigan, 2002-2012. Prev Chronic Dis 2015;12:E201.

19. Dove MS, Dockery DW, Mittleman MA, Schwartz J, Sullivan EM, Keithly L, et al. The impact of Massachusetts’ smoke-free workplace laws on acute myocardial infarction deaths. Am J Public Health 2010;100:2206-12.

20. Lortet-Tieulent J, Goding Sauer A, Siegel RL, Miller KD, Islami F, Fedewa SA, et al. State-Level Cancer Mortality Attributable to Cigarette Smoking in the United States. JAMA Intern Med 2016;176:1792-8.

21. Ordonez-Mena JM, Schottker B, Mons U, Jenab M, Freisling H, Bueno-de-Mesquita B, et al. Quantification of the smoking- associated cancer risk with rate advancement periods: meta- analysis of individual participant data from cohorts of the CHANCES consortium. BMC Med 2016;14:62.

22. Haddad L, Kelly DL, Weglicki LS, Barnett TE, Ferrell AV, Ghadban R. A systematic review of effects of waterpipe smok- ing on cardiovascular and respiratory health outcomes. Tob Use Insights 2016;9:13-28.

23. Lee CH, Lee KH, Jang AH, Yoo CG. The impact of autophagy on the cigarette smoke extract-induced apoptosis of bron- chial epithelial cells. Tuberc Respir Dis 2017;80:83-9.

24. Vardavas CI, Hohmann C, Patelarou E, Martinez D, Hender-

(10)

son AJ, Granell R, et al. The independent role of prenatal and postnatal exposure to active and passive smoking on the de- velopment of early wheeze in children. Eur Respir J 2016;48:

115-24.

25. Spindel ER, McEvoy CT. The role of nicotine in the effects of maternal smoking during pregnancy on lung development and childhood respiratory disease. implications for dangers of E-cigarettes. Am J Respir Crit Care Med 2016;193:486-94.

26. Chen VC, Kuo CJ, Wang TN, Lee WC, Chen WJ, Ferri CP, et al. Suicide and other-cause mortality after early exposure to smoking and second hand smoking: a 12-year population- based follow-up study. PLoS One 2015;10:e0130044.

27. Allen K, Kypridemos C, Hyseni L, Gilmore AB, Diggle P, Whitehead M, et al. The effects of maximising the UK’s to- bacco control score on inequalities in smoking prevalence and premature coronary heart disease mortality: a modelling study. BMC Public Health 2016;16:292.

28. Stallings-Smith S, Zeka A, Goodman P, Kabir Z, Clancy L.

Reductions in cardiovascular, cerebrovascular, and respira-

tory mortality following the national irish smoking ban: inter- rupted time-series analysis. PLoS One 2013;8:e62063.

29. Sebrie EM, Sandoya E, Bianco E, Hyland A, Cummings KM, Glantz SA. Hospital admissions for acute myocardial infarc- tion before and after implementation of a comprehensive smoke-free policy in Uruguay: experience through 2010. Tob Control 2014;23:471-2.

30. Kim Y, Park S, Kim NS, Lee BK. Inappropriate survey design analysis of the Korean National Health and Nutrition Exami- nation Survey may produce biased results. J Prev Med Public Health 2013;46:96-104.

31. Tottenborg SS, Thomsen RW, Johnsen SP, Nielsen H, Lange P. Determinants of smoking cessation in patients with COPD treated in the outpatient setting. Chest 2016;150:554-62.

32. Pulakka A, Halonen JI, Kawachi I, Pentti J, Stenholm S, Jokela

M, et al. Association between distance from home to tobacco

outlet and smoking cessation and relapse. JAMA Intern Med

2016;176:1512-9.

수치

Table 1. Clinical characteristics of total enrolled subjects before and after policy change
Table 2. Significant factors for recent smoking cessation before policy change (2013–2014) among smoker  Representing number of recent  smoking cessation groupRepresenting number of current smoker groupUnivariate analysisMultivariate analysis OR95% CIp-val
Table 3. Significant factors for recent smoking cessation after policy change (2015) among smoker Representing number of recent  smoking cessation groupRepresenting of current smoker groupUnivariate analysisMultivariate analysis OR95% CIp-valueOR95% CIp-va

참조

관련 문서

The objective in this paper is to investigate effects of policy signals by central bank, monetary policy committee, and government, respectively, on financial variables in

This paper proposes a perspective of political economy to explore important issues on regulation studies, focusing on the case of tobacco control in South

This paper proposes a perspective of political economy to explore important issues on regulation studies, focusing on the case of tobacco control in South Korea.

Subjects with a smoking period of 1 to 3 years had a high smoking cessation success rate (p=0.024), and the lower the average daily smoking amount, the higher the

This study analyzed the characteristics of smokers in term of structure of household, socioeconomic status and smoking behavior and investigated whether

We find the correlation between marital status and current smoking, including interaction with marriage, occupation level, and Year.. Methods : We used the Korea National

The global rate in non-cigarette smoking shows an increase in recent years, and the smoking inequality phenomenon among non-cigarette smokers can be

The biomedicalisation of smoking cessation: a mixed methods study of lay perspectives on nicotine addiction.. Norway's tobacco