• 검색 결과가 없습니다.

Social media comparative analysis based on multidimensional scaling

N/A
N/A
Protected

Academic year: 2021

Share "Social media comparative analysis based on multidimensional scaling"

Copied!
12
0
0

로드 중.... (전체 텍스트 보기)

전체 글

(1)

Social media comparative analysis based on multidimensional scaling

Hanjun Lee 1 · Yongmoo Suh 2

12 Business School, Korea University

Received 2 April 2014, revised 18 April 2014, accepted 28 April 2014

Abstract

As social media draws attention as a business tool, organizations, large or small, are trying to exploit social media in their business. However, lack of understanding the characteristics of each social media led them to develop a naive strategy for dealing with social media. Thus, this study aims to deepen the understanding by comparatively analyzing how social media users perceive (the image of) each social media. Facebook, Twitter, YouTube, Blogs, Communities and Cyworld were chosen for our study and data from 132 respondents were analyzed using multidimensional scaling technique. The results show that there are meaningful differences in users’ perception of social media attributes, which are grouped into four; information feature, motivation, promotion tool, usability. It is also analyzed whether such differences can be found between male and female users. (Such differences are also analyzed in both male and female users’

perceptions.) Further, we discuss some implications of the research results for both practitioners and researchers.

Keywords: Image, multidimensional scaling, positioning map, social media.

1. Introduction

Social media is making a big wave. The explosively increasing number of social media users and huge amount of information disseminated through the social media are resulting in ripple effects on the whole world. Twitter is estimated to have more than 500 million users and generating over 340 million tweets per day (Wikipedia, 2012). Currently, there are more than 156 million public blogs in existence (Wikipedia, 2011). Facebook boasted 1.3 billion monthly active users worldwide by the end of 2013.

These trends affect how people interact with others and how people consume and share information (Surowiecki, 2004; Tapscott and Williams, 2006; Scoble and Israel, 2006). 96%

of Millennials (people born between ’82 and ’00 in the U.S.) have joined a social network, and social networking popularity surpassed e-mail popularity. News on Twitter spreads faster than those on CNN. People no longer search for news, products or services. The information itself will find them through social media.

1

Ph. D. candidate, Business School, Korea University, Seoul 136-701, Korea.

2
Corresponding author: Professor, Business School, Korea University, Seoul 136-701, Korea. E-mail:

ymsuh@korea.ac.kr

(2)

This means that there also should be a change in the traditional way of doing business such as communication with their customers. Only 14% of consumers trust traditional corporate advertisement, while 78% of consumers trust recommendation from their peers (New York Times, 2009). As a result, companies, both large and small, are trying to make use of social media (Gillin, 2008). 14 to 24% of the companies reduced more than 5% in off-line advertisement (e.g., TV and newspaper) budget, while 52% of the companies increased social media advertisement budget over 5%. They created fan pages on Facebook. They are tweeting on Twitter and posting video clips on YouTube. Out of the belief that using more types of social media would bring better result, most of the companies using social media are trying to exploit as many types of social media as they can. Unfortunately, most of them do not understand which social media is fitter to their purpose. If they know the difference among them, more strategic approach in using social media can be made.

Thus, our goal is to deepen the understanding of characteristics of each social media by comparatively analyzing how social media users perceive each social media. We also examined whether there is a difference in the perception between male and female users. We expect that our research can contribute to making better approach to utilizing social media as a business tool.

There are lots of social media, and the most popular six out of them were chosen for this study. They are Facebook, a social networking site, Twitter, a micro-blog, YouTube which is a user generated contents site and the second largest search engine in the world, blogs including company sponsored and user sponsored blogs, online communities (e.g., MacRumors or HP communities) and Cyworld, one of the most popular social network sites in Asia. We referred to the previous studies on the social media classification (Kaplan and Haenlein, 2010; Weinberg and Pehlivan, 2011) and we also considered the fact that the respondents for our survey were Asians, in their selection process.

The rest of the paper is organized as follows. In section 2, we introduce the existing literature relevant to our study. The research methodology is described in section 3. Section 4 presents research results. Finally, in section 5, we conclude the paper with implications and limitations of our study.

2. Related work

In this section, we first review the existing literature on social media, and then look into the multi-dimensional scaling which is chosen as the research methodology for our study.

2.1. Social media

The term, “social media” was initially coined by Chris Shipley, CEO of Guidewire Group, in 2004 at a conference (Wikipedia, 2013). There are various definitions about social media.

Weinberg (2009) says that social media “relates to the sharing of information, experiences,

and perspectives throughout community-oriented websites” (p. 1). Safko and Brake (2009)

mention that social media refers to “activities, practices, and behaviors among commu-

nities of people who gather online to share information, knowledge, and opinions using

conversational media” (p. 6). Wikipedia defines social media as an umbrella term that en-

compasses various activities integrating social interactions and the construction of words,

images, audio and videos with technologies (Wikipedia, 2013). Social media can take diverse

(3)

forms such as social networking sites (MySpace, Facebook, Faceparty), User-sponsored or company-sponsored blogs (Cnet.com, The Unofficial Apple Weblog, Apple.com), Creativ- ity works sharing sites (YouTube, Flickr, Piczo.com), Collaborative websites (Wikipedia), Virtual worlds (Second Life), and so on (Mangold and Faulds, 2009).

Although it has been less than a decade that social media come into being popular, various studies on social media are ongoing in diverse areas such as sociology, computer science and management. Although there is not a clear border among them, there are some differences in the aspect of what each of them concerns and approaches.

In sociology, researchers are usually interested in the behavioral characteristics of social media users. They approach such issues as motivation of using social media, using pattern or characteristics of social interaction on online social network by referring and extending the traditional studies on offline social network or online communities (Jung et al ., 2007;

Raacke and Bonds-Raacke, 2008; Ryan and Xenos, 2011; Tosun, 2012).

Computer scientists view social media as new technical platforms. Based on Web 2.0 technology and text mining techniques, they analyze a large amount of actual dataset, including a set of Tweets, Facebook log or textual data from other online communities, to help firms get business insight. Currently, big data analysis techniques accelerate various studies in this area. Each study is being conducted usually based on specific social media because each social media platform is too diverse in characteristics to be generalized into a type (Agrawal et al ., 2014; Catanese et al ., 2011; Mathioudakis and Koudas, 2010).

In management, researches on social media view social media as a new type of business tool which will supplement or replace the existing media. Weinberg (2009) defined social media marketing as “a process that empowers individual firms to promote their websites, products or services through online social channels and to communicate with and tap into a much larger community that may not have been available via traditional advertising channels”

(p. 3). Emphasizing the role of social media as a community, Hunt (2009) regards social media marketing as the synonym of community marketing. A main concern of prior studies has been how to exploit social media as a new business tool that can bring benefits to companies. Derived from this issue, topics such as different features of each social media compared to previous promotion tools, mixing social media to maximize the marketing effect or classification of social media are discussed (Hunt, 2009; Mangold and Faulds, 2009;

Weinberg, 2009; Weinberg and Pehlivan, 2011)

2.2. Multidimensional scaling

Multidimensional scaling is an exploratory technique used to develop spatial distance models for similarities, dissimilarities, or other proximity data (Carroll and Arabie, 1998).

Multidimensional scaling offers solutions to various problems in perception and cognition.

It can make it possible to reduce large amounts of data into simple and easy-to-visualize structures by building perceptual maps (i.e., positioning maps) that represent relationships among objects by placing each object on the same N-dimensional map (Mugavin, 2008).

Multidimensional scaling technique constructs a configuration of n points in low dimension by comparing similarities and dissimilarities among a set of objects. Similar objects are placed closely to each other, while dissimilar objects are placed far from each other on the configuration.

From a managerial perspective, multidimensional scaling gives a hint to analyze what the

(4)

customer needs are and how much the objects fit to the customer’s expectations. Accord- ingly, the technique has been widely used in developing marketing strategies, brand image improvement strategies or promotion strategies (Bae et al ., 2010; Gartner, 1989; Green and Carmone, 1970; Kim et al ., 2013). In this study, we apply multidimensional scaling to comparative analysis among social media to draw business implication.

3. Comparison of social media using multidimensional scaling

The unit of analysis is a social media user who has been using or had experience of using all of the six social media. This study was carried out with a focus on how individuals perceive similarity and dissimilarity of diverse attributes of social media, expecting that the results of this study will provide fundamental implications for practitioners and social media researchers.

3.1. Development of measures

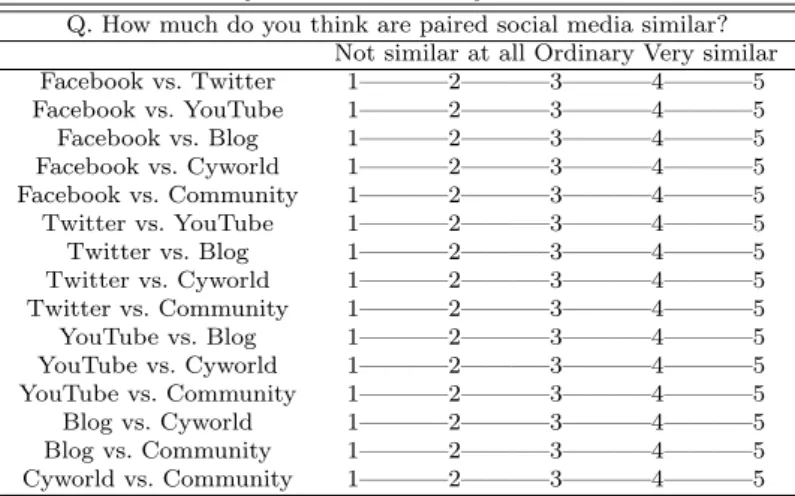
We designed a survey instrument that consists of two steps. In the first step, we measure similarity and dissimilarity between all pairs of social media. As shown in Table 3.1, the respondents were encouraged to answer how each pair of social media is similar in five-point Likert scale form from “Not similar at all (1)” to “Very similar (5)”.

Table 3.1 Survey about the similarity between social media Q. How much do you think are paired social media similar?

Not similar at all Ordinary Very similar Facebook vs. Twitter 1———–2———–3———–4———–5 Facebook vs. YouTube 1———–2———–3———–4———–5 Facebook vs. Blog 1———–2———–3———–4———–5 Facebook vs. Cyworld 1———–2———–3———–4———–5 Facebook vs. Community 1———–2———–3———–4———–5 Twitter vs. YouTube 1———–2———–3———–4———–5 Twitter vs. Blog 1———–2———–3———–4———–5 Twitter vs. Cyworld 1———–2———–3———–4———–5 Twitter vs. Community 1———–2———–3———–4———–5 YouTube vs. Blog 1———–2———–3———–4———–5 YouTube vs. Cyworld 1———–2———–3———–4———–5 YouTube vs. Community 1———–2———–3———–4———–5 Blog vs. Cyworld 1———–2———–3———–4———–5 Blog vs. Community 1———–2———–3———–4———–5 Cyworld vs. Community 1———–2———–3———–4———–5

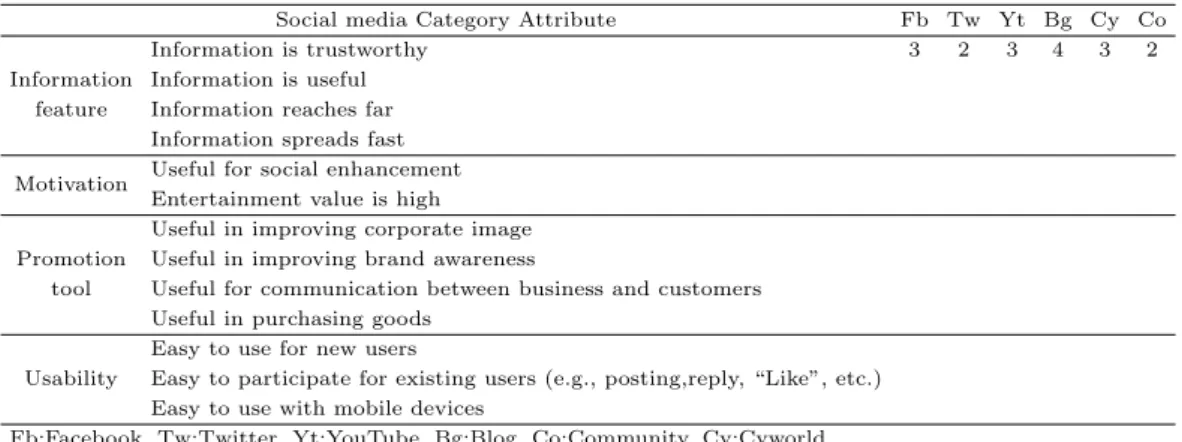
In the second step, various attributes of social media are measured. Most of the attributes are based on previous studies, while others are newly developed. The total number of at- tributes is 13 and they are grouped into four as shown in Table 3.2.

The first group contains the attributes related to the feature of information which is passed

through social media, such as trustworthiness, usefulness, reaching scope and spreading

speed. The second group contains the attributes related to motivation of using social media,

such as social enhancement and entertainment. The third group contains the attributes

related to social media as a promotion tool, such as improving corporate image tool and

improving brand awareness tool, improving B2C communication tool, and purchasing aid

tool. The last group contains the attributes related to usability of social media as an ordinary

(5)

website, such as ease of use for new users and easy to participate for existing users and ease of use with the mobile devices.

Each attribute was measured using a five-point Likert scale from “Strongly disagree (1)”

to “Strongly agree (5)”.

Table 3.2 Survey about the attributes of social media

Social media Category Attribute Fb Tw Yt Bg Cy Co

Information

Information is trustworthy 3 2 3 4 3 2

feature

Information is useful Information reaches far Information spreads fast Motivation Useful for social enhancement

Entertainment value is high

Promotion

Useful in improving corporate image

tool

Useful in improving brand awareness

Useful for communication between business and customers Useful in purchasing goods

Usability

Easy to use for new users

Easy to participate for existing users (e.g., posting,reply, “Like”, etc.) Easy to use with mobile devices

Fb:Facebook, Tw:Twitter, Yt:YouTube, Bg:Blog, Co:Community, Cy:Cyworld

3.2. Data collection

We conducted a survey among students from three universities and workers from compa- nies in Korea with the questions shown in Table 3.1 and 3.2. The respondents were mostly in their 20’s or 30’s. We contacted 198 adults those who had experience of using social me- dia and gathered 189 responses. Out of them, six, which had partially missing values, were discarded. To get more accurate result, those who did not have an experience of using any of the six media were excluded. Thus, 132 data were used for the final analysis. Table 3.3 describes the characteristics of the sample.

Table 3.3 Characteristics of the sample

Freq. Percent Freq. Percent

Gender Average use per day (hour)

Male 76 57.58 Seldom use 4 3.03

Female 56 42.42 Less than 0.5 43 32.58

Total 132 100.00 0.5 - 1 29 21.97

1 - 2 39 29.55

2 and above 17 12.88

Total 132 100.00

Age Freq. Percent Period of use (year) Freq. Percent

18 - 25 7 5.30 Less than 0.5 13 9.84

26 - 30 32 24.24 0.5 - 1 3 2.27

31 - 35 58 43.94 1 - 2 20 15.15

36 - 40 28 21.21 2 - 3 3 2.27

41 - 45 6 4.55 3 - 5 24 18.18

46 and above 1 0.76 5 and above 69 52.27

Total 132 100.00 Total 132 100.00

4. Results

We conducted similarity analysis, Analysis for attribute assessment and Attribute vector

comparison analysis using ALSCAL which SPSS 12.0 provides.

(6)

4.1. Similarity analysis

Stress is a measure of loss between the dissimilarities and the distance. It indicates the positioning map’s goodness of fit. In general, a stress value below 0.10 is known to be ideal, a value between 0.10 and 0.15 is known to be good and a value greater than 0.30 represents that samples are placed arbitrarily in the 2-dimensional space.

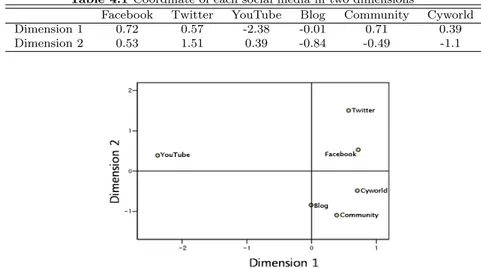
Table 4.1 shows the set of coordinates of each social media in 2 dimensions and Figure 4.1 was drawn based on the information in Table 4.1. The stress value we obtained was 0.14046, indicating that the samples are placed well in 2-dimensional space.

Table 4.1 Coordinate of each social media in two dimensions

Facebook Twitter YouTube Blog Community Cyworld

Dimension 1 0.72 0.57 -2.38 -0.01 0.71 0.39

Dimension 2 0.53 1.51 0.39 -0.84 -0.49 -1.1

Figure 4.1 Positioning map on similarity among social media

Distances between any two objects represent the degree of similarity between them as a user perceives them. That is, the more closely they are located, the more similar they are the user perceives.

Figure 4.1 shows that users think YouTube as the most distinguishing social media among other social media. Blog, Community and Cyworld are perceived very similar to each other, while Twitter is considered relatively different media.

Figure 4.2 Positioning map on similarity among social media (male only)

(7)

We also conducted the same analysis for each gender. Figures 4.2 and 4.3 show the po- sitioning maps of the male-only and the female-only data. Their stress values are 0.1469 and 0.1501, respectively, which indicate the result can be considered reliable. The fat that dots on Figure 4.3 are positioned further from each other than those on Figure 4.2 can be interpreted as female users tend to recognize the difference among social media more clearly than male users.

Figure 4.3 Positioning map on similarity among social media (female only)

4.2. Analysis for attribute assessment

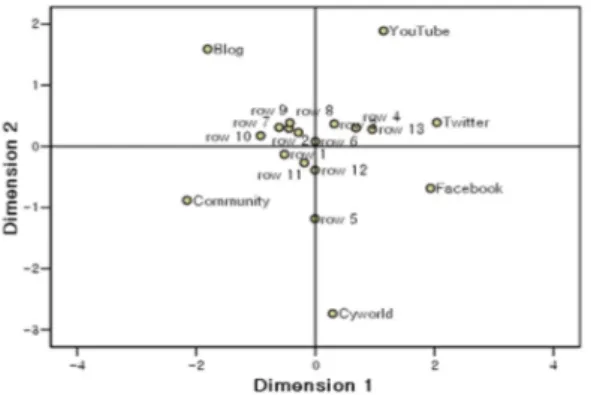
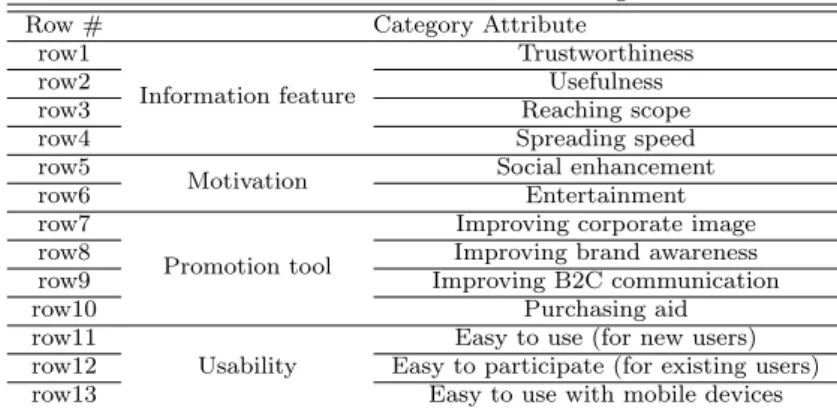
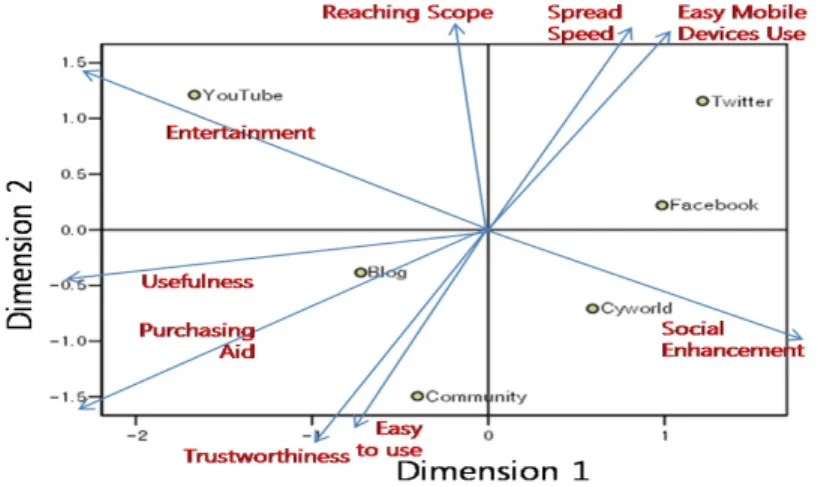
We performed attribute assessment analysis. Figure 4.4 is a map drawn based on the result from the survey which was conducted using the contents of Table 3.2. The stress value is 0.14456. Each row of Table 3.2 asks about the associated attribute in Table 4.2. If an object is close to a certain row, it represents that the object is superior to other objects with respect to the attribute.

Figure 4.4 Positioning map on the attributes of social media

(8)

Table 4.2 Row No. and attribute matching table

Row # Category Attribute

row1

Information feature

Trustworthiness

row2 Usefulness

row3 Reaching scope

row4 Spreading speed

row5 Motivation Social enhancement

row6 Entertainment

row7

Promotion tool

Improving corporate image

row8 Improving brand awareness

row9 Improving B2C communication

row10 Purchasing aid

row11

Usability

Easy to use (for new users) row12 Easy to participate (for existing users)

row13 Easy to use with mobile devices

In Figure 4.4, rows 7, 8, 9 and 10 are closer to Blog and Community than YouTube, Twitter, Facebook and Cyworld. This means that the formers are considered superior than the latters in terms of their usefulness as promotion tools. Row 1 and row 11 are relatively closer to Community than other media. We can interpret this as the information on Com- munity is perceived more trustworthy and the media is easier to use for new users. Row 2, information usefulness is positioned at the center among all social media excluding Cyworld, which means information on Cyworld is perceived inferior in terms of usefulness.

We conducted the same analysis on each gender. Figures 4.5 and 4.6 show the positioning maps on the attributes of social media, each from male and female users. The attributes and media in Figure 4.6 are located in a more scattered manner than those in Figure 4.5.

It represents that male users do not identify the difference among those social media, while female users recognize the differences clearly. For female users, Cyworld is superior to other media in terms of social enhancement, easy to use and easy to participate (row 5, 11 and 12). Blog and Community are perceived better promotion tools by female users for row 7, 8, 9 and 10 are closer to them than other media. Also Information on Blog and Community is perceived more trustworthy and useful (row 1 and 2) than others.

Figure 4.5 Positioning map on the attributes of social media (male only)

(9)

Figure 4.6 Positioning map on the attributes of social media (female only)

4.3. Attribute vector comparison analysis

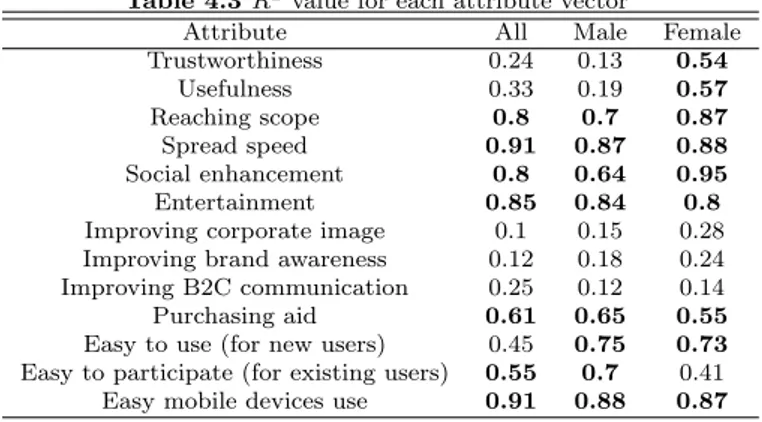
Then, we conducted attribute vector comparison analysis using the coordinate values in Table 4.1 and the results of step 2 in the survey. For attribute value comparison, attribute vectors should be computed through regression analysis with each coordinate as an inde- pendent variable and attributes as dependent variables.

The reliability of attribute vectors can be determined by R 2 which represents the degree of explanation power. Although there is not a firm standard about the value of R 2 for which the result is believed to be significant, we consider the attribute vector that has more than 50% explanatory power as significant in this study.

Table 4.3 shows R 2 value for each attribute vector. Attribute vectors over 0.5 are in bold font. The attributes such as reaching scope, spreading speed, social enhancement, enter- tainment, purchasing aid, easiness to use for existing users and easiness to use with mobile devices are found to have low explanatory power. Other attributes such as information trustworthiness and usefulness have low explanatory power for the male users, meanwhile, they have sufficient explanatory power for the female users. The difference between male and female users in R 2 value of attribute easy-to-participate represents that there exists a difference in perception of information usability of social media depending on gender. The values of attribute easy-to-use for new users show that male and female users have their own tendency of perception.

Table 4.3 R

2

value for each attribute vector

Attribute All Male Female

Trustworthiness 0.24 0.13 0.54

Usefulness 0.33 0.19 0.57

Reaching scope 0.8 0.7 0.87

Spread speed 0.91 0.87 0.88

Social enhancement 0.8 0.64 0.95

Entertainment 0.85 0.84 0.8

Improving corporate image 0.1 0.15 0.28 Improving brand awareness 0.12 0.18 0.24 Improving B2C communication 0.25 0.12 0.14

Purchasing aid 0.61 0.65 0.55

Easy to use (for new users) 0.45 0.75 0.73

Easy to participate (for existing users) 0.55 0.7 0.41

Easy mobile devices use 0.91 0.88 0.87

(10)

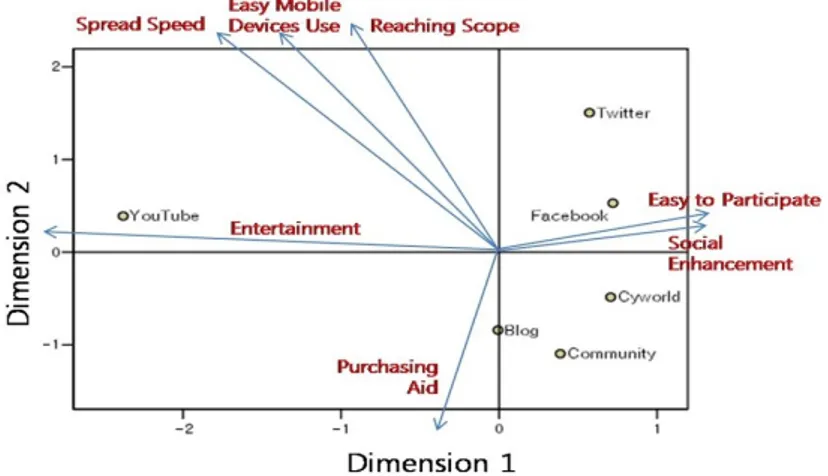
Figures 4.7, 4.8, and 4.9 represent the positioning maps combined with attribute vectors.

On the map, the attribute value of each social media is measured by how each social media is located in the direction of each attribute vector (Lee, 2013). Accordingly, in Figure 4.7, the social media which have a strong image as a purchasing aid are blog, and community and YouTube in a decreasing order of strength. The results shown in Figure 8 are similar to those shown in Figure 4.7. But there is a considerable difference between Figures 4.8 and 4.9. YouTube, Twitter, Facebook are the most easy-to-use for new users in that order for male users (see Figure 4.8), while Community, Blog, Cyworld are the most easy-to-use for new users in that order for female users (see Figure 4.9).

Figure 4.7 Positioning map combined with attribute vector

Figure 4.8 Positioning map combined with attribute vectors (male only)

(11)

Figure 4.9 Positioning map combined with attribute vectors (female only)

5. Conclusion

The purpose of this study is to understand the characteristics of major social media.

Existing studies are mainly targeting specific social media or approaching conceptually or theoretically, whereas we perform comparative analysis among social media empirically and make an approach to analyzing user perception on various attributes of social media.

We found significant differences in the perceived image of each social media in terms of 13 attributes. Our results also show that the social media classification by the users’ perceived image is different from those of prior studies which classify social media based on social presence and self-presentation (Wikipedia, 2013), or half-life of information and information depth (Mangold and Faulds, 2009). In addition, we show that there are considerable differ- ences in the perception between two genders. It implies that the gender of users requires a different approach to social media marketing. The findings suggest that organizations which use social media as a business tool, should try to deepen their understanding of each characteristic of social media to create a better output.

The fact that the sample size was relatively small and restricted to specific Asian country users can be limitation of our study. Since there are big differences among countries in the pattern of using social media, applying this study across national cultures may lead to more interesting results.

References

Agrawal, D., Budak, C., El Abbadi, A., Georgiou, T. and Yan, X. (2014). Big data in online social net- works: User interaction analysis to model user behavior in social networks, Databases in Networked Information Systems, 1-16.

Bae, H. W., Kwon, K. H., Moon, M. N. and Moon, H. S. (2010). Multidimensional scaling analysis on the image of special purpose academies. Journal of Korean Data & Information Science Society, 21, 11-21.

Carroll, J. D. and Arabie, P. (1998). Multidimensional scaling. Measurement, Judgment and Decision Mak-

ing, 179-250.

(12)

Catanese, S. A., De Meo, P., Ferrara, E., Fiumara, G. and Provetti, A. (2011). Crawling facebook for social network analysis purposes. In Proceedings of the International Conference on Web Intelligence, Mining and Semantics, Association for Computing Machinery, 52-59.

Gartner, W. C. (1989). Tourism image: Attribute measurement of state tourism products using multidi- mensional scaling techniques. Journal of Travel Research, 28, 16-20.

Gillin, P. (2008). Secrets of social media marketing: How to use online conversations and customer com- munities to turbo-charge your business! Linden Publishing, Fresno.

Green, P. E. and Carmone, F. J. (1970). Multidimensional scaling and related techniques in marketing analysis, Allyn and Bacon, Boston.

Hunt, T. (2009). The Whuffie factor: Using the power of social networks to build your business, Crown Business, New York.

Jung, T., Youn, H. and McClung, S. (2007). Motivations and self-presentation strategies on Korean-based Cyworld weblog format personal homepages. CyberPsychology & Behavior , 10, 24-31.

Kaplan, A. M. and Haenlein M. (2010). Users of the world, unite! The challenges and opportunities of Social Media. Business Horizons, 53, 59-68.

Kim, S., Lee, H., Suh, Y. and Han, J. (2013). Enhancing the corporate image through social media: An approach based on multi-dimensional scaling. Journal of the Korean Data & Information Science Society, 24, 427-436.

Lee, H. (2013). Data analysis using SPSS , Cheongram, Seoul.

Mangold, W. G. and Faulds, D. J. (2009). Social media: The new hybrid element of the promotion mix.

Business Horizons, 52, 357-365.

Mathioudakis, M. and Koudas, N. (2010). Twittermonitor: Trend detection over the twitter stream. In Proceedings of the 2010 ACM SIGMOD International Conference on Management of Data, Association for Computing Machinery, 1155-1158.

Mugavin, M. E. (2008). Multidimensional scaling: A brief overview. Nursing Research, 57, 64-68.

New York Times. (2009). For many businesses with low ad budget, the social media networking is their sole means of marketing, 23, July.

Raacke, J. and Bonds-Raacke, J. (2008). MySpace and Facebook: Applying the uses and gratifications theory to exploring friend-networking sites. CyberPsychology & Behavior , 11, 169-174.

Ryan, T. and Xenos, S. (2011). Who uses Facebook? An investigation into the relationship between the big five, shyness, narcissism, loneliness, and Facebook usage. Computers in Human Behavior , 27, 1658-1664.

Safko, L. and Brake, D. K. (2009). The social media bible: Tactics, tools & strategies for business success, John Wiley & Sons, Hoboken.

Scoble, R. and Israel, S. (2006). Naked conversations, how blogs are changing the way businesses talk with customers, John Wiley and Sons, Hoboken.

Surowiecki, J. (2004). The wisdom of crowds: Why the many are smarter than the few and how collective wisdom shapes business, economies, societies and nations, Doubleday, New York.

Tapscott, D. and Williams, A. (2006). Wikinomics: How mass collaboration changes everything, Portfolio, New York.

Tosun, L. P. (2012). Motives for Facebook use and expressing “true self” on the Internet. Computers in Human Behavior , 28, 1510-1517.

Weinberg, B. D. and Pehlivan, E. (2011). Social spending: Managing the social media mix. Business Hori- zons, 54, 275-282.

Weinberg, T. (2009). The new community rules: Marketing on the social web, O’Reilly Media, Inc., Se- bastopol

Wikipedia, Blog. (2011). http://en.wikikpedia.org/wiki/Blog.

Wikipedia, Chris Shipley. (2013). http://en.wikipedia.org/wiki/Chris_Shipley.

Wikipedia, Twitter. (2012). http://en.wikipedia.org/wiki/Twitter.

수치

Table 3.1 Survey about the similarity between social media Q. How much do you think are paired social media similar?
Table 3.2 Survey about the attributes of social media
Table 4.1 shows the set of coordinates of each social media in 2 dimensions and Figure 4.1 was drawn based on the information in Table 4.1
Figure 4.4 Positioning map on the attributes of social media
+5

참조

관련 문서

Although there was a trend for a greater decline in quantitative HBsAg titers in the group that achieved HBeAg seroclearance, the difference in the kinetics of qHBsAg

In the change of active oxygen, As a result of the active oxygen change between the two groups, there was a statistically significant difference according

Thirdly, it appeared that social support had meaningful effect on self-efficacy and the quality of life, and in the case of the difference analysis by

In Section 2, social deficiency, various deficits in relation to society were considered based on various social phenomena, and by referencing Erik

Second, analyzing students' level of interest in the unit of Clothes and Life Style revealed that there was significant difference between genders and students in the two

The results of analysis on the difference of psychological happiness according to frequency of participation of external physical activity of female middle school

This chapter aims to discuss the organic relations between Shakespeare’s literature and Star Trek series based on The Sonnets that is characteristic of the

Third, the analysis of the body-centered vertical speed between male.. and female students showed that male students appeared faster than female students at