*
This study was supported by Kyngsung University Research grants in 2017.
†
Corresponding author: Sang-Mook Lee, Assistant Professor, Dept. of Foodservice Management, Kyungsung University, 309 Suyeong-ro, Nam-gu, Busan 608-736, South Korea, Tel. +82-51-663-4474, Fax. +82-51-627-6830, E-mail: [email protected]
Information available at the Culinary Society of Korea (http://www.culinary.re.kr/)
Culinary Science & Hospitality Research
Journal & Article Management System: https://cshr.jams.or.kr/
그림 21-28
http://dx.doi.org/10.20878/cshr.2018.24.2.014
The Influence of the Experiential Marketing Factors of Restaurant on the Brand Image, Satisfaction, and Customer Loyalty :
Focused on Restaurants in Complex Shopping Mall
Sang-Mook Lee
†Dept. of Foodservice Management, Kyungsung University, Busan 608-736, South Korea
KEYWORDS ABSTRACT
Complex shopping mall, Experiential marketing
clues, Brand image, Satisfaction, Loyalty.
The purpose of this study is to develop and test a model that explains the effect of experiential marketing factors on: 1) brand image, 2) satisfaction, and 3) loyalty in context of restaurants located in complex shopping mall. In addition, the study clarified how these variables relate to each other.
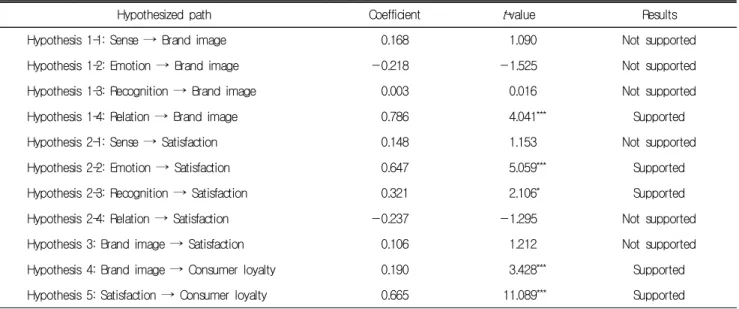
Survey were distributed to customers who have visiting experience(s) in a restaurants in complex shopping mall. Total 360 participants were distributed and 344 questionnaires were used for analysing. The confirmatory factor analysis and structural equation modeling(SEM) have been em- ployed research methods for frequency analysis, reliability analysis and measurement model vali- dation. The findings of this study identified that relation factor of experiential marketing elements was only significant factor on brand image Furthermore, sense and recognition were critical components of customer satisfaction. Last, present study also identified the significant relationship between satisfaction and customer loyalty. These findings may contribute to provide valuable mar- keting strategic for this business segmentation, and it can be utilized as a fundamental study to establish an efficient business plan to increase revenue especially for restaurant business located in complex shopping mall.
1. INTRODUCTION
Recent economic growth and lifestyle changes have led to the phenomenon of malling, which involves shopping, eating out, and entertainment in a variety of shopping malls. There- fore, a complex shopping mall where various facilities such as culture, dining out, and convenience facilities are gathering attention as a new consumption space. Since the compound shopping mall has the effect of giving competitiveness to the food service companies such as accessibility and the visitor effect, various food service providers are introducing the
concept food service brand into the compound shopping mall. As such, modern consumers have preferred to be able to experience various experiences in an intensive place, and it is changing from the era of adding the quality of products to the experience of the experienced economy.
As interest in the complex shopping mall in the food ser-
vice industry has increased, various studies related to the
complex shopping mall have been reported. In the previous
research, the necessity of facilities with various themes and
stories was changed as the shopping mall usage style changed
from the conventional market to the mixed shopping mall.
The analysis of the difference between the leisure motives according to the lifestyle of the users of the complex shopping mall, And the need to improve the services that can be provided (Song, 2017; Seo et al., 2013; Shim, 2015). Although research on the complex shopping mall in various areas has been reported, there is still a lack of studies on the food service companies in the complex shopping mall (Kim & Oh, 2011). The relationship between the various experience mar- keting factors of the complex shopping mall and the relation- ship quality variables such as trust, commitment, and satis- faction with the complex shopping mall brand has not yet been reported. Hence, the purpose of this study is to investi- gate the relationship between experience marketing and customer relationship quality in a shopping mall for customers who have visited a foodservice company in a complex shopping mall. This study suggests a meaningful direction for establi- shing an empirical marketing strategy for a catering company in a complex shopping mall in the future, and suggests various implications for a complex shopping mall that has become a new cultural space.
2. LITERATURE REVIEW
2.1. Experiential Marketing Clues
Schmitt (1999) defines experiences as responses to stimuli such as marketing efforts before and after purchasing, and presents sensory, emotional, cognitive, behavioral, and rela- tional experiences as a strategic experience module for expe- riential marketing. And emphasized the need to identify value.
Experience marketing is also considered to be an important predictor in the hospitality industry, where experiences such as leisure, events, hotels, tourism, and eating out are impor- tant (Dong et al., 2014, Jo et al., 2010; Kwak et al., 2015). For example, Jo et al. (2010) found that coffee shop atmospheres and merchandise assortment in a department store, sales promotion of restaurants in department stores, and product assortment increase shopping value. In addition, Dong et al.
(2014) found that emotional experience, service environment, and functional service influences consumers' emotional res- ponses to coffee shop customers. In similar vein, Kwak & Lee (2015) showed that restaurant's experiential marketing attri- butes had a significant effect on emotional response and directly influenced brand attitude and behavioral intention.
Therefore, current study considered the experiential marketing elements as sense, emotion, recognition, relation and verify
the relationships among those experiential marketing clues, brand image, satisfaction, and loyalty in complex shopping mall.
2.2. Brand Image
Dobni and Zinkhan (1990) defined the brand image is a subjective and recognized perception that is developed through consumer evaluating about positive or negative emotion to- ward products or services based on various reasons. In pre- vious studies, brand image has been verified as a critical factor especially to better understand the consumer behaviors since numerous studies identified the brand image has influenced on dependent variables such as recognized value, satisfaction, and customers' future behavior like positive intention or re- commendation (Dobni & Zinkhan, 1990; Kim & Lee, 2014;
Verhoef et al., 2009). Although the pervious studies have conceptual obscurity, brand image has an influence on va- rious marketing activities because it is directly linked to consumers' behaviors or characteristics (Dobni & Zinkhan, 1990).
Therefore, brand image plays an critical role because brand image is formulated by visible or non-visible factors in context of foodservice industries. Hence, present study considers brand image as emotion, attitude, or thinking of customers as per- ceived by restaurants in complex shopping mall.
2.3. Satisfaction
As one of the most important factors influencing consu- mers' loyalty, satisfaction has verified extensive research as an organizational goal, especially in the highly competitive food- sevice business. Westbrook and Oliver (1991) reported that satisfaction is a result toward comparison of the satisfied level of service or product, quality, or other outcomes perceived by the customers. Therefore, customer satisfaction can be in- fluenced by many reasons when people estimate all products or service. Hence, prior scholars recommended that evaluation of satisfaction need to include cognitive side because human emotion is an important part of motivation and it is closely related to judgements of satisfaction (Hellier et al., 2003;
Westbrook & Oliver, 1991). Finally, this study refers to affective estimation of various experiential marketing clues as well as cognitive aspects like brand trust formulated from their experience in a restaurant of complex shopping mall.
2.4. Customer Loyalty
Oliver (2010) defined the loyalty as a deeply held commit-
ment to repurchase or revisit a satisfied product or service in the future. Therefore, conceptually customer loyalty has been a central factor not only for long-term business success for a company, but also increasing consumer's satisfaction (Dick
& Basu, 1994; Jacoby & Chestnut, 1978). Hence, customer lo- yalty was estimated by assessing behavioral and attitudinal aspects in previous studies, and customer loyalty has been used as an significant dependent element for increasing a sus- tainable benefit for any business (Dick & Basu, 1994). Al- though previous researchers identified sufficient studies using the concept of consumer loyalty (Go & lee, 2011; Han & Ryu, 2009; Lee, Song, & Lee, 2016; Schall, 2003; Woo, 2010), restau- rants in complex shopping mall was not estimated with the experiential marketing clues, brand trust, and satisfaction so far. Therefore, this study employes the concepts of loyalty to estimate restaurant customers’ loyalty in context of complex shopping mall.
3. METHODOLOGY
For the validation studies, present study distributed total of 360 questionnaires over about two weeks from september 1, 2016 to september 30, 2016. Among the data 16 respon- dents that are unfaithful and unsuitable responses through outlier verification among these.
So the data of a total of 344 parts of the questionnaires were analyzed utilizing SPSS 21.0 and AMOS 21.0. The con- firmatory factor analysis and structural equation modeling (SEM) have been employed research methods for frequency analysis, reliability analysis and measurement model valida- tion.
4. RESULTS
4.1. Demographic Information
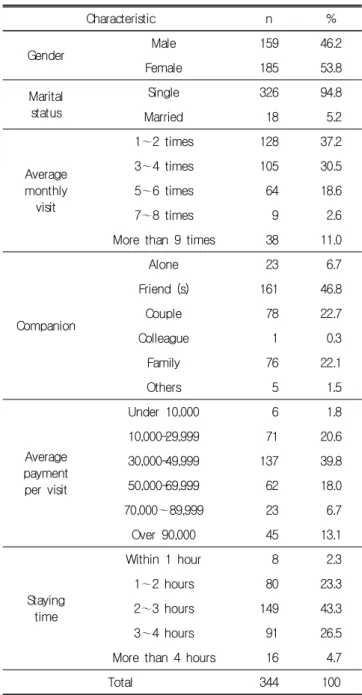
The demographic analysis shows that male were 46.2% and female respondents were 53.8%. Almost participants were single (94.8%), and in average monthly visiting times, were the largest group visiting was 1~2 times (37.2%) followed by 3~4 times (30.5%), and 5~6 times (18.6%). In addition, 38 respondents (11%) were visit the complex mall more than 9 times. When asked companion, 46.8% people responded friend (s) followed by couple (22.7%), and family (22.1%). For staying time, 2~3 hours had the highest score, 43.3%. The respon- dents, accounting for 39.8%, reported most frequently that
Table 1. General characteristics of the subjects
Characteristic n %
Gender Male 159 46.2
Female 185 53.8
Marital status
Single 326 94.8
Married 18 5.2
Average monthly
visit
1 ~2 times 128 37.2
3 ~4 times 105 30.5
5 ~6 times 64 18.6
7 ~8 times 9 2.6
More than 9 times 38 11.0
Companion
Alone 23 6.7
Friend (s) 161 46.8
Couple 78 22.7
Colleague 1 0.3
Family 76 22.1
Others 5 1.5
Average payment per visit
Under 10,000 6 1.8
10,000-29,999 71 20.6
30,000-49,999 137 39.8
50,000-69,999 62 18.0
70,000 ~89,999 23 6.7
Over 90,000 45 13.1
Staying time
Within 1 hour 8 2.3
1 ~2 hours 80 23.3
2 ~3 hours 149 43.3
3 ~4 hours 91 26.5
More than 4 hours 16 4.7
Total 344 100
average payment per visit is between 30,000-49,999 won.
4.2. Measurement Model and Discriminant Validity Analysis
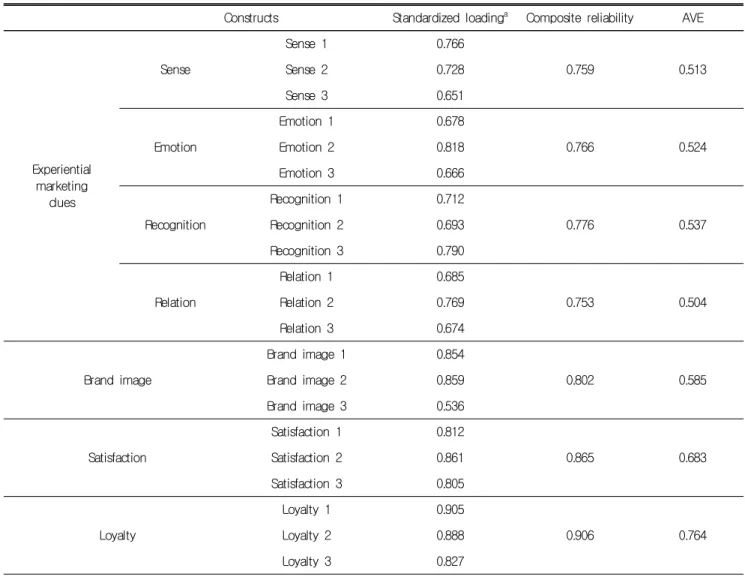
Experiential marketing factor based on previous studies
were estimated by sense, emotion, recognition, and relation
clues using a total of 12 questions, and brand image, satis-
faction, loyalty were measured by three questions each. The
convertgent validity was confirmed since Average Variance
Extracted of all components are higher than 0.50 and all the
discriminant validity confirmed (Bagozzi, 1988). (see Table 2).
Table 2. Standardized loading and AVE
Constructs Standardized loading
aComposite reliability AVE
Experiential marketing
clues
Sense
Sense 1 0.766
0.759 0.513
Sense 2 0.728
Sense 3 0.651
Emotion
Emotion 1 0.678
0.766 0.524
Emotion 2 0.818
Emotion 3 0.666
Recognition
Recognition 1 0.712
0.776 0.537
Recognition 2 0.693
Recognition 3 0.790
Relation
Relation 1 0.685
0.753 0.504
Relation 2 0.769
Relation 3 0.674
Brand image
Brand image 1 0.854
0.802 0.585
Brand image 2 0.859
Brand image 3 0.536
Satisfaction
Satisfaction 1 0.812
0.865 0.683
Satisfaction 2 0.861
Satisfaction 3 0.805
Loyalty
Loyalty 1 0.905
0.906 0.764
Loyalty 2 0.888
Loyalty 3 0.827
χ
2=447.334, d.f. =168, IFI=0.931, TLI=0.913, CFI=0.930, GFI=0.893, AGFI=0.853, RMSEA=0.070 IFI=Incremental Fit Index; TLI=Tucker-Lewis Index; CFI=Comparative fit index; GFI=Goodness of fit index;
AGFI=Adjusted goodness of fit index; RMSEA=Root mean square error of approximation
a