Sentinel-2 위성영상과 SRTM DEM을 활용한 연안습지 탐지:
서해안 곰소만을 사례로*
정윤재
1※·김경섭
2·박인선
2Detection of the Coastal Wetlands Using the Sentinel-2 Satellite Image and the SRTM DEM Acquired in Gomsoman Bay, West Coasts of South
Korea*
Yun-Jae CHOUNG
1※·Kyoung-Seop KIM
2·Insun PARK
21
요 약
기존 연구에서는 연안습지를 탐지하기 위해 위성/항공 영상의 다중분광 밴드로부터 산출한 식생 지수 또는 토지피복도를 활용하였으나, 단일 센서만을 활용할 경우 토지피복정보와 지형정보를 동 시에 고려하는 것에 한계가 있어 높은 정확도의 연안습지 탐지 및 대규모 연안습지 관리 업무 수 행에 많은 지장을 초래하였다. 본 연구에서는 우리나라 서해안 곰소만 지역을 촬영한 Sentinel-2 위성영상의 다중분광 밴드와 디지털 지형 모델인 SRTM(Shuttle Radar Topography Mission) DEM(Digital Elevation Model)을 사용하여 서해안 곰소만의 대규모 연안습지를 다음의 과정을 통해 탐지하였다. 우선 Sentinel-2 위성영상의 Green 및 근적외선 밴드를 활용하여 정규수분지 수 영상을 제작하였다. 그리고 정규수분지수 영상에서 픽셀의 밝기값 0.2를 임계치로 설정하여 물 과 육지를 구분하는 이진화 영상을 제작하였으며, SRTM DEM에서 픽셀의 밝기값 0을 임계치로 설정하여 해수면 아래와 해수면 위를 구분하는 이진화 영상을 제작하였다. 최종적으로는 두 장의 이진화 영상에 중첩 분석을 적용하여 이진화 영상 기반 연안습지 지도를 제작하였다. 본 연구에서 제안한 기술을 활용하여 제작한 이진화 영상 기반 연안습지 지도의 정확도는 94%로서 매우 높은 결과를 보여주었으며, 연안습지가 아닌 내륙습지, 산지습지 등은 탐지되지 않아서 연안습지 관리 업무에 매우 효과적으로 활용될 수 있음을 확인하였다.
2021년 05월 17일 접수 Received on May 17, 2021 / 2021년 06월 07일 수정 Revised on June 07, 2021 / 2021 년 06월 11일 심사완료 Accepted on June 11, 2021
* 본 연구는 국토교통부/국토교통과학기술진흥원의 지원으로 수행되었습니다(과제번호 21DPIW-C153746-03).
1 ㈜지오씨엔아이 공간정보기술연구소 연구소장 Chief Technology Officer, Geospatial Research Center, GEO C&I Co., Ltd.
2 ㈜지오씨엔아이 공간정보기술연구소 선임연구원 Senior Researcher, Geospatial Research Center, GEO C&I Co., Ltd.
※ Corresponding Author E-mail : [email protected]
(Digital Elevation Model) acquired in Gomsoman Bay, west coasts of South Korea through the following steps. First, the NDWI(Normalized Difference Water Index) image was generated using the green and near-infrared bands of the given Sentinel-2 satellite image. Then, the binary image that separating lands and waters was generated from the NDWI image based on the pixel intensity value 0.2 as the threshold and the other binary image that separating the upper sea level areas and the under sea level areas was generated from the SRTM DEM based on the pixel intensity value 0 as the threshold. Finally, the coastal wetland map was generated by overlaying analysis of these binary images. The generated coastal wetland map had the 94% overall accuracy.
In addition, the other types of wetlands such as inland wetlands or mountain wetlands were not detected in the generated coastal wetland map, which means that the generated coastal wetland map can be used for the coastal wetland management tasks.
KEYWORDS : Coastal Wetland, Sentinel-2 Satellite Image, Normalized Difference Water Index, Digital Elevation Model
서 론
간석지를 포함한 연안습지는 습지의 한 종류로 서 만조 시와 간조 시에 수위와 지면이 접하는 경계 사이의 지역을 의미하며, 세계 대규모 습지 의 대부분을 차지하고 있다(Korean Wetland Society, 2016). 연안습지는 연안 침식 방지, 연안 생태계 건강성 보존, 연안 오염물질 제거, 연안 재해 방지 등의 기능이 있어 보호 가치가 매우 높다(Korea National Park, 2021). 특히 우리나라는 국토 면적의 3%가 연안습지이고 이 중 83%가 서해안에 위치하고 있으며, 서해안 갯벌은 캐나다 및 미국의 동부 해안, 유럽의 북 해 연안, 남미의 아마존 연안과 더불어 세계 5
개 갯벌로 분류될 정도로 보존 가치가 높다 (Pressian, 2021).
원격탐사 자료는 현장 답사 없이 대규모 연안 습지 지역을 조사할 수 있어 국내외 관련 연구 자들에 의해 사용되었다. 국내에서는 Jo(2005) 가 다양한 위성영상을 사용하여 북한 서한만 일 대의 간석지를 탐지하였으며, Lee and Lee (2005)가 Landsat 위성영상을 사용하여 간석 지의 시공간 변화를 탐지하였다. 그리고 Lee et al.,(2010)은 위성영상 및 항공사진을 사용하여 을숙도 연안습지의 정성적 변화를 분석하였으 며, Jang et al.,(2010)은 위성영상을 이용하여 태안반도 간석지의 토지피복 변화 및 패턴을 분 석하였다. 국외에서는 Munyati(2000), Weng (2002), Blanchette et al.,(2018) 등이 다중
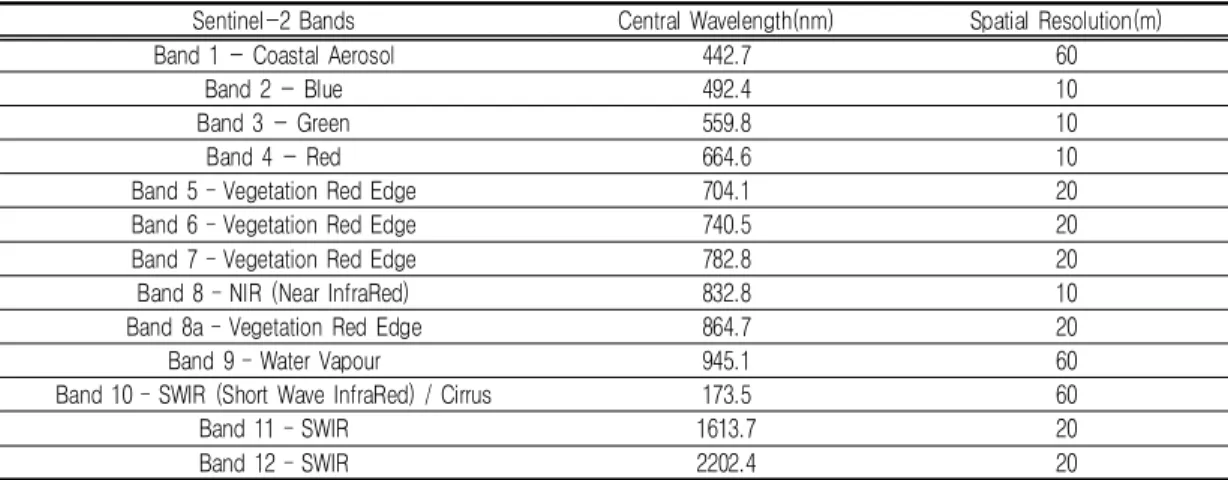
Sentinel-2 Bands Central Wavelength(nm) Spatial Resolution(m)
Band 1 - Coastal Aerosol 442.7 60
Band 2 - Blue 492.4 10
Band 3 - Green 559.8 10
Band 4 - Red 664.6 10
Band 5 – Vegetation Red Edge 704.1 20
Band 6 – Vegetation Red Edge 740.5 20
Band 7 – Vegetation Red Edge 782.8 20
Band 8 – NIR (Near InfraRed) 832.8 10
Band 8a – Vegetation Red Edge 864.7 20
Band 9 – Water Vapour 945.1 60
Band 10 – SWIR (Short Wave InfraRed) / Cirrus 173.5 60
Band 11 – SWIR 1613.7 20
Band 12 – SWIR 2202.4 20
TABLE 1. Metadata of Sentinel-2 satellite image used in this research(ESA, 2021)
시기 위성영상을 사용하여 연안 간석지 변화를탐지하였다.
일반적으로 연안습지는 연안지역에서 해수면 과 육지가 접하는 경계에 위치하는 지형적인 특 징을 가지고 있으며, 연안습지를 구성하고 있는 모래, 암반, 자갈 등은 내륙 지역에도 위치하여 영상자료의 분광 밴드가 제공하는 토지피복 정 보만을 활용할 경우 연안습지와 내륙의 경계를 설정하는데 어려움이 있어 대규모 연안습지의 면적을 산출 업무에 한계가 있다. 본 연구에서 는 위성영상의 분광 밴드가 제공하는 토지피복 정보와 DEM(Digital Elevation Model)이 제공 하는 지형 정보를 접목하여 연안습지 탐지를 위 한 효과적인 기술을 개발하였다.
연구 방법
1. 연구 대상 지역 및 연구 자료
본 연구에서는 대규모 연안습지가 광범위하게 분포하고 있으며 최근 10년(2010~2019)간 평 균 해수면 상승률 연 1.79㎜인 우리나라 서해안 (MOF(Ministry of Oceans and Fisheries), 2021)의 곰소만을 2021년 3월 23일에 촬영한 Sentinel-2 위성영상(구름 포함량 10% 이하)과 EarthExplorer 포털(https://earthexplorer.usgs.
gov/)을 통해 2014년 9월 23일부터 배포된
SRTM DEM을 사용하였다.
Sentinel-2 위성영상은 유럽우주항공국(ESA:
European Space Agency)이 2015년 6월 23 일 발사한 Sentinel-2A 인공위성과 2017년 3 월 7일에 발사한 Sentinel-2B 인공위성에 탑 재한 MSI(MultiSpectral Instrument) 센서에 의해 제공되는 위성영상으로서 동일지역을 10 일(한 개의 위성) 또는 5일(두 개의 위성) 간격 으로 획득할 수 있다(ESA, 2021). 본 연구에 서는 위성영상의 촬영 시기와 기상 조건 등을 고려하여 Sentinel-2A 위성이 제공한 위성영 상을 사용하였다. Sentinel-2 위성영상은 총 12개의 다중분광 밴드로 구성되어 있으며, Sentinel-2 위성영상의 메타데이터는 표 1에서 확인할 수 있다.
SRTM(Shuttle Radar Topography Mission) DEM은 2000년 2월에 미국 국립지리정보국 (NGA: National Geospatial-Intelligence Agency) 과 미국 항공우주국(NASA: National Aeronautics and Space Administration)의 협력으로 추진 된 SRTM 미션을 통해 제작된 글로벌 DEM으 로서 30~90m의 공간 해상도를 가지고 있으며, ASTER DEM 등 다른 글로벌 DEM에 비해 상 대적으로 높은 수직 정확도를 가지고 있다 (Park et al., 2017). 연구대상 지역으로 선정 된 우리나라 서해안 곰소만 지역을 촬영한 Sentinel-2 위성영상과 SRTM DEM은 그림 1
FIGURE 1. Sentinel-2 satellite image and SRTM DEM acquired in the selected study area, Gomsoman Bay of Republic of Korea shown in Open Street Map 에서 확인할 수 있으며 두 자료는 WGS(World
Geodetic System) 84 / UTM(Universal Transverse Mercator) 52N 좌표계로 투영되었다.
그림 1에서 보는 바와 같이, 테스트베드로 선 정된 지역은 곰소만 연안습지(Gomsoman Bay) 외에도 인근지역에 내륙습지이자 산지습지인 운 곡습지(Ungok Wetland)도 위치하고 있음을 확 인할 수 있다.
2. 연구 방법
본 연구에서는 연안습지는 구성하고 있는 주 요 물질들(모래, 자갈 등)로 인해 토지피복의 관점에서 연안습지는 육지로 분류될 수 있으나, 지형적인 관점에서는 해수면에 접하고 있으며 만조 시에는 해수면 아래에 위치하게 됨으로써 해수면 아래 지역으로 분류된다고 전제하였다.
이 전제를 기반으로 Sentinel-2 위성영상과 SRTM DEM에 적절한 임계값(thresholds)들을 개별적으로 적용하여 Sentinel-2 위성영상으로 부터 물과 육지를 구분할 수 있는 이진화 영상 을 제작하였으며 SRTM DEM 으로부터 해수면 아래와 해수면 위 지역을 구분할 수 있는 이진 화 영상을 제작하였고, 중첩 분석을 적용하여
이진화 영상 기반 연안습지 지도를 제작하였다.
본 연구의 전체적인 흐름은 그림 2에서 확인할 수 있다.
FIGURE 2. Flowchart showing the procedure for detecting the coastal wetlands using the given Sentinel-2 satellite image and
the SRTM DEM
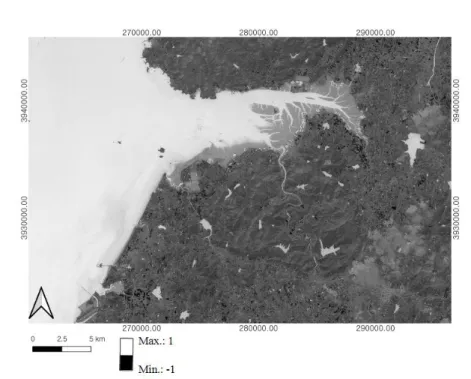
정규 수분 지수(NDWI: Normalized Difference Water Index)는 다중분광 밴드의 조합으로 제 작할 수 있으며 광학 영상에서 물과 육지를 구 분하는데 주로 사용된다(Choung et al., 2021).
본 연구에서는, 그림 2에서 보는 바와 같이,
FIGURE 3. NDWI image generated by using Green/NIR bands of the given Sentinel-2 satellite image
Sentinel-2 위성영상의 다중분광 밴드를 식 1 에 적용하여 정규 수분 지수를 제작하였다 (Choung and Jo, 2017; Choung et al., 2021).
N D W I =
(1)
식 1에서 Sentinel Band 3은 Green 밴드, Sentinel Band 8은 근적외선(NIR, Near Infrared) 밴드를 의미하며, 식 1을 사용하여 제작한 NDWI 영상은 그림 3에서 확인할 수 있다.
그림 3에서 보는 바와 같이, 주어진 Sentinel -2 위성영상의 Green/NIR 밴드를 활용하여 제 작한 NDWI 영상에서는 식 1의 연산에 의해 픽 셀의 최대 밝기값 및 최초 밝기값은 각각 1 및 –1이다. 일반적으로 NDWI 영상에서 픽셀의 밝 기값이 1에 가까울수록 물(수체)을 의미하고 –1 에 가까울수록 모래, 자갈, 점토 등을 포함한 육 지 지역을 의미하며 Choung and Jo(2016)은
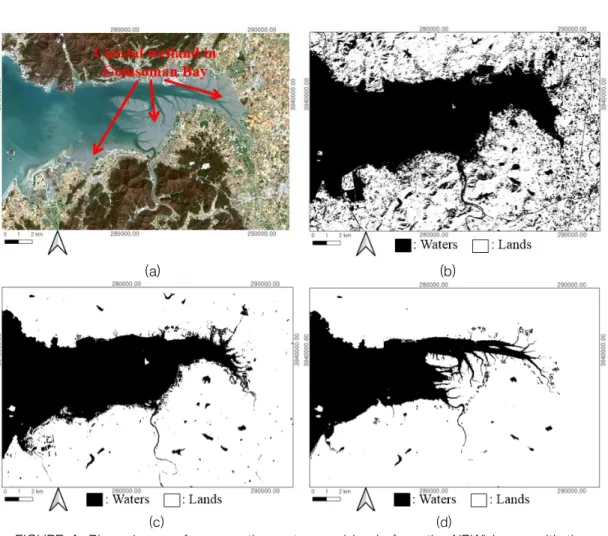
NDWI 임계값을 0으로 설정하여 NDWI 영상으 로부터 물과 육지를 구분하였다(Choung and Jo, 2016). 본 연구에서는 NDWI 영상에서 토 지피복 관점에서 연안습지를 포함한 육지와 물 을 구분하기 위해 임계값을 –0.2, 0, 0.2를 적 용하여 물과 육지를 구분할 수 있는 이진화 영 상(binary image)을 개별적으로 제작하였고, 물과 육지를 높은 정확도로 구분한 이진화 영상 을 육안으로 판단하였다(그림 4).
그림 4에서 보는 바와 같이 NDWI 영상에 임계값 0.2를 적용하여 제작한 이진화 영상이 임계값 0 또는 –0.2를 적용하여 제작한 이진화 영상보다 연안습지, 식생, 도심, 나지를 포함한 육지와 바다, 호수, 하천을 포함한 물을 상대적 으로 명확하게 구분하였다는 사실을 육안으로 확인할 수 있으므로 본 연구에서는 NDWI 영상 으로부터 물과 육지를 구분하기 위한 임계값을 0.2로 설정하였다.
본 연구에서는 SRTM DEM에서 지형적인 관 점에서 해수면 아래와 해수면 위 지역을 구분하
(c) (d)
FIGURE 4. Binary images for separating waters and lands from the NDWI image with the thresholds –0.2, 0, 2:
(a) Sentinel-2 satellite image, (b) Binary image with the NDWI threshold –0.2, (c) Binary image with the NDWI threshold 0, (d) Binary image with the NDWI threshold 0.2
(a) (b)
기 위해 평균 해수면 높이인 0m를 임계값으로 설정하였고, 이를 SRTM DEM에 적용하여 해 수면 위/아래 지역을 구분한 이진화 영상을 제 작하였다(그림 5).
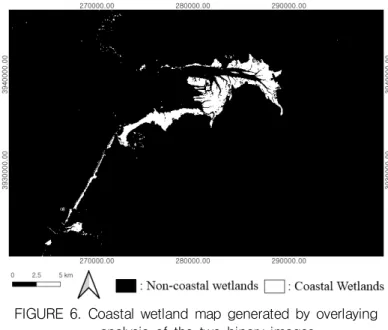
그림 4의 이진화 영상과 그림 5(b)의 이진화 영상에 중첩분석을 적용하여 토지피복 관점에서 육지에 분류되며 지형적인 관점에서 해수면 아 래 지역으로 분류되는 연안습지를 탐지할 수 있 는 이진화 영상 기반 연안습지 지도를 최종적으 로 제작하였고 그림 6에서 확인할 수 있다.
결과 및 고찰
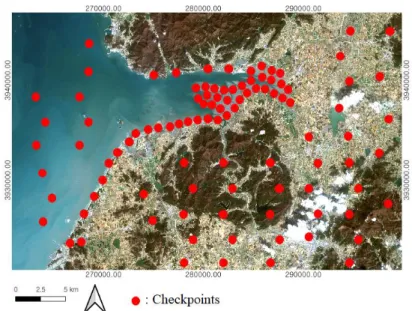
본 연구에서는 Sentinel-2 위성영상과 SRTM DEM을 사용하여 제작한 이진화 영상 기반 연안습지 지도(그림 6)의 정확도를 측정하 기 위해 연안습지 지역과 물, 육지 등 그 외 지 역에 위치한 총 100개의 검사점(checkpoints:
연안습지 50개, 그 외 지역 50개)을 이용하여 그림 6의 이진화 영상 기반 연안습지 지도에 대 한 오차행렬(error matrix)을 작성하였다. 그림 7은 그림 6의 이진화 영상 기반 연안습지 지도 의 정확도를 검증하기 위해 이용한 100개의 검
FIGURE 6. Coastal wetland map generated by overlaying analysis of the two binary images
FIGURE 5. SRTM DEM (a) and the binary image (b) for separating the upper sea level areas and the under sea level areas from the SRTM DEM
사점의 위치를 보여주며, 오차 행렬을 사용하여 산출한 이진화 영상 기반 연안습지 지도의 정확 도는 표 2에서 확인할 수 있다.
표 2의 오차 행렬에서 보이는 바와 같이, Sentinel-2 위성영상의 Green / NIR 밴드를 사용하여 제작한 NDWI 영상으로부터 추출한
물(waters)/육지(lands) 이진화 영상과 SRTM DEM을 사용하여 제작한 해수면 위/해수면 아 래 이진화 영상에 중첩 분석을 적용하여 제작한 그림 6의 이진화 영상 기반 연안습지 지도의 정 확도는 94%로서 매우 높은 정확도를 보여주었 으며, 연안습지가 그 외 지역으로 오분류 되는
FIGURE 7. Locations of the 100 checkpoints for measuring the accuracy of the generated coastal wetland map shown in
FIGURE 6
Class Coastal wetlands
(Reference)
Other areas
(Reference) Total User’s accuracy
Coastal wetlands
(Classification) 49 5 54 90.7%
Other areas
(Classification) 1 45 46 97.8%
Total 50 50 100
Producer’s accuracy 98% 90% 94%
(overall)
TABLE 2. Accuracy of the coastal wetland map shown in FIGURE 6
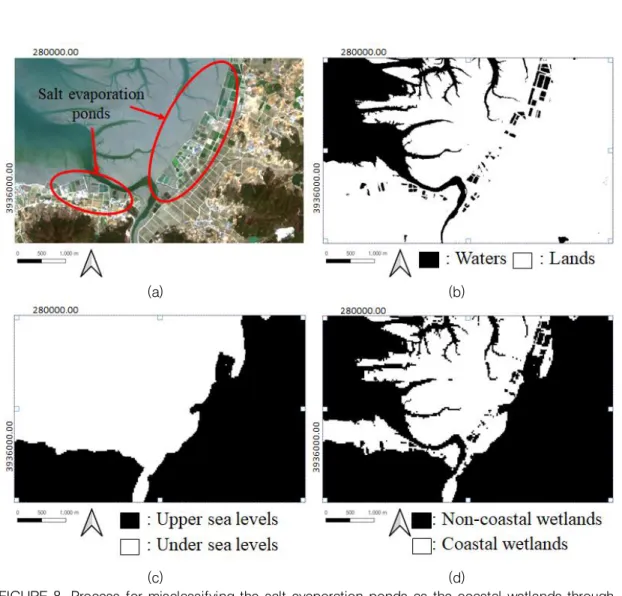
경우는 1건만 발생하였고 그 외 지역이 연안습 지로 오분류 되는 경우는 5건이 발생하였다. 이 는 곰소만에 위치한 일부 염전(salt evaporation ponds) 지역이 토지피복 특성으로 인해 NDWI 영상에서 육지 지역으로 분류되었으며 연안습지 에 인접한 염전 지역의 지형 특성으로 인해 SRTM DEM에서 해수면 아래 지역으로 분류되 어 중첩 분석을 통해 최종적으로 연안습지로 분 류되었기 때문이다(그림 8).
그림 8에서 보는 바와 같이 곰소만 연안 지 역에 위치한 일부 염전 지역은 그림 8(b)의 NDWI 기반 이진화 영상에서 육지로 분류되었
으며 그림 8(c)의 SRTM DEM 기반 이진화 영 상에서 해수면 아래 지역으로 분류되었고, 두 이진영상을 중첩 분석하여 제작된 그림 8(d)의 이진화 영상에서 최종적으로 연안습지로 오분류 (misclassification) 되었다.
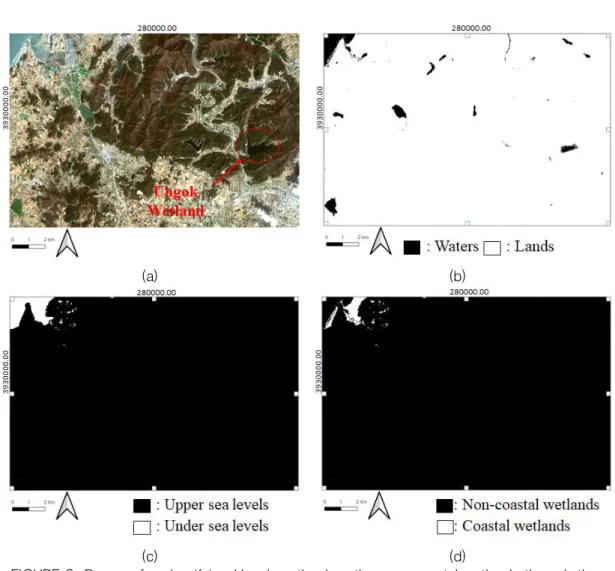
또한 본 연구를 통해 제작한 이진화 영상 기 반 연안습지 지도에서 곰소만 지역의 연안습지 는 대부분 탐지되지만 연안습지가 아닌 인근지 역의 내륙습지/산지습지 등은 탐지되지 않았다 는 사실을 확인하였으며, 그림 9는 본 연구에서 제안한 방법을 적용하여 곰소만 연안습지의 인근 지역인 선운산 도립공원의 내륙습지이자 산지습
(c) (d)
FIGURE 8. Process for misclassifying the salt evaporation ponds as the coastal wetlands through the proposed methodology: Locations of the salt evaporation ponds shown in the given Sentinel-2 satellite image, (b) Binary image generated from the NDWI image, (c) Binary image generated from the SRTM DEM, and (d) Binary image finally generated by overlaying analysis
for separating the coastal wetlands and non-coastal wetlands (a) (b)
지인 운곡습지 지역을 탐지한 결과를 보여준다.
그림 9에서 보는 바와 같이 연안습지가 아닌 내륙습지이자 산지습지인 운곡습지는 그림 9(b) 의 NDWI 기반 이진 영상에서 물로 분류되었으 나 그림 9(c)의 SRTM DEM 기반 이진영상에 서 해수면 위 지역으로 분류되었으므로, 두 이 진영상을 중첩 분석하여 제작된 그림 9(d)의 이 진영상에서 최종적으로 비연안습지(non-coastal wetlands)로 분류되었다. 결론적으로 본 연구를
통해 제작한 이진화 영상 기반 연안습지 지도에 서는 대규모 습지가 분포한 지역에서 내륙습지 나 산지습지는 탐지되지 않고 연안습지가 높은 정확도로 탐지되었음을 확인할 수 있었다.
결 론
본 연구에서는 우리나라 서해안 곰소만 지역 에 위치한 대규모 연안습지를 Sentinel-2 위성
(a) (b)
(c) (d)
FIGURE 9. Process for classifying Ungok wetland as the non-coastal wetlands through the proposed methodology: Location of Ungok wetland shown in the given Sentinel-2 satellite image, (b) Binary image generated from the NDWI image, (c) Binary image generated from the SRTM DEM, and (d) Binary image finally generated by overlaying analysis for separating the
coastal wetlands and non-coastal wetlands 영상과 SRTM DEM을 활용하여 높은 정확도로
탐지할 수 있는 효과적인 기술을 제안하였으며, 본 연구에서 제안한 기술을 사용하여 탐지한 연 안습지의 정확도는 94%로서 기존 연구에서 Jang et al.(2010)이 탐지한 연안습지의 정확 도인 85%를 상회하는 결과를 획득하였다. 기존 연구에서는 위성영상, 항공사진 등 단일 센서를 활용하여 획득한 공간정보자료만을 활용하여 연 안습지 조사 및 탐지 연구를 진행하였으나, 연
안습지의 육지에 가까운 토지피복 특성과 해수 면에 인접하게 위치한 연안습지의 지형적인 특 성을 고려했을 때 단일 센서보다 다중센서를 사 용하는 것이 효과적임을 본 연구에서 증명하였 다. 또한 수치지형도의 해안선 레이어가 없는 지역에 위치한 연안습지의 탐지 업무에도 활용 될 수 있어 본 연구의 중요성은 매우 크다고 판 단된다. 그러나 Sentinel-2 인공위성은 동일한 지역을 일정한 주기로 방문하므로 만조 및 간조
시점에 따라 달라질 수 있는 연안습지의 정확한 경계 및 면적 등을 정량적으로 계산하는데 한계 가 있다. 추후 연구에서는 만조 및 간조 시점에 획득한 시계열 위성영상을 활용하여 연안습지의 정확한 공간적 경계와 면적을 산출할 계획이다.
REFERENCES
Blanchette, M., A. N. Rousseau and M. Poulin.
2018. Mapping wetlands and land cover change with Landsat archives: the added value of geomorphologic data. Canadian Journal of Remote Sensing 44(4):337-356.
Choung, Y.J., K.S., Kim, I.S. Park and I.Y.
Chung. 2021. Detection of surface water bodies in Daegu using various water indices and machine learning technique based on the Landsat-8 satellite image.
Journal of the Korean Association of Geographic Information Studies 24(1):1- 11 (정윤재, 김경섭, 박인선, 정연인. 2021.
Landsat-8 위성영상 기반 수분지수 및 기계 학습을 활용한 대구광역시의 지표수 탐지. 한 국지리정보학회지 24(1):1-11).
Choung, Y.J. and M.H. Jo. 2016. Shoreline change assessment for various types of coasts using multi-temporal Landsat imagery of the east coast of South Korea. Remote Sensing Letters 7(1):91- 100.
Choung, Y.J. and M.H. Jo. 2017. Comparison between a machine-learning-based method and a water-index-based method for shoreline mapping using a high- resolution satellite image acquired in Hwado island, South Korea. Journal of Sensors 2017:1-13.
European Space Agency(ESA). 2021.
Sentinel-2. https://www.esa.int/Applications/
Observing_the_Earth/Copernicus/Sentinel -2 (Accessed June 06, 2021).
Jang, D.H., C. Kim and J.H. Park. The land-cover changes and pattern analysis in the tidal flats using post-classification comparison method: the case of Taean peninsula region. Journal of the Korean Geographical Society 45(2):275-292 (장 동호, 김찬수, 박지훈. 2010. 선분류 후비교 법을 이용한 간석지의 토지피복 변화 및 패턴 분석-태앙반도 지역을 사례로-. 대한지리학 회지 45(2):275-292).
Jo, M.H. 2005. Analyzing the spectral characteristics and detecting the change of tidal flat area in Seo han bay, North Korea using satellite images and GIS.
Journal of the Korean Association of Geographic Information Studies 8(2):44- 54 (조명희. 2005. 위성영상과 GIS를 이용 한 북한 서한만 지역의 간석지 분광특성 및 변화 탐지. 한국지리정보학회지 8(2):44-54).
Korea National Park. 2021. Research for coastal wetlands. https://www.knps.or.kr/
portal/main/contents.do?menuNo=800032 2# (Accessed May 10, 2021).
Korea Wetland Society. 2016. Wetland. Life Science Publishing Co., Seoul, pp.590 (안 경수, 김형수, 김재근. 2016. 습지학, 590 쪽, 라이프사이언스, 서울).
Lee H.R. and J.B. Lee. 2005. Monitoring spatiotemporal changes of tidal flats in Go-gunsan islands by environmental factors using satellite images. Journal of the Korean Association of Geographic Information Studies 8(3):34-43 (이홍로, 이재봉. 2005. 위성영상을 활용한 환경 요인
64-73).
Ministry of Oceans and Fisheries(MOF). 2021.
MOF news. https://www.mof.go.kr/iframe/
article/view.do?boardKey=10&menuKey=
376¤tPageNo=1&articleKey=3658 0 (Accessed June 06, 2021).
Munyati, C. 2000. Wetland change detection on the kafue flats, Zambia, by classification of a multitemporal remote sensing image
경학회지 22(6):120-128).
Pressian. 2021. Significance of mudflat.http s://www.pressian.com/pages/articles/7157 9#0DKU (Accessed May 10, 2021).
Weng, Q. 2002. Land use change analysis in the Zhujiang delta of China using satellite remote sensing, GIS and stochastic modelling.
Journal of Environmental Management 64:273-284.