기관별․개인별 논문 분석을 통한 자율주행 자동차의 계량정보 분석
박종규*․최정단**․배영철***
Scientometric Analysis of Autonomous Vehicle through Paper Analysis of each Organization and Author
Jong-Kyu Park*․Jeong-Dan Choi**․Young-Chul Bae***
요 약
본 논문에서는 자율 주행 자동차의 연구 방향을 결정하기 위한 기관별·개인별 논문 분석을 통한 계량정보 분석을 검토한다. 기관별·개인별 논문 수 분석, 수준 분석, 국제협력연구 네트워크 분석, 핵심 기관과 개인의 Q-L분포를 이용하여 자율 주행 자동차의 연구 동향을 확인한다.
ABSTRACT
In this paper, we review scientometric analysis through paper analysis of each organization and author to decide research direction for autonomous driving vehicles. We confirms research trend of autonomous driving vehicle by using number of papers.
Analysis of Index Level, International Cooperation Research Network, Analysis of Key and Q-L distribution according to each organization and author.
키워드
Scientometric analysis, Autonomous driving vehicle, Index level, International cooperation Research network, Analysis of key, Q-L distribution
계량정보분석, 자율 주행 자동차, 수준 분석, 국제협력연구네트워크, 핵심 분석, Q-L 분포
* 한국과학기술정보연구원([email protected]) ** 한국전자통신연구원([email protected])
*** 교신저자 : 전남대학교 전기․전자통신․컴퓨터 공학부([email protected])
접수일자 : 2012. 12. 15 심사(수정)일자 : 2013. 01. 10 게재확정일자 : 2013. 02. 20
Ⅰ. Introduction
Recently scientometric analysis has been widely conducted by many researchers before the start of their research. Many researchers seriously consider the novelty of their subject compared with other researchers’ subjects. Many researchers in engi- neering or related areas have a difficult time disco-
vering unique and reasonable research themes due to the more than two million peer-reviewed papers published every year.
To avoid duplication problem in patents, papers and research subjects, many researchers have to review previous research work and patents with various methods [1-14]. Among those methods, scientometric analysis in global dimensions has
R* *O NP* RA* (%)
1 USN 44 2.76
2 USAF 40 2.51
3 Cranfield Univ 30 1.88
3 MIT 30 1.88
5 Brigham Young Univ 26 1.63
5 Georgia Inst Technol 26 1.63
7 Seoul Natl Univ 25 1.57
8 Univ Sydney 24 1.51
9 Technion Israel Inst
Technol 19 1.19
10 Politecn Torino 18 1.13
10 Univ Calif Berkeley 18 1.13
* R : Ranking, * O : Organization,
* NP : Number papers, * RA: Ratio emerged as one of the best review methods for
avoiding duplication in science and technology areas. However, there are very few papers applied with scientometric analysis for information retrieval.
In this paper, we review scientometric analysis through paper analysis of each organization and author to decide research direction for autonomous vehicles. We confirms research trend of autonomous vehicle by using number of papers. Analysis of Index Level, International Cooperation Research Network, Analysis of Key and Q-L distribution according to each organization and author.
Ⅱ. Scientometric Analysis through Index Level at each Organization for Autonomous
Vehicle
2.1 Analysis of each organization
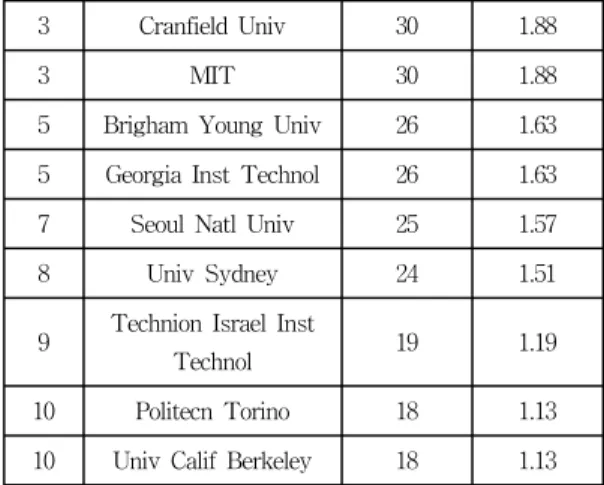
As a result of analysis for author’s nationality of published paper in Web of Science for unmanned vehicle during 2001-2011, this subject has been performed by 1,087 organizations including Uni- versity, research institute and company through the world. During these periods USN has been the largest published 44 and account 2.76 percent among these organizations. The second and third largest published organizations are USAF and Cranfield University, its organizations has been published 40 papers, 2.51% and 30 papers, 1.88%, respectively. In Republic of Korea, Seoul National University has published total 25 papers, 1.57%, it ranked 7thintheworld.
Table 1 shows distribution of each organization for published papers during 2001-2011.
Table 1. Distribution of each organization papers published during 2001-2011
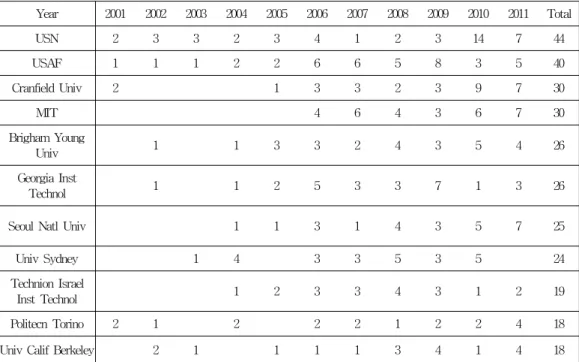
Table 2 and Fig. 1 show the number of pub- lished papers of each organization and author during 2001-2011, respectively.
Fig. 1 Number of papers each organization published during 2001-2011
2.2 Analysis of index level for each orga- nization[5]
We calculate index level for each country by using equation[5]. Table 2 and Fig. 1 show the index level of published for each organization respectively.
*O *NP *IP *IL Brigham
Young Univ 26 17.077 3.695
Univ Calif
Berkeley 18 16.944 3.667
USN 44 6.568 1.421
Univ Sydney 24 6.542 1.416
Georgia Inst
Technol 26 5.231 1.132
MIT 30 5.2 1.125
Table 2. Number of paper of each organization published during 2001-2011
Year 2001 2002 2003 2004 2005 2006 2007 2008 2009 2010 2011 Total
USN 2 3 3 2 3 4 1 2 3 14 7 44
USAF 1 1 1 2 2 6 6 5 8 3 5 40
Cranfield Univ 2 1 3 3 2 3 9 7 30
MIT 4 6 4 3 6 7 30
Brigham Young
Univ 1 1 3 3 2 4 3 5 4 26
Georgia Inst
Technol 1 1 2 5 3 3 7 1 3 26
Seoul Natl Univ 1 1 3 1 4 3 5 7 25
Univ Sydney 1 4 3 3 5 3 5 24
Technion Israel
Inst Technol 1 2 3 3 4 3 1 2 19
Politecn Torino 2 1 2 2 2 1 2 2 4 18
Univ Calif Berkeley 2 1 1 1 1 3 4 1 4 18
In the index level of organizations, Brigham Young University gets the highest value of 3.695 meaning that this organization shows the highest qualities of papers in citation areas. The orga- nizations with index level above average are Brigham Young University (3.695), University California Berkeley (3.667), USN(1.421), University Sydney(1.416), Georgia Institute Technology (1.132), MIT(1.125) and USAF(1.033).
2.3 Analysis of index level for each orga- nization[5]
We calculate index level for each country by using equation[5]. Table 3 and Fig. 2 show the index level of published for each organization respectively.
In the index level of organizations, Brigham Young University gets the highest value of 3.695 meaning that this organization shows the highest
nizations with index level above average are Brigham Young University (3.695), University California Berkeley (3.667), USN(1.421), University Sydney(1.416), Georgia Institute Technology (1.132), MIT(1.125) and USAF(1.033).
Table 3. Index level of each organization papers published during 2001-2011
USAF 40 4.775 1.033 Politecn
Torino 18 3.611 0.781
Technion Israel Inst
Technol 19 3.105 0.672
Cranfield
Univ 30 2.533 0.548
Seoul Natl
Univ 25 1.92 0.415
* O : Organization, * NP : Number papers
* IP : Impact factor, * IL : Index level
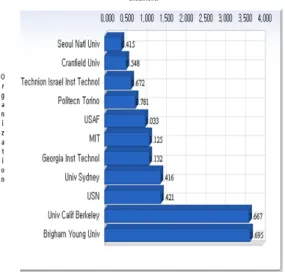
Fig. 2 Index level of each organization papers published during 2001-2011
Fig. 3 shows international cooperation research network for each organization[5].
2.4 Analysis of international cooperation res- earch network for each organization [5]
In order to study International Cooperation Research Relationship, we investigate International Cooperation Research Network between countries and Relationship index of international coope- ration(S) and Intensity of International Cooperation (L) in organizations.
Fig. 3 Index level versus number of papers of each organization in unmanned vehicle
In order to calculate international cooperation research relationship between organizations, we introduce the concept of the Relation Index of Inte- rnational Cooperation(S) and Intensity of Inte- rnational Cooperation (L).
We apply Relation Index of International Coop- eration[S]] an and Intensity of International Coo- peration (L) in organizations[5].
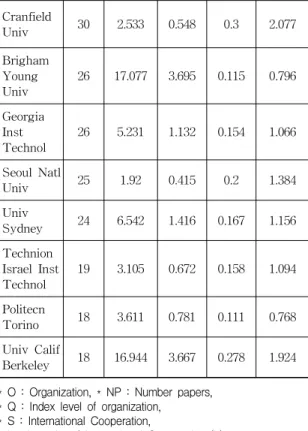
From equation in [5], we get the Relation Index of International Cooperation(S) and Intensity of International Cooperation (L) for organizations is shown in Table 4.
As a result of analysis of Intensity of Inter- national Cooperation (L) for organizations from Table 4, MIT appear to have the highest point of 2.077 which is the top among the organization for unmanned vehicle research. The organizations have above average as follows: MIT(2.077), Cranfield University (2.077), University California Berkeley (1.924), USN(1.419), USAF(1.384), Seoul National University(1.384), University Sydney(1.156), Tech- nion Israel Institute Technology(1.094), Georgia Institute Technology(1.066).
*O *NP *L *S
MIT 30 0.3 2.077
Cranfield Univ 30 0.3 2.077
Univ Calif
Berkeley 18 0.278 1.924
USN 44 0.205 1.419
USAF 40 0.2 1.384
Seoul Natl Univ 25 0.2 1.384
Univ Sydney 24 0.167 1.156
Technion Israel Inst
Technol 19 0.158 1.094
Georgia Inst
Technol 26 0.154 1.066
Brigham
Young Univ 26 0.115 0.796
Politecn Torino 18 0.111 0.768
* O : Organization, * NP : Number papers,
* S : International Cooperation,
* L : Intensity of International Cooperation (L)
*O *NP CPP Q S L
USN 44 6.568 1.421 0.205 1.419
USAF 40 4.775 1.033 0.2 1.384
MIT 30 5.2 1.125 0.3 2.077
Cranfield
Univ 30 2.533 0.548 0.3 2.077
Brigham Young Univ
26 17.077 3.695 0.115 0.796
Georgia Inst Technol
26 5.231 1.132 0.154 1.066
Seoul Natl
Univ 25 1.92 0.415 0.2 1.384
Univ
Sydney 24 6.542 1.416 0.167 1.156
Technion Israel Inst Technol
19 3.105 0.672 0.158 1.094
Politecn
Torino 18 3.611 0.781 0.111 0.768
Univ Calif
Berkeley 18 16.944 3.667 0.278 1.924
* O : Organization, * NP : Number papers,
* Q : Index level of organization,
* S : International Cooperation,
* L : Intensity of International Cooperation (L) Table 4. Relation Index of International cooperation(S)
and Intensity of International cooperation(L) for organization
2.5 Q-L distribution for selection of key org- anization
Selection of key organizations is accomplished using the result of analysis of Index Level of organization (Q) and Intensity of International Cooperation (L). Index level of organization (Q) and Intensity of International Cooperation (L) can be classified in four areas (I-IV) as reference Q=L=1.
Table 5 and Fig. 4 shows Q-L distribution to select key organizations in the autonomous vehicle.
Table 5. Q-L distribution to select key organization
Fig. 4 Q-L distribution to select key organization
Ⅲ. Scientometric Analysis through Index Level at each Author for Autonomous
driving Vehicle
In order to analysis index level of each author we define the ratio by following equation (1).
(1)
Where N is citation number per certain researcher has been published paper, A is average of citation number per total papers within research area.
Equation (1) evaluate the index of quality level.
When level index equal 1.0, it means that number of average citation published by certain researcher equals the number of average citation of number of total papers within related area. In case of level index exceed 1.0 it means number of average citation published by certain researcher higher the number of average citation of number of total papers within related area.
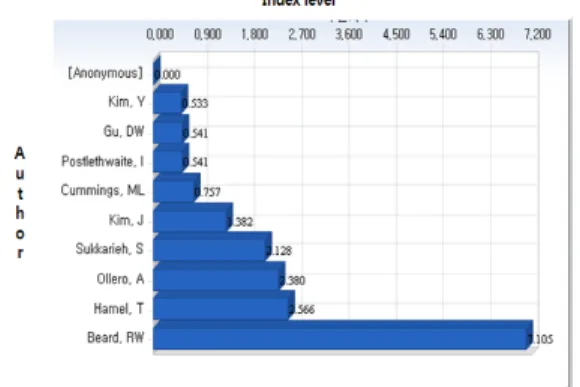
Table 6 and Fig. 5 shows level index of each author for published papers during 2001-2011.
Table 6. Index level of each author for published during 2001-2011
*AU *NP *IP *IL
Beard, RW 12 32.833 7.105
Hamel, T 14 11.857 2.566
Ollero, A 13 11 2.38
Sukkarieh, S 12 9.833 2.128
Kim, J 13 6.385 1.382
Cummings, ML 12 3.5 0.757
Postlethwaite, I 12 2.5 0.541
Gu, DW 12 2.5 0.541
Kim, Y 13 2.462 0.533
[Anonymous] 11 0 0
* AU : Author, * NP : Number papers
* IP : Impact factor, * IL : Index level
Fig. 5 Index level of each author for published during 2001-2011
As a result of level analysis of author we can realize Beard, RW(7.105), Hamel, T(2.566), Ollero, A(2.38), Sukkarieh, S(2.128), Kim, J(1.382) that are higher than average.
Fig. 6 displays number of papers versus level index of each author for published papers during 2001-2011.
Fig. 6 Number per papers versus index level of each author for published during 2001-2011
3.2 Analysis of international cooperation res- earch network for each author
In order to study International Cooperation Res- earch Relationship, we investigate International Cooperation Research Network between countries and Relationship index of international coop-
eration(S) and Intensity of International Cooperation (L) in authors.
From equation in [5], we get the Relation Index of International Cooperation(S) and Intensity of International Cooperation (L) for author is shown in Table 7.
Table 7. Relation Index of International cooperation(S) and Intensity of International cooperation (L) for author
*O *NP *L *S
Hamel, T 14 0.5 3.461
Kim, Y 13 0.308 2.132
Gu, DW 12 0.25 1.73
Postlethwaite, I 12 0.25 1.73
Kim, J 13 0.231 1.599
Cummings, ML 12 0.167 1.156
Beard, RW 12 0.167 1.156
Sukkarieh, S 12 0.083 0.575
Ollero, A 13 0.077 0.533
Anonymous 11 0 0
* O : Organization, * NP : Number papers,
* S : International Cooperation,
* L : Intensity of International Cooperation (L)
As a result of analysis of Intensity of Inte- rnational Cooperation (L) for organizations from Table 10, Hamel, T appear to have the highest point of 3.461 which is the top among the authors for unmanned vehicle research. The authors have above average as follows: Hamel, T(3.461), Kim, Y(2.132), Gu, DW(1.73), Postlethwaite, I(1.73), Kim, J(1.599), Cummings, ML(1.156), Beard, RW(1.156)
3.3 Analysis of key authors
Selection of key organizations and authors are accomplished using the result of analysis of Index Level of Authors (Q) and Intensity of International Cooperation (L). Index level of authors (Q) and
Intensity of International Cooperation (L) can be classified in four areas (I-IV) as reference Q=L=1.
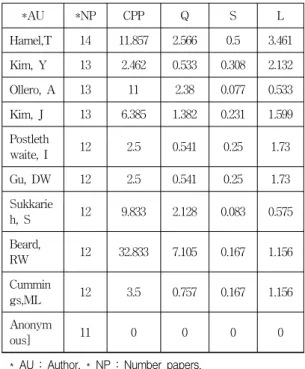
Table 8 and Fig. 7 shows Q-L distribution to select key authors in the unmanned vehicle, respectively.
Table 8. Q-L distribution to select key authors in the unmanned vehicle
*AU *NP CPP Q S L
Hamel,T 14 11.857 2.566 0.5 3.461
Kim, Y 13 2.462 0.533 0.308 2.132
Ollero, A 13 11 2.38 0.077 0.533
Kim, J 13 6.385 1.382 0.231 1.599
Postleth
waite, I 12 2.5 0.541 0.25 1.73
Gu, DW 12 2.5 0.541 0.25 1.73
Sukkarie
h, S 12 9.833 2.128 0.083 0.575
Beard,
RW 12 32.833 7.105 0.167 1.156
Cummin
gs,ML 12 3.5 0.757 0.167 1.156
Anonym
ous] 11 0 0 0 0
* AU : Author, * NP : Number papers,
* Q : Index level of organization,
* S : International Cooperation,
* L : Intensity of International Cooperation (L)
Fig. 7 Q-L distribution to select key author
Ⅳ. Conclusion
In this paper, we presented scientometric ana- lysis including Analysis of Index Level, Inte- rnational Cooperation Research Network, Analysis of Key Organizations and Authors and Q-L distribution by using Web of Science (Thomson Reuters). Through this presented method, we can review the research trend about autonomous vehicle including activity according to each organization and each author. Using this method, we need to find research direction in the future. In the future, more research is necessary to improve the results about scientometric analysis to properly apply them to real research environment.
Ⅴ. Acknowledgements
The analysis in this research was carried out by using the on-line information analysis system, COMPAS (COMPetitive Analysis Service), deve- loped by the Division of Information Analysis, Ko- rea Institute of Science and Technology Information.
REFERENCE
[1] The methodology of patent analysis to write the technical road map, MCIE(Ministry of Commerce, Industry and Energy) and KOTEF, 2006.
[2] H. Ernst, "Evaluation of Dynamical Techn- ological Developments by means of Patent data", Springer, New York, 1999.
[3] H. Ernst, " Patent portfolios for strategics R&D planning", Journal of Engineering and Technology Management, Vol. 15, pp. 279-308, 1998.
[4] Jong-Kyu Park,.Young-Chul Bae, "Develop- ment of a Technical Road Map for Future Research in Wind Power Generation using Grading Criteria as a Rubric for Research Focus", The Journal of The Korea Institute of
Electronic Communication Science, Vol. 6, No.
3, pp. 417-423. 2011.
[5] Jong-Kyu Park,.Young-Chul Bae, “Scientometric Analysis for Pilot Study of Smart Grid”, The Journal of The Korea Institute of Electronic Communication Science, Vol. 7, No. 1, pp.
97-105. 2012.
[6] Young-Duk Koo, Young-IL Kwon, Dae-Hyun Jeong, “Analysis of a Technical Competition based on Intellectual Property for Constitute of LED Knowledge Map”, The Journal of The Korea Institute of Electronic Communication Science, Vol. 7, No. 5, pp. 955-960. 2012.
[7] Young-Duk Koo, Dae-Hyun Jeong, Young-IL Kwon, “LED Knowledge Map through a Patent Application”, The Journal of The Korea Institute of Electronic Communication Science, Vol. 7, No. 5, pp. 961-966. 2012.
[8] Se-Jung Ahn, We Shim, June-Young Lee, Oh-Jin Kwon, Kyung-Ran Noh, “Trends Detection of Display Research Areas by Bibliometric Analysis”, The Journal of The Korea Institute of Electronic Communication Science, Vol. 7, No. 6, pp. 1343-1351, 2012.
[9] June-Young Lee, We Shim, Se-Jung Ahn, Oh-Jin Kwon, Kyung-Ran Noh,, “A Study on the Citation Impact of International Colla- boration Research for 13 Government- supported Research Institutes of Korea Res- earch Council of Fundamental Science and Technology(KRCF)”, The Journal of The Korea Institute of Electronic Communication Science, Vol. 7, No. 6, pp. 1353-1362, 2012.
[10] Se-Jung Ahn, Do-Hyun Kim, Oh-Jin Kwon, Young-Chul Bae, June-Young Lee, “Analysis on the Dynamics of Keyword Mapping for Detecting Emerging Technologies : A Case Study on Graphene“, The Journal of The Korea Institute of Electronic Communication Science, Vol. 7, No. 6, pp. 1393-1401, 2012.
[11] Sang-Yun Lee,Hong-Joo Yoon, “Korea's Global Science & Technology(S&T) Agenda”, The Journal of The Korea Institute of Electronic Communication Science, Vol. 7, No. 4, pp.
693-705, 2012.
[12] Sang-Yun Lee,Hong-Joo Yoon, “The Study on Development of Technology for Electronic Government of S. Korea with Cloud Com-
puting analysed by the Application of Scenario Planning”, The Journal of The Korea Institute of Electronic Communication Science, Vol. 7, No. 6, pp. 1245-1258, 2012.
[13] Sang-Yun Lee,Hong-Joo Yoon, “The Study on Strategy of National Information for Electronic Government of S. Korea with Public Data analysed by the Application of Scenario Planning”, The Journal of The Korea Institute of Electronic Communication Science, Vol. 7, No. 6, pp. 1259-1273, 2012.
[14] Sang-Yun Lee,Hong-Joo Yoon, “The Study of SWOT(Strength–Weakness-Opportunity- Thr- eat) Analysis for Micro-robot”, The Journal of The Korea Institute of Electronic Commu- nication Science, Vol. 7, No. 4, pp. 881-895, 2012.
저자 소개
박종규(Jong-Kyu Park)
1984년 2월 중앙대학교 전자공학과 (공학사)
1990년 2월 중앙대학교 전자공학과 (공학석사)
1991년~현재 : 한국과학기술정보연구원 선임연구원
※ 관심분야 : 로봇 제어, 모터 제어, 산업통신망
최정단(Jeong-Dan Choi)
1993년 2월 중앙대학교 전자계산학과 (공학사)
1995년 2월 중앙대학교 컴퓨터공학과 (공학석사)
2005년 2월 충남대학교 전산학(이학박사) 1995년~현재 : 한국전자통신연구원 책임연구원
※ 관심분야 : 영상처리 및 컴퓨터그래픽스, 자동차-IT, 텔레매틱스, ITS
배영철(Young-Chul Bae)
1984년 광운대학교 전기공학과(공 학사)
1986년 광운대학교대학원 전기공학과 (공학석사)
1997년 광운대학교대학원 전기공학과(공학박사) 1986년~1991년 한국전력공사
1991년~1997년 산업기술정보원 책임연구원
1997년~2006년 여수대학교 전자통신전기공학부 부교수 2002년~2002년 Brigham Young University 방문교수 2006년~현재 전남대학교 전기․전자통신․컴퓨터공학부 교수
2011년~2011년 University of Utah 방문교수
※ 관심분야 : Chaos Control and Chaos Robot, Robot control etc.