ISSN 2234-3806 • eISSN 2234-3814
http://dx.doi.org/10.3343/alm.2014.34.5.380
Customer Satisfaction Survey With Clinical Laboratory and Phlebotomy Services at a Tertiary Care Unit Level
Young Rae Koh, M.D.1, Shine Young Kim, M.D.1, In Suk Kim, M.D.1, Chulhun L. Chang, M.D.1, Eun Yup Lee, M.D.1, Han Chul Son, M.D.1, and Hyung Hoi Kim, M.D.1,2
Department of Laboratory Medicine1 and Biomedical Research Institute2, Pusan National University School of Medicine, Busan, Korea We performed customer satisfaction surveys for physicians and nurses regarding clinical
laboratory services, and for outpatients who used phlebotomy services at a tertiary care unit level to evaluate our clinical laboratory and phlebotomy services. Thus, we wish to share our experiences with the customer satisfaction survey for clinical laboratory and phlebotomy services. Board members of our laboratory designed a study procedure and study population, and developed two types of questionnaire. A satisfaction survey for clini- cal laboratory services was conducted with 370 physicians and 125 nurses by using an online or paper questionnaire. The satisfaction survey for phlebotomy services was per- formed with 347 outpatients who received phlebotomy services by using computer-aided interviews. Mean satisfaction scores of physicians and nurses was 58.1, while outpatients’
satisfaction score was 70.5. We identified several dissatisfactions with our clinical labora- tory and phlebotomy services. First, physicians and nurses were most dissatisfied with the specimen collection and delivery process. Second, physicians and nurses were dissatis- fied with phlebotomy services. Third, molecular genetic and cytogenetic tests were found more expensive than other tests. This study is significant in that it describes the first refer- ence survey that offers a survey procedure and questionnaire to assess customer satisfac- tion with clinical laboratory and phlebotomy services at a tertiary care unit level.
Key Words: Customer satisfaction survey, Clinical laboratory, Phlebotomy, Service
Received: March 4, 2014 Revision received: March 25, 2014 Accepted: July 28, 2014
Corresponding author: Hyung Hoi Kim Department of Laboratory Medicine, Pusan National University School of Medicine, 179 Gudeok-ro, Seo-gu,
Busan 602-739, Korea Tel: +82-51-240-7414 Fax: +82-51-247-6560 E-mail: [email protected]
© The Korean Society for Laboratory Medicine This is an Open Access article distributed under the terms of the Creative Commons Attribution Non-Commercial License (http://creativecom- mons.org/licenses/by-nc/3.0) which permits unrestricted non-commercial use, distribution, and reproduction in any medium, provided the original work is properly cited.
Customer satisfaction with clinical laboratory services is one of the most important quality indicators in laboratory medicine.
Measuring and improving customer satisfaction with clinical laboratory services are essential aspects of laboratory medicine management [1].
There are two major agencies that give accreditation to clinical laboratories, namely, the Joint Commission on Accreditation of Healthcare Organizations and the College of American Patholo- gists (CAP). The Joint Commission on Accreditation of Health- care Organizations requires data to be collected on the needs, expectations, and satisfaction of individuals and organizations [2]. The CAP also requires that physician and patient satisfaction with laboratory services being measured every 2 yr [3].
In this study, we designed a study procedure, defined a study
population, and developed a questionnaire for customer satis- faction survey at a tertiary care unit level to evaluate our clinical laboratory and phlebotomy services. We will share our findings regarding customer satisfaction surveys for clinical laboratory and phlebotomy services.
Satisfaction surveys for clinical laboratory and phlebotomy services were conducted at the department of laboratory medi- cine of Pusan National University Hospital from January to June 2012. Board members of department of our clinical laboratory medicine designed two kinds of customer satisfaction surveys with the help of marketing research specialists after referring to a published survey tool from the CAP Q-Probes program [4].
One was a satisfaction survey for clinical laboratory services with physicians and nurses, and the other was a satisfaction survey
Table 1. Clinical laboratory services satisfaction scores and percentage distributions
Questionnaire item Mean ± SD Agree (%) Average (%) Disagree (%) NA (%)
1. Laboratory information system
a. Laboratory test order system is convenient 68.5±22.8 60.1 27.5 11.7 0.7
b. Laboratory test search system is convenient 66.2±25.2 59.3 23.1 16.8 0.7
c. Reporting system of results is appropriate 66.9±22.9 60.4 25.3 13.6 0.7
2. Laboratory users' guidebook
a. Guidebook is useful 60.1±21.7 44.3 32.6 16.5 6.6
b. Guidebook is updated well 58.8±20.5 42.5 35.2 15.0 7.3
c. Guidebook provides reference intervals well 71.4±21.3 69.6 19.8 6.6 4.0
d. Guidebook details proper test preparation guidelines 54.3±22.9 39.6 30.8 25.6 4.0
e. Guidebook details specimen collection procedures 53.8±24.3 40.7 27.1 28.9 3.3
f. Guidebook indicates specialty of laboratory doctors 52.8±22.7 35.5 30.8 29.7 4.0
3. Critical value notification 69.0±20.0 65.5 24.8 7.3 2.4
4. Specimen collection and delivery process
a. Specimen collection for outpatients is convenient 48.2±22.3 29.3 30.0 37.7 2.9
b. Specimen collection for inpatients is convenient 55.3±21.6 39.2 32.6 23.4 4.8
c. Specimen collection of several tests is convenient 47.9±22.3 27.8 29.7 40.3 2.2
d. Specimen delivery process is convenient 38.4±22.9 15.8 26.7 54.6 2.9
5. Laboratory facilities and equipment
a. Laboratory has up-to-date testing machines 66.3±18.4 50.5 34.4 4.0 11.0
b. Laboratory has all necessary testing machines 60.9±19.6 41.8 36.6 9.9 11.7
c. Laboratory provides specimen collection tools 60.9±21.0 46.2 34.8 13.6 5.5
d. Automatic transportation system is convenient 53.3±27.6 39.9 23.8 29.7 6.6
e. Phlebotomy room provides proper environment 59.7±21.5 43.6 35.9 12.8 7.7
f. Blood components are provided well 55.4±21.7 38.1 35.5 20.9 5.5
6. Consignment laboratories
a. Quality of consignment laboratories 58.1±16.6 41.7 48.3 9.2 0.8
b. Turnaround time of consignment laboratories 45.6±23.0 26.7 30.8 42.5 0
c. Reliability of consignment laboratories 61.9±17.4 52.5 40.0 7.5 0
7. Phlebotomy services
a. Scheduled phlebotomy services 52.1±24.9 30.8 30.4 24.5 14.3
b. Irregular phlebotomy services 42.8±22.1 15.8 32.2 37.4 14.7
c. Emergency phlebotomy services 41.8±24.1 17.2 25.3 42.9 14.7
8. Turnaround time for test results
a. Turnaround time for inpatient test results 54.8±22.7 35.9 33.3 21.6 9.2
b. Turnaround time for outpatient test results 54.5±21.2 34.4 38.5 20.5 6.6
c. Turnaround time for emergency test results 54.7±23.7 39.2 31.5 26.4 2.9
d. Provision time for blood components 55.6±23.2 36.6 33.3 22.3 7.7
9. Quality of test results
a. Reliability of general test results 66.7±19.5 55.7 36.3 5.5 2.6
b. Reliability of special test results 67.6±20.0 59.7 31.1 5.9 3.3
c. Missing test results 68.7±26.3 67.8 12.8 16.5 2.9
d. Incorrect test results 55.3±27.9 46.2 17.2 31.9 4.8
(Continued to the next page)
for phlebotomy services with outpatients.
We randomly selected 370 physicians and 125 nurses from 25 clinics at Pusan National University Hospital. We also ran- domly selected 347 outpatients who received phlebotomy ser- vices after visiting one of the 25 clinics. We excluded pediatric and adolescent patients (<20 yr) as well as psychiatric patients.
The clinical laboratory services questionnaire for physicians and nurses consisted of 17 categories and 51 statements cover- ing a comprehensive range of clinical laboratory services (Table 1). The phlebotomy service questionnaire for outpatients con- sisted of six categories with 16 statements covering a compre- hensive range of phlebotomy services as (Table 2). We devel- oped these questionnaires using a 7-point Likert scale to pre- vent respondents’ scores from clustering near the average.
We sent online questionnaires to 370 physicians by e-mail.
They responded to the questionnaire by linking to a uniform re- source locator. We sent paper questionnaires to 125 nurses.
They responded to the questionnaire by writing directly on the
paper. We performed a satisfaction survey for phlebotomy ser- vices using computer-aided interviews with outpatients who had received phlebotomy services. We conducted face-to-face inter- views with every tenth patient per hour for 5 days. They re- sponded to the computer-based web questionnaire using a 7-point Likert scale.
All data were analyzed by using SPSS 13.0 (SPSS Inc., Chi- cago, IL, USA). Responses were given numerical ratings from 0 to 100 as follows: 0, strongly disagree; 16.6, disagree; 33.3, slightly disagree; 50, average; 66.6, slightly agree; 83.3, agree;
and 100, strongly agree. Results were analyzed by using a t-test for two-group analyses and a one-way ANOVA for more than three groups. A P value <0.05 was considered statistically sig- nificant.
The total number of respondents was 273. Of 370 physi- cians, 151 (40.8%) returned their responses to the online ques- tionnaire. Of 125 nurses, 122 (97.6%) returned their responses by paper questionnaire. The overall response rate for physicians Table 1. Continued
Questionnaire item Mean±SD Agree (%) Average (%) Disagree (%) NA (%)
10. Specialty of laboratory personnel
a. Specialty of laboratory doctors 70.9±17.9 70.0 25.6 3.3 1.1
b. Specialty of laboratory technologists 66.5±18.7 61.2 31.5 5.9 1.5
11. Responsiveness of laboratory personnel
a. Responsiveness of laboratory doctors 64.6±18.5 55.3 36.6 6.2 1.8
b. Responsiveness of laboratory technologists 59.5±20.2 45.8 39.6 13.2 1.5
c. Responsiveness of specimen delivery staff 55.5±21.0 35.2 46.5 16.5 1.8
12. Courtesy of laboratory personnel
a. Courtesy of laboratory doctors 63.6±20.1 52.0 38.1 8.1 1.8
b. Courtesy of laboratory technologists 58.9±21.6 44.7 38.8 15.0 1.5
c. Courtesy of specimen delivery staff 56.9±21.1 38.5 42.9 16.1 2.6
13. Communication with laboratory personnel
a. Communication is smooth 56.5±20.5 42.9 37.4 18.7 1.1
b. Personnel understand characteristics of my clinic 52.0±22.6 34.8 36.6 27.5 1.1
c. Personnel solve inconveniences at my clinic 54.4±21.0 37.4 41.8 19.8 1.1
14. Cost of laboratory tests
a. Hematology, Immunology, and Chemistry 55.0±22.4 37.0 35.5 24.2 3.3
b. Molecular genetics and Cytogenetics 48.5±24.7 30.0 30.4 36.3 3.3
c. Microbiology 56.6±21.2 38.1 39.2 18.7 4.0
15. Laboratory is cooperative for research tests 60.7±20.7 38.5 40.3 9.5 11.7
16. Overall satisfaction with laboratory services 61.4±18.5 50.9 39.9 9.2 0
17. Our laboratory is superior to other laboratories 61.7±18.3 48.0 43.2 8.1 0.7
Mean 58.1±12.2 43.3 33 19.4 4.3
Abbreviation: NA, not applicable.
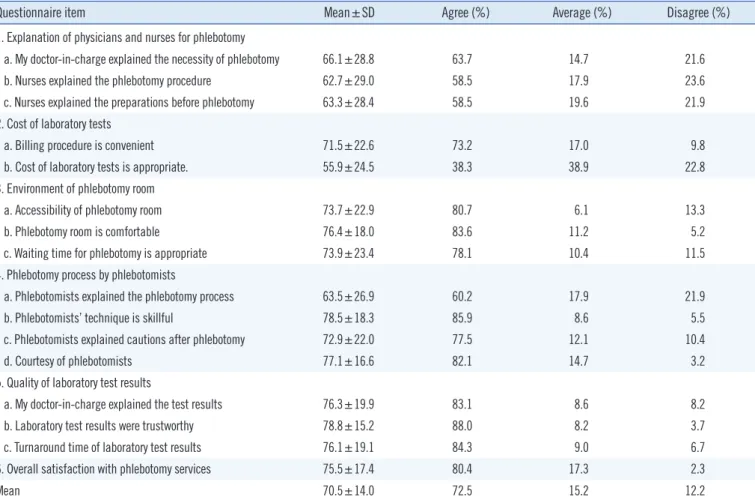
Table 2. Phlebotomy services satisfaction scores and percentage distributions
Questionnaire item Mean±SD Agree (%) Average (%) Disagree (%)
1. Explanation of physicians and nurses for phlebotomy
a. My doctor-in-charge explained the necessity of phlebotomy 66.1±28.8 63.7 14.7 21.6
b. Nurses explained the phlebotomy procedure 62.7±29.0 58.5 17.9 23.6
c. Nurses explained the preparations before phlebotomy 63.3±28.4 58.5 19.6 21.9
2. Cost of laboratory tests
a. Billing procedure is convenient 71.5±22.6 73.2 17.0 9.8
b. Cost of laboratory tests is appropriate. 55.9±24.5 38.3 38.9 22.8
3. Environment of phlebotomy room
a. Accessibility of phlebotomy room 73.7±22.9 80.7 6.1 13.3
b. Phlebotomy room is comfortable 76.4±18.0 83.6 11.2 5.2
c. Waiting time for phlebotomy is appropriate 73.9±23.4 78.1 10.4 11.5
4. Phlebotomy process by phlebotomists
a. Phlebotomists explained the phlebotomy process 63.5±26.9 60.2 17.9 21.9
b. Phlebotomists’ technique is skillful 78.5±18.3 85.9 8.6 5.5
c. Phlebotomists explained cautions after phlebotomy 72.9±22.0 77.5 12.1 10.4
d. Courtesy of phlebotomists 77.1±16.6 82.1 14.7 3.2
5. Quality of laboratory test results
a. My doctor-in-charge explained the test results 76.3±19.9 83.1 8.6 8.2
b. Laboratory test results were trustworthy 78.8±15.2 88.0 8.2 3.7
c. Turnaround time of laboratory test results 76.1±19.1 84.3 9.0 6.7
6. Overall satisfaction with phlebotomy services 75.5±17.4 80.4 17.3 2.3
Mean 70.5±14.0 72.5 15.2 12.2
Because of rounding, percentages may not total 100.
and nurses was 55.2%.
Physician and nurse satisfaction scores and the percentage distributions for each questionnaire are shown in Table 1. The overall mean satisfaction score was 58.1 (range, 38.4-71.4) out of 100. Among all questionnaire items, providing reference inter- vals and specialties of the laboratory doctors had means of >70.
Specimen collection and the delivery process, turnaround time for consignment tests, phlebotomy services, and cost of genetic tests had means <50. The >50-yr age group had a significantly higher mean score than that of other age groups using multiple comparison analysis among the 20-, 30-, 40-, and >50-yr age group (P =0.0001). The nurse group had a significantly higher score than the physician group (P =0.021). The direct or group had a significantly higher score than the other physician groups (P =0.0058). Respondents with >20 yr of employment at the hospital had significantly higher scores than those with <20 yr of experience (P =0.0312).
There were 347 total outpatient respondents; 233 were inter- viewed in the central phlebotomy room and 114 in the cancer
center phlebotomy room. The overall mean satisfaction score was 70.5 (range, 55.9-78.8). The means and SDs of the overall satisfaction scores for each questionnaire item are presented in Table 2. Among all questionnaire items, the phlebotomist’s tech- nique and reliability of the test results received the highest score, whereas the costs of laboratory tests received the lowest score. Scores for the cancer center phlebotomy room regarding accessibility of the phlebotomy room, the phlebotomist’s expla- nation of the phlebotomy process, and cautions after phlebot- omy were significantly higher than the satisfaction scores for the central phlebotomy room (Table 3).
The importance of customer satisfaction in driving quality im- provement has been increasing in laboratory medicine. Patients are the ultimate customers of laboratory medicine, but physi- cians and nurses are considered preferred internal customers.
Therefore, their opinions are essential to improve laboratory management [4].
In 1999, 2002, and 2007, CAP Q-Probes studies at multiple institutions performed satisfaction surveys for laboratory services
with physicians [4-6]. Participating institutions provided their survey results rated on a scale of 1 (poor) to 5 (excellent). The mean overall satisfaction scores for all institutions were 4.0 (range, 3.1-4.7), 4.0 (range, 3.0-4.6), and 4.1 (range, 2.9-5.0), respectively. In 2004, CAP Q-Probes studies at multiple institu- tions performed a satisfaction survey for laboratory services with nurses [7]. The mean overall satisfaction score for all institutions was 3.9 (range, 2.5-4.6). In 1990, 1994, and 1995, CAP Q- Probes studies at multiple institutions performed patient satis- faction surveys regarding phlebotomy services [8-10]. The mean overall satisfaction scores for all institutions were 98.6, 99.2, and 98.9 out of 100, respectively.
The mean satisfaction score in our study was lower than that of the CAP Q-Probes study, but it was within range of its partici- pating institutions. We detected several dissatisfactions with our laboratory and phlebotomy services using these surveys.
First, physicians and nurses were most dissatisfied with the specimen collection and delivery process. The specimen rejec- tion rates reported in the CAP Q-Probes studies were 0.45% for
complete blood cell count specimens in 1995, and 0.35% for chemistry specimens in 1997 and 0.3% in 2002 [11-13]. In all three studies, hemolysis, clotting, and insufficient specimen quantity were the most common reasons for specimen rejec- tion. In our study, satisfaction scores from unskilled or training physicians and nurses were lower than those from trained phy- sicians and nurses. We should provide a regularly updated labo- ratory user’s guidebook and a laboratory information searching system regarding the specimen collection and delivery process.
Second, physicians and nurses were dissatisfied with phle- botomy services. In our hospital, phlebotomists only work as regular-scheduled phlebotomists and do not serve emergency phlebotomies. In 2006, Oja et al. [14] reported that re-schedul- ing phlebotomy rounds resulted in a very significant increase in customer satisfaction rate. Thus, we have a plan to re-schedule and modify phlebotomy services to employ more phlebotomists or nurses for phlebotomy and to educate interns and nurses about appropriate phlebotomy techniques.
Third, molecular genetic and cytogenetic tests were more ex- Table 3. Comparison of satisfaction scores between the two phlebotomy rooms
Questionnaire item Central phlebotomy room (N=233) Cancer center phlebotomy room (N=114) P 1. Physician’s and nurse’s explanation of phlebotomy
a. My doctor-in-charge explained the necessity of phlebotomy 65.8±28.7 66.8±29.2 0.7611
b. Nurses explained the phlebotomy procedure 60.9±29.7 66.5±27.5 0.0889
c. Nurses explained the preparations before phlebotomy 61.7±29.2 66.5±26.4 0.1266
2. Cost of laboratory tests
a. Billing procedure is convenient 70.9±24.6 72.8±17.8 0.4077
b. Cost of laboratory tests is appropriate 55.7±24.5 56.3±24.6 0.8409
3. Environment of phlebotomy room
a. Accessibility of phlebotomy room* 72.0±24.0 77.2±20.2 0.0345
b. Phlebotomy room is comfortable 75.3±19.1 78.8±15.4 0.0640
c. Waiting time for phlebotomy is appropriate 73.0±23.1 75.7±23.8 0.3128
4. Phlebotomy process by phlebotomists
a. Phlebotomists explained the phlebotomy process* 59.8±28.5 71.2±21.4 0.0000
b. Phlebotomists’ technique is skillful 77.8±19.5 79.8±15.6 0.3038
c. Phlebotomists explained cautions after phlebotomy* 71.4±23.9 75.9±17.3 0.0472
d. Courtesy of phlebotomists 76.4±17.7 78.5±13.8 0.2248
5. Quality of laboratory test results
a. My doctor-in-charge explained the test results 74.8±21.4 79.4±16.3 0.0526
b. Laboratory test results were trustworthy 77.9±15.9 80.5±13.6 0.1623
c. Turnaround time of laboratory test results 75.8±19.6 76.6±18.2 0.7633
6. Overall satisfaction with phlebotomy services 74.9±18.2 76.8±15.6 0.3247
Mean 69.5±14.6 72.7±12.5
*Satisfaction score was significantly different between the two groups.
pensive than other tests. In our study, approximately 55% of physicians responded that they restricted their orders for molec- ular genetic and cytogenetic tests because of high costs. The lowest outpatient satisfaction item was also laboratory costs. In 1994, Lee’s study [15] showed that the high cost of laboratory tests was one of the most significant negative factors for patient satisfaction.
This study has two limitations. First, we did not use open- ended questions. Second, we did not collect data about patient waiting time, number of needle sticks, or bruise size in our phle- botomy service survey.
However, this study describes the first survey that provides a survey procedure and questionnaire items to assess customer satisfaction with clinical laboratory and phlebotomy services at a tertiary care unit level. We will make an effort to reduce the dis- satisfactions in our laboratory and phlebotomy services by tak- ing corrective actions. Our laboratory will continue the customer satisfaction surveys to meet the CAP requirement.
Authors’ Disclosures of Potential Conflicts of Interest
No potential conflicts of interest relevant to this article were re- ported.
REFERENCES
1. Shahangian S and Snyder SR. Laboratory medicine quality indicators: a review of the literature. Am J Clin Pathol 2009;131:418-31.
2. Joint Commission on Accreditation of Healthcare Organizations. Com- prehensive accreditation manual for pathology and clinical laboratory services 2000-2001. Standard PI 3.1: PI-10. Oakbrook Terrace, IL: Joint
Commission on Accreditation of Healthcare Organizations, 2000.
3. College of American Pathologists. Laboratory accreditation program.
Laboratory general checklist. GEN:20316, GEN:20335. Northfield, IL:
College of American Pathologists, 2011.
4. Miller KA and Dale JC. Physician satisfaction with clinical laboratory service, Q-Probes (99-03). Northfield, IL: College of American Patholo- gists, 1999.
5. Howanitz PJ. Physician satisfaction with clinical laboratory services: Q- probes data analysis and critique. Northfield, IL: College of American Pathologists, 2002.
6. Jones BA, Bekeris LG, Nakhleh RE, Walsh MK, Valenstein PN: College of American Pathologists. Physician satisfaction with clinical laboratory services: a College of American Pathologists Q-probes study of 138 in- stitutions. Arch Pathol Lab Med 2009;133:38-43.
7. Jones BA, Walsh MK, Ruby SG. Hospital nursing satisfaction with clini- cal laboratory services:a College of American Pathologists Q-Probes study of 162 institutions. Arch Pathol Lab Med 2006;130:1756–61.
8. Howanitz PJ, Cembrowski GS, Bachner P. Laboratory phlebotomy. Col- lege of American Pathologists Q-Probe study of patient satisfaction and complications in 23,783 patients. Arch Pathol Lab Med 1991;115:867- 72.
9. Dale JC and Howanitz PJ. Patient satisfaction and phlebotomy service data analysis and critique. Northfield, IL: College of American Patholo- gists, 1994.
10. Dale JC and Howanitz PJ. Patient satisfaction with phlebotomy service data analysis and critique. Northfield, IL: College of American Patholo- gists, 1995.
11. Jones BA, Meier F, Howanitz PJ. Complete blood count specimen ac- ceptability. A College of American Pathologists Q-Probes study of 703 laboratories. Arch Pathol Lab Med 1995;119:203-8.
12. Jones BA, Calam RR, Howanitz PJ. Chemistry specimen acceptability:
a College of American Pathologists Q-Probes study of 453 laboratories.
Arch Pathol Lab Med 1997;121:19-26.
13. Dale JC and Novis DA. Outpatient phlebotomy success and reasons for specimen rejection. Arch Pathol Lab Med 2002;126:416-9.
14. Oja PI, Kouri TT, Pakarinen AJ. From customer satisfaction survey to corrective actions in laboratory services in a university hospital. Int J Qual Health Care 2006;18:422-8.
15. Lee SI. Measurement of ambulatory patients’ satisfaction and its influ- encing factors in a tertiary hospital. Korean J Prev Med 1994;27:366-76.