The Correlation between Thyrotropin and Dyslipidemia in a Population-based Study
This study investigated the relationship between serum thyrotrophin levels and dyslipidemia in subclinical hypothyroid and euthyroid subjects. A total of 110 subjects with subclinical hypothyroidism and 1,240 euthyroid subjects enrolled in this study. Patients with subclinical hypothyroidism had significantly lower high density lipoprotein cholesterol (HDL-C) levels than those who were euthyroid. The lipid profiles were each categorized and mean thyrotrophin levels were higher in subjects in the dyslipidemia subclasses than subjects in the normal subclasses. Thyrotrophin was positively associated with serum triglyceride and negatively associated with serum HDL-C in women. Thyrotrophin was also positively associated with total cholesterol (TC) in the overweight population along with TC and LDL-C in overweight women. In the euthyroid population, thyrotrophin was positively associated with TC in the overweight population. In conclusion, serum thyrotrophin was correlated with dyslipidemia in subclinical hypothyroid and euthyroid subjects; the correlation was independent of insulin sensitivity.
Key Words: Thyrotropin; Total Cholesterol; Cholesterol, LDL; Triglyceride; Cholesterol, HDL
Li Lu1,3,*, Beibei Wang1,2,*,
Zhongyan Shan1,2, Fengwei Jiang1,2, Xiaochun Teng1,2, Yanyan Chen1,2, Yaxin Lai1,2, Jiani Wang1,2, Haibo Xue1,2, Sen Wang1,2, Chenyan Li1,2, He Liu1,2, Ningna Li1,2, Jiashu Yu1,2, Liangfeng Shi1,2, Xin Hou1,2, Qian Xing1,2, Xue Bai1,2, and Weiping Teng2
1Department of Endocrinology and Metabolism, the First Hospital of China Medical University, Shengyang; 2The Endocrine Institute of China Medical University, The Liaoning Provincial Key Laboratory of Endocrine diseases. Shenyang;
3Department of Endocrinology and Metabolism, The People’s Hospital of Liaoning Province. Shenyang, P.R. China
*Li Lu and Beibei Wang contributed equally to this work.
Received: 15 June 2010 Accepted: 26 October 2010 Address for Correspondence:
Zhongyan Shan, MD
Department of Endocrinology and Metabolism, the First Affiliated Hospital, China Medical University, No. 155 Nanjing Bei Street, Heping District, Shenyang 110001, China Tel: +86 24 24832152, Fax: +86 24 24833294 E-mail: [email protected]
This study was supported by grants from the Chinese Medical Association (7020470055) and China Guanghua Science and Technology Foundation ([2007]02).
DOI: 10.3346/jkms.2011.26.2.243 • J Korean Med Sci 2011; 26: 243-249 Endocrinology, Nutrition & Metabolism
INTRODUCTION
Many thyroid diseases are significantly correlated with athero- sclerotic cardiovascular disease (1). The thyroid hormone’s reg- ulation of lipid metabolism may represent a cause of coronary heart disease. Dyslipidemia in hypothyroidism is associated with an increased risk for cardiovascular disease (CVD); in some cases, subclinical hypothyroidism (SCH), characterized by nor- mal free thyroxin (FT4) and elevated thyrotrophin (TSH) (2-4).
Most cardiovascular events occur in subjects with normal thy- roid function and the question of whether an association of TSH with cardiovascular disease exists in the euthyroid range is also important. The known associations of overt and subclinical hy- pothyroidism with hyperlipidemia and dyslipidemia may be extended into the normal range of thyroid function. The associ-
ation of high normal TSH levels with the many cardiovascular risk factors that cluster within the insulin resistance syndrome (5-7) may be an explanation. Evidence from two studies sug- gests that TSH within the reference range may be positively as- sociated with total serum cholesterol (8) and low-density lipo- protein cholesterol (LDL-C) (9), and be negatively associated with high-density lipoprotein cholesterol (HDL-C) (9). It was shown that total cholesterol (TC) and LDL-C were reduced after thyroxine treatment in individuals with TSH in the upper refer- ence range (10). It was also demonstrated in euthyroid adults that the correlation between serum TSH and lipids appears to be influenced by insulin resistance (9). Therefore, those with an elevated amount of serum TSH and an insulin resistance are at a greater risk for dyslipidemia (11). The relationship between TSH and lipids remains controversial in subclinical hypothy-
roid and euthyroid subjects. We investigated whether there is a significant relationship between the levels of TSH and serum lipids; we also investigated whether the relationship may be in- fluenced by insulin resistance or body mass index in a general population. Furthermore, we investigated the relationship of TSH and lipids in the overweight and normal weight popula- tion as well as in men and women (which was different from previous studies).
MATERIALS AND METHODS Study subjects
Epidemiological studies on diabetes and thyroid disease were performed by the Institute of Endocrinology of China Medical University in Dadong community, Shenyang City, in 2007 (12).
The database used for this study consisted of a random sample of 1,534 people between the ages of 18 and 85 yr, whose age brack- ets of 18-29, 30-39, 40-49, 50-59, 60-69, and 70-85 yr made up, 15.1%, 23.6%, 26.0%, 19.9%, 11.1%, and 4.4% of the total popu- lation in the community respectively.
Subjects with a history of a previous thyroid disorder, or who took thyroid hormones or antithyroid drugs, were excluded to avoid the effects of the drug. In addition, the following subjects were excluded: 1) subjects taking medication affecting thyroid function (oral contraceptives, estrogen, and glucocorticoid or anti-epileptic drugs), 2) subjects with known dyslipidemia and taking lipid-lowering medicine, 3) subjects with hyperthyroid- ism or hypothyroidism, and 4) subjects treated with insulin (to ensure the accurate homeostasis model assessment index for insulin resistance [HOMA-IR]). Subjects with unavailable per- sonal data or those who known to have other kinds of diseases such as euthyroid sick syndrome and subacute thyroiditis were also excluded from this study. Finally, 1,350 subjects were in- cluded, of which 110 subjects were SCH and 1,240 were euthy- roid. A total of 847 subjects (62.7%) was female.
Methods
The participants were asked to complete a questionnaire that included demographic data, smoking and alcohol history. They were asked if they ever had thyroid disease, diabetes mellitus, hypertension, dyslipidemia, or obesity. Information on treat- ment and family medical history was also collected. The survey was conducted between 7 a.m. and 12 p.m.. Body weight, height, waist, and hip circumference were measured. The body mass index (BMI, kg/m2) and waist to hip ratio (WHR) were calculat- ed. Blood samples were obtained from the cubital vein after over- night fasting. After the centrifugation of blood for 30 min, the plasma aliquots were used to assay TC, triglyceride (TG), HDL- C, and blood glucose (BG) within 6 hr or were transported to the laboratory and kept at -70°C until assayed for thyroid func- tion and insulin.
Serum TSH and free thyroxine (FT4) were assessed using a chemiluminescent immunoassay (IMMULITE1000 Autoana- lyzer, DPC, USA). Serum lipids were analyzed with an Olympus Au400 Autoanalyzer (Olympus, Tokyo, Japan), applying reagents from the No. 1 Pharmaceutical Factory of Japan. TC was mea- sured with a cholesterol oxidase method and the TG was mea- sured with a glycerophosphate oxidase method. HDL-C was analyzed with a selective screening method. LDL-C was calcu- lated using the Friedewald formula: LDL-C= TC–HDL-C–TG/
2.2 (mM/L). Plasma glucose was measured with a hexokinase endpoint method. Plasma insulin concentrations were mea- sured with an immunoradiometric assay (Research Institute of North Biotechnology, Beijing, China). The homeostasis model assessment (HOMA) index for insulin resistance (HOMA-IR) was calculated as fasting insulin (mIU/L) times fasting blood glucose (mM/L, FBG) divided by 22.5.
The normal reference range of TSH is 0.3-4.8 mIU/L. FT4 (nor- mal reference range, 10.3-24.5 pM/L) and FT3 (normal reference range, 2.3-6.3 pM/L) were measured when TSH was not in the normal reference range. Diagnostic Criteria: hyperthyroidism was TSH < 0.3 mIU/L, FT3 > 6.3 and/or FT4 > 24.5 pM/L. The criteria of subclinical hyperthyroidism was TSH < 0.3 mIU/L, FT3 and FT4 within the reference range. The criteria of hypothy- roidism was TSH > 4.8 mIU/L, and FT4 < 10.3 pM/L. The criteria of SCH was TSH > 4.8 mIU/L, and FT4 within the reference range.
Euthyroidism was defined when TSH was 0.3-4.8 mIU/L and FT4 was 10.3-24.5 pM/L.
Statistical analyses
SPSS 15.0 (SPSS, Inc., Chicago, IL, USA) and Excel (Microsoft Corp., Redmond, WA, USA) were used for data analysis. Data was expressed as mean ± SD for data with a normal distribution.
Statistical comparisons were performed by means of indepen- dent-samples t tests or analysis of covariance to be adjusted by age, sex, and other influential factors. Pearson’s correlation anal- ysis and multiple linear regression models were performed for associations of thyroid function with serum lipid concentrations, glucose, and HOMA-IR. TG, TSH, and HOMA-IR values were logarithmically transformed for statistical analyses. P < 0.05 was considered statistically significant.
Ethics statement
The institutional review board approved this study (IRB approv- al number: [2007] 29). All participants gave written informed consent.
RESULTS
Comparison of lipid profiles of the SCH and euthyroid population
The baseline characteristics of 1,350 participants are shown in
Table 1. Women with SCH had significantly lower HDL-C than those who were euthyroid. The differences remained signifi- cant after adjustment for age, sex, and BMI (Table 2). However, the HDL-C was not different between SCH and euthyroid men.
Mean levels of TC, TG, and LDL-C were not different in both fe- male and male subjects with SCH and euthyroid. Table 3 shows the comparison of TC, TG, HDL-C, and LDL-C levels according to categories of TSH within the reference range. In either men or women, there were no significant differences among the groups after adjustment for age, sex, and BMI.
Comparison of TSH by lipid profiles categories in the whole and euthyroid population
In the whole population, TC, TG, and LDL-C subclasses were each categorized as normal, high normal, and high according to the treatment guidelines of dyslipidemia for adults in China
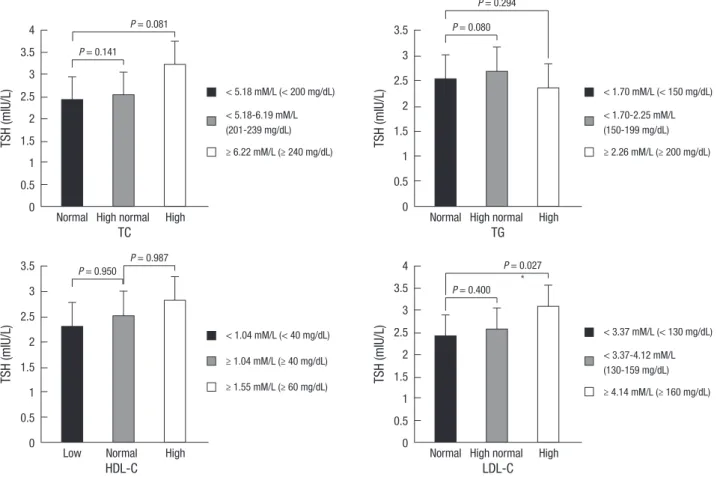
in 2007; and HDL-C subclasses were categorized as low, nor- mal, and high. The mean TSH levels were higher in subjects in the dyslipidemia group than subjects in the normal group (re- sults not shown). The differences were significant in high LDL- C subclasses in overweight (BMI 24.0 kg/m2 or higher accord- ing to the treatment guidelines of overweight and obesity for adults in China) individuals after adjustment for age, sex, and BMI (Fig. 1).
The mean TSH levels were significantly higher in high TC (3.76 ± 2.17 mIU/L vs 2.84 ± 2.45 mIU/L, P = 0.010) and high LDL-C (3.76 ± 2.23 mIU/L vs 2.80 ± 2.42 mIU/L, P = 0.022) sub- classes in overweight women. There were no significant differ- ences in men or overweight men (results not shown).
In 1,240 subjects with normal TSH levels (0.3-4.8 mIU/L), the mean TSH levels were significantly greater in high TC (2.40 ± 0.96 mIU/L vs 2.21 ± 1.10 mIU/L, P = 0.016) and in high LDL-C
Table 1. Baseline characteristics of participants
Men Women
All SCH Euthyroidism All SCH Euthyroidism
Number 503 21 482 847 89 758
Age 42.66 ± 14.48﹡ 44.48 ± 12.74 42.59 ± 14.56﹡ 45.37 ± 12.95 46.73 ± 12.48 45.21 ± 13.01
BMI 24.92 ± 3.73﹡ 24.26 ± 3.31 24.95 ± 3.74﹡ 23.70 ± 3.48 24.35 ± 3.13 23.628 ± 3.52
WHR 0.88 ± 0.07﹡ 0.88 ± 0.07﹡ 0.88 ± 0.07﹡ 0.81 ± 0.06 0.83 ± 0.06 0.81 ± 0.06
BG 5.37 ± 1.68 5.01 ± 0.60 5.39 ± 1.71 5.34 ± 1.40 5.43 ± 1.46 5.33 ± 1.39
INS 11.10 ± 6.83 10.68 ± 4.71 11.12 ± 6.91 12.06 ± 28.51 10.45 ± 5.12 12.25 ± 30.09
HOMA-IR 2.70 ± 2.07 2.41 ± 1.16 2.72 ± 2.10 2.87 ± 6.22 2.48 ± 1.21 2.91 ± 6.560
TSH 1.95 ± 1.34﹡ 6.37 ± 1.60 1.756 ± 0.94﹡ 2.67 ± 2.85 7.84 ± 6.121 2.06 ± 1.06
SCH, TSH > 4.8 mIU/L, FT4 within the reference range. Euthyroidism, TSH 0.3-4.8 mIU/L, FT4 10.3-24.5 pM/L. ﹡Compared with women in the same group P < 0.01. SCH, subclinical hypothyroidism; BMI, body mass index; WHR, waist to hip ratio; BG, blood glucose; INS, insulin; HOMA-IR, homeostasis model assessment index for insulin resistance;
TSH, thyrotrophin.
Table 2. Comparison of lipid profiles between SCH and euthyroid population after adjustment for age, sex, and BMI
Men Women
SCH
(n = 21) Euthyroidism
(n = 482) P SCH
(n = 89) Euthyroidism
(n = 758) P
TC (mM/L) 4.58 ± 0.70 4.75 ± 0.91 0.419 4.86 ± 1.02 4.77 ± 0.97 0.692
TG (mM/L) 1.77 ± 0.89 1.77 ± 1.49 0.211 1.39 ± 1.04 1.24 ± 0.93 0.161
HDL-C (mM/L) 1.13 ± 0.23 1.22 ± 0.30 0.071 1.32 ± 0.30 1.42 ± 0.40 0.035
LDL-C (mM/L) 2.93 ± 0.66 2.96 ± 0.81 0.970 2.98 ± 0.80 2.94 ± 0.87 0.946
TG and TSH values were logarithmically transformed for statistical analyses. SCH, TSH > 4.8 mIU/L and FT4 within the reference range. Euthyroidism, TSH 0.3-4.8 mIU/L, FT4, 10.3-24.5 pM/L. SCH, subclinical hypothyroidism; TC, total cholesterol; TG, triglyceride; HDL-C, high density lipoprotein cholesterol; LDL-C, low-density lipoprotein cholesterol.
Table 3. Comparison of lipid profiles according to categories of TSH within the reference range (FT4, 10.3-24.5 pM/L) after adjustment for age, sex, and BMI
TSH (mIU/L) No. TC (mM/L) TG (mM/L) HDL-C (mM/L) LDL-C (mM/L)
Men 0.3-0.99
1.0-1.89 1.9-4.80
P
105 202 175
4.67 ± 0.91 4.74 ± 0.91 4.81 ± 0.91
0.427
1.72 ± 1.54 1.83 ± 1.67 1.72 ± 1.23
0.289
1.19 ± 0.30 1.24 ± 0.31 1.22 ± 0.29
0.625
2.95 ± 0.80 2.90 ± 0.79 3.03 ± 0.84
0.547
Women 0.3-0.99
1.0-1.89 1.9-4.80
P
128 265 365
4.76 ± 1.00 4.78 ± 0.94 4.74 ± 0.99
0.800
1.14 ± 0.77 1.23 ± 0.88 1.28 ± 1.00
0.345
1.45 ± 0.50 1.41 ± 0.32 1.41 ± 0.40
0.659
3.01 ± 0.91 2.91 ± 1.86 2.94 ± 0.86
0.711 TG and TSH values were logarithmically transformed for statistical analyses. TSH, thyrotrophin; BMI, body mass index; TC, total cholesterol; TG, triglyceride; HDL-C, high density lipoprotein cholesterol; LDL-C, low-density lipoprotein cholesterol.
(2.44 ± 0.95 mIU/L vs 2.17 ± 1.10 mIU/L, P = 0.035) subclasses in overweight women.
Correlation analysis between TSH and lipid profiles in the whole and euthyroid population
There were significant correlations of lipid profiles with age, gen- der, BMI and WHR in all euthyroid and SCH subjects when an- alysed by Pearson’s correlation analysis. The TSH was associat- ed positively with serum TG and negatively with serum HDL-C in women (Table 4). There were no significant correlations of
TSH with TC, TG, HDL-C, and LDL-C in men.
Multiple linear regression models were used to determine associations of TSH with TC, TG, HDL-C, and LDL-C and to de- termine whether the associations were either dependent on or modified by HOMA-IR values. In the whole population, TSH was significantly and positively associated with TG, independently of the HOMA-IR value (Table 5) and was not associated with HDL-C after adjustment for age, sex, and BMI. In the overweight population, TSH was positively associated with TC (r = 0.078, P = 0.044). And the associations remained significant (β = 0.080, P =
TSH (mIU/L)TSH (mIU/L) TSH (mIU/L)TSH (mIU/L)
TC
HDL-C
TG
LDL-C
P = 0.141
P = 0.950
P = 0.080
P = 0.400 P = 0.081
P = 0.987
P = 0.294
P = 0.027
﹡ Normal High normal High
Low Normal High
Normal High normal High
Normal High normal High 4
3.5 3 2.5 2 1.5 1 0.5 0
3.5 3 2.5 2 1.5 1 0.5 0
3.5 3 2.5 2 1.5 1 0.5 0
4 3.5 3 2.5 2 1.5 1 0.5 0
< 5.18 mM/L (< 200 mg/dL)
< 5.18-6.19 mM/L (201-239 mg/dL)
≥ 6.22 mM/L (≥ 240 mg/dL)
< 1.04 mM/L (< 40 mg/dL)
≥ 1.04 mM/L (≥ 40 mg/dL)
≥ 1.55 mM/L (≥ 60 mg/dL)
< 1.70 mM/L (< 150 mg/dL)
< 1.70-2.25 mM/L (150-199 mg/dL)
≥ 2.26 mM/L (≥ 200 mg/dL)
< 3.37 mM/L (< 130 mg/dL)
< 3.37-4.12 mM/L (130-159 mg/dL)
≥ 4.14 mM/L (≥ 160 mg/dL)
Fig. 1. Comparison of TSH by lipid profile categories after adjustment for age and sex in the overweight population. TG and TSH values were logarithmically transformed for statistical analyses. The ﹡P = 0.027 was compared to normal LDL-C subclasses. TC, TG, and LDL-C subclasses were each categorized as normal, high normal, and high according to the treatment guidelines of dyslipidemia for adults in China in 2007; HDL-C subclasses were categorized as low, normal, and high.
Table 4. Pearso n correlation analysis for lipid profiles in women
TC TG HDL-C LDL-C
r P r P r P r P
Age 0.394 0.000 0.278 0.000 0.011 0.746 0.271 0.000
BMI 0.169 0.000 0.338 0.000 -0.211 0.000 0.183 0.000
WHR 0.176 0.000 0.367 0.000 -0.143 0.000 0.147 0.000
FBG 0.153 0.000 0.198 0.000 -0.069 0.045 0.105 0.002
Insulin -0.041 0.230 0.017 0.623 -0.011 0.739 -0.030 0.378
HOMA-IR 0.025 0.464 0.249 0.000 -0.154 0.000 0.072 0.037
TSH 0.024 0.490 0.083 0.015 -0.072 0.036 0.006 0.864
TG, TSH, and HOMA-IR values were logarithmically transformed for statistical analyses. TC, total cholesterol; TG, triglyceride; HDL-C, high density lipoprotein cholesterol; LDL-C, low-density lipoprotein cholesterol; BMI, body mass index; WHR, waist to hip ratio; FBG, fasting blood glucose; HOMA-IR, homeostasis model assessment index for insulin resistance; TSH, thyrotrophin.
0.039) even after adjustment for age, sex, and BMI independent of HOMA-IR value. TSH was positively associated with TC (β = 0.118, P = 0.017) and LDL-C (β = 0.118, P = 0.021) after adjust- ment for age, sex, and BMI in overweight women; in addition, it was not associated with TC, TG, HDL-C, and LDL-C in normal weight women, overweight and normal weight men.
In all of the euthyroid population, there were no significant correlations between TSH and serum TC, TG, HDL-C, and LDL- C. However, TSH was positively associated with TC after adjust- ment for age, sex, and BMI in the overweight population (β = 0.079, P = 0.050) or in overweight women (β = 0.117, P = 0.031) and the associations were not modified by the HOMA-IR values (results not shown). At the same time, TSH was not associated with TC, TG, HDL-C, and LDL-C in normal weight women and overweight and normal weight men.
DISCUSSION
The level of lipid profiles is influenced by many factors. Present research has shown that thyroid hormones change the lipid pro- files. Thyroid hormones may stimulate hydroxymethylglutaryl coenzyme A (HMG CoA), the key enzyme of cholesterol biosyn- thesis, and induce an increased synthesis of cholesterol. Addi- tionally, the LDL-C receptor gene contains a thyroid hormone responsive element (TRE) that could allow triiodothyronine (T3) to modulate the gene expression of the LDL-C receptor and result in an increase of LDL-C receptor synthesis (13, 14). Patients with hypothyroidism had higher baseline serum levels of TC, TG, and LDL-C and lower baseline serum levels of HDL-C. Thyroid hor- mones and their function are low in target tissue in SCH, and researchers conjectured that SCH influences lipid profiles by the above-mentioned mechanism.
Althaus et al. (15) reported that in subjects with SCH LDL-C levels were significant increased and HDL-C levels were decreas- ed when compared to euthyroid subjects, after adjustment for age, sex, and BMI. The report (15) provided a possible explana- tion for the higher prevalence of coronary heart disease report-
ed in SCH. The Colorado thyroid disease prevalence study (16) showed that TC and LDL-C in SCH were significantly higher than in euthyroidism; but TG and HDL-C were not significantly different. This finding was consistent with that of the studies by Efstathiadou et al. (17) in which patients with SCH had signifi- cantly higher levels of TC and LDL-C compared with controls, whereas levels of TG and HDL-C were similar in the two groups.
Another study (18), however, showed that HDL-C and TG levels were similar between SCH patients and control groups. Although TC and LDL-C levels were higher in patients with SCH than in controls, the difference were not statistically significant. In this cross-sectional study of 1,350 subjects, serum concentrations of HDL-C in SCH are significantly lower than in euthyroidism; in addition, TC, TG and LDL-C were not different between the two groups after adjustment for age, sex and BMI, which was not completely consistent with previous studies.
Several factors may affect the results of the present study in- cluding age, sex, BMI, HOMA-IR, and the numbers of subjects.
The numbers of previous studies were small except for the Col- orado Thyroid Disease Prevalence Study. In addition, we re- moved the effects of age, sex, and BMI. We found that the rela- tionship of TSH and lipids level were different in the overweight and normal weight populations, along with those in men and women.
The present data provides evidence that serum TSH has ef- fects on serum lipid parameters in the whole population. TSH was associated positively with serum TG and negatively with serum HDL-C in women. In the whole population, TSH remained significantly and positively associated with TG after adjustment for age, sex, and BMI, independent of the HOMA-IR value. TSH was positively associated with TC in the overweight population and positively associated with TC and LDL-C in overweight women. The combination of serum TSH, sex, and BMI has im- portant effects on serum lipid parameters.
This was suitable to the euthyroid population, that is, TSH level was associated with abnormality of TC and LDL-C in over- weight women. In this study of 1,240 subjects with normal TSH Table 5. Multivariate linear regression models for lipid profiles in whole population
Model
TC TG HDL LDL
β P Adjusted
r2 β P Adjusted
r2 β P Adjusted
r2 β P Adjusted
r2
1 TSH 0.03 0.23 0.113 0.05 0.02 0.17 -0.03 0.14 0.112 0.01 0.57 0.05
2 HOMA-I 1 9 0.114 6 6 7 8 8 0.12 5 1 7
3 R 0.05 0.05 0.115 0.23 0.00 0.22 -0.11 0.00 3 0.06 0.02 0.06
TSH 2 3 1 0 4 5 0 0.12 2 6 0
HOMA-I 0.03 0.24 0.05 0.02 0.22 -0.03 0.15 3 0.01 0.58 0.06
R 0 3 5 6 6 7 4 5 1 0
0.05 0.05 0.23 0.00 -0.11 0.00 0.06 0.02
2 4 1 0 5 0 1 6
Models 1 and 2 are simple regressions for TSH and HOMA-IR alone. Model 3 is multiple regression including TSH and HOMA-IR. All models are adjusted for age, sex, BMI and WHR. TG, TSH and HOMA-IR values were logarithmically transformed for statistical analyses.
levels (0.3-4.8 mIU/L), the mean TSH levels were significantly higher in high TC and high LDL-C subclasses in overweight women. TSH was positively associated with TC after adjustment for age, sex, and BMI in the overweight population or in over- weight women and the associations were not modified by the HOMA-IR values. A health adult study (n = 47) (19) found that there were significant positive associations of TSH with LDL-C and TC with an inverse association with HDL-C independent of insulin sensitivity that was assessed with the hyperinsulinemic euglycemic clamp technique. In 117 diabetic women (11), the correlation between serum TSH and lipids appears to be influ- enced by insulin resistance; therefore, those with an elevated amount of serum TSH and an insulin resistance are at a greater risk for dyslipidemia. In 1,581 euthyroid adults, Roos et al. (19) demonstrated an association between serum TSH and TG. How- ever, there was no relationship with other components of lipids after adjustment for age, sex, and insulin resistance. In euthy- roidism (20), subjects with a TSH in the upper normal range (2.5 to 4.5 mIU/L) were more obese, had higher TG, and had an increased likeliness for metabolic syndrome. Therefore, a TSH
< 2.5 mIU/L is associated with a favorable metabolic profile.
Another study (21) showed an association between TSH and some components specific of the metabolic syndrome in eu- thyroid women. In this study, we could not find that the associ- ation of TSH with TC, TG, HDL-C, and LDL-C were influenced by insulin resistance. The conflicting conclusions maybe due to the influencing factors of age, sex, BMI, HOMA-IR, and the num- bers of subjects.
In conclusion, serum TSH is correlated with dyslipidemia in subclinical hypothyroid and euthyroid subjects and the corre- lation was independent of insulin sensitivity.
ACKNOWLEDGMENTS
We express our gratitude to the staff at the Health Bureau of Da- dong District in Shenyang, Center for Chronic Disease Control, the Pearl of the Orient Community of Dadong District, the Yong- feng Community, and the Dawn Community for their strong support and assistance in this epidemiological study.
REFERENCES
1. Klein I, Ojamaa K. Thyroid hormone and the cardiovascular system. N Engl J Med 2001; 344: 501-9.
2. Biondi B, Palmieri EA, Lombardi G, Fazio S. Effects of subclinical thy- roid dysfunction on the heart. Ann Intern Med 2002; 137: 904-14.
3. Biondi B. Cardiovascular effects of mild hypothyroidism. Thyroid 2007;
17: 625-30.
4. Feldt-Rasmussen U. Is the treatment of subclinical hypothyroidism ben-
eficial? Nat Clin Pract Endocrinol Metab 2009; 5: 86-7.
5. Reaven GM. Banting lecture 1988. Role of insulin resistance in human disease. Diabetes 1988; 37: 1595-607.
6. Mykkänen L, Haffner SM, Rönnemaa T, Bergman RN, Laakso M. Low insulin sensitivity is associated with clustering of cardiovascular disease risk factors. Am J Epidemiol 1997; 146: 315-21.
7. Genest J Jr, Cohn JS. Clustering of cardiovascular risk factors: targeting high-risk individuals. Am J Cardiol 1995; 76: 8A-20A.
8. Pallas D, Koutras DA, Adamopoulos P, Marafelia P, Souvatzoglou A, Piperingos G, Moulopoulos SD. Increased mean serum thyrotropin in apparently euthyroid hypercholesterolemic patients: does it mean occult hypothyroidism? J Endocrinol Invest 1991; 14: 743-6.
9. Bakker SJ, ter Maaten JC, Popp-Snijders C, Slaets JP, Heine RJ, Gans RO.
The relationship between thyrotropin and low density lipoprotein choles- terol is modified by insulin sensitivity in healthy euthyroid subjects. J Clin Endocrinol Metab 2001; 86: 1206-11.
10. Michalopoulou G, Alevizaki M, Piperingos G, Mitsibounas D, Mantzos E, Adamopoulos P, Koutras DA. High serum cholesterol levels in persons with ‘high-normal’ TSH levels: should one extend the definition of sub- clinical hypothyroidism? Eur J Endocrinol 1998; 138: 141-5.
11. Chubb SA, Davis WA, Davis TM. Interactions among thyroid function, insulin sensitivity, and serum lipid concentrations: the Fremantle diabe- tes study. J Clin Endocrinol Metab 2005; 90: 5317-20.
12. Liu D, Jiang F, Shan Z, Wang B, Wang J, Lai Y, Chen Y, Li M, Liu H, Li C, Xue H, Li N, Yu J, Shi L, Bai X, Hou X, Zhu L, Lu L, Wang S, Xing Q, Teng W. A cross-sectional survey of relationship between serum TSH level and blood pressure. J Hum Hypertens 2010; 24: 134-8.
13. Duntas LH. Thyroid disease and lipids. Thyroid 2002; 12: 287-93.
14. Benvenga S, Robbins J. Enhancement of thyroxine entry into low density lipoprotein (LDL) receptor-competent fibroblasts by LDL: an additional mode of entry of thyroxine into cells. Endocrinology 1990; 126: 933-41.
15. Althaus BU, Staub JJ, Ryff-De Lèche A, Oberhänsli A, Stähelin HB. LDL/
HDL-changes in subclinical hypothyroidism: possible risk factors for cor- onary heart disease. Clin Endocrinol (Oxf) 1988; 28: 157-63.
16. Canaris GJ, Manowitz NR, Mayor G, Ridgway EC. The Colorado thyroid disease prevalence study. Arch Intern Med 2000; 160: 526-34.
17. Efstathiadou Z, Bitsis S, Milionis HJ, Kukuvitis A, Bairaktari ET, Elisaf MS, Tsatsoulis A. Lipid profile in subclinical hypothyroidism: is L-thyroxine substitution beneficial? Eur J Endocrinol 2001; 145: 705-10.
18. Gullu S, Sav H, Kamel N. Effects of levothyroxine treatment on biochemi- cal and hemostasis parameters in patients with hypothyroidism. Eur J Endocrinol. 2005; 152: 355-61.
19. Roos A, Bakker SJ, Links TP, Gans RO, Wolffenbuttel BH. Thyroid func- tion is associated with components of the metabolic syndrome in euthy- roid subjects. J Clin Endocrinol Metab 2007; 92: 491-6.
20. Ruhla S, Weickert MO, Arafat AM, Osterhoff M, Isken F, Spranger J, Schöfl C, Pfeiffer AF, Möhlig M. A high normal TSH is associated with the metabolic syndrome. Clin Endocrinol (Oxf) 2010; 72: 696-701.
21. Kumar HK, Yadav RK, Prajapati J, Reddy CV, Raghunath M, Modi KD.
Association between thyroid hormones, insulin resistance, and metabol- ic syndrome. Saudi Med J 2009; 30: 907-11.
AUTHOR SUMMARY
The Correlation between Thyrotropin and Dyslipidemia in a Population-based Study
Li Lu, Beibei Wang, Zhongyan Shan, Fengwei Jiang, Xiaochun Teng, Yanyan Chen, Yaxin Lai, Jiani Wang, Haibo Xue, Sen Wang, Chenyan Li, He Liu, Ningna Li, Jiashu Yu, Liangfeng Shi, Xin Hou, Qian Xing, Xue Bai, and Weiping Teng
We investigated the relationship between serum thyrotrophin and dyslipidemia in subclinical hypothyroid and euthyroid subjects.
110 subjects with subclinical hypothyroidism and 1,240 euthyroid subjects were enrolled in the study. Patients with subclinical hypothyroidism had significantly lower HDL-C levels than the euthyroid. The mean thyrotrophin levels were higher in subjects in the dyslipidemia subclasses than those with normal lipid profile. Thyrotrophin was positively associated with serum TG and negatively associated with serum HDL-C in women. Thyrotrophin was also postiviely associated with TC in overweight po pulations and with TC and LDL-C in overweight women. In the euthryoid population, thyrotrophin was positively associated with TC in the overweight population. In conclusions, serum thyrotrophin is correlative with dyslipidemia in subclinical hypothyroid and euthyroid subjects, and the correlation was independent of insulin sensitivity.