저밀도 지단백 콜레스테롤 수준에 따른 탄수화물 섭취와 심혈관계질환 위험요인의 관련성
송수진
1, 이윤정
2, 송윤주
31한남대학교 식품영양학과, 2서울대학교병원 급식영양과, 3가톨릭대학교 생활과학부 식품영양학과
Association between Dietary Carbohydrate Intake and Cardiovascular Risk Factors According to Low-Density Lipoprotein Cholesterol Levels in Korean Adults
SuJin Song
1, Yun Jung Lee
2, YoonJu Song
31
Department of Food and Nutrition, Hannam University, Daejeon, Korea
2
Department of Food Service and Nutrition Care, Seoul National University Hospital, Seoul, Korea
3
Department of Food Science and Nutrition, The Catholic University of Korea, Bucheon, Korea
Background: Low-density lipoprotein (LDL) cholesterol is a strong predictor of cardiovascular disease, resulting in the promotion of low-fat diets that emphasize the need to lower LDL cholesterol levels. We investigated the relationship between dietary carbohydrate intake and cardiovascular risk factors according to LDL cholesterol levels in Korean adults who typically consumed high-carbohydrate, low-fat diets.
Methods: A total of 25,925 Korean adults were selected from the 2007-2015 Korea National Health and Nutrition Examination Surveys. Dietary carbohydrate intake was grouped into quintiles and cardiovascular risk factors included obesity, metabolic syndrome, type 2 diabetes, and dyslipidemia. Multiple logistic regression models were used to examine association between carbohydrate intake and cardiovascular risk factors by sex and LDL cholesterol levels.
Results: Subjects with LDL cholesterol ≥130 mg/dL had significantly less energy and fat intake than those with LDL cholesterol <130 mg/dL both in men and women. In men, a higher carbohydrate intake was related to in- creased prevalence of atherogenic dyslipidemia and low high-density lipoprotein (HDL) cholesterol regardless of LDL cholesterol levels. Meanwhile, dietary carbohydrate intake was positively associated with low HDL cho- lesterol but inversely associated with hypercholesterolemia only in women with LDL cholesterol <130 mg/dL.
Conclusions: High carbohydrate intake in Korean adults is associated with low HDL cholesterol or atherogenic dyslipidemia regardless of LDL cholesterol levels. Carbohydrate intake should be carefully recommended ac- cording to the lipid profiles of individuals for the prevention and management of cardiovascular disease.
Korean J Health Promot 2020;20(4):182-193
Keywords: Dietary carbohydrates, Dyslipidemias, Cardiovascular diseases, Cholesterol, LDL
■
Received: Jul. 27, 2020
■Revised: Aug. 19, 2020
■Accepted: Oct. 7, 2020
■Corresponding author : YoonJu Song, PhD
Department of Food Science & Nutrition, The Catholic University of Korea, 43 Jibong-ro, Wonmi-gu, Bucheon 14662, Korea
Tel: +82-2-2164-4681, Fax: +82-2-2164-6583 E-mail: [email protected]
ORCID: https://orcid.org/0000-0002-4764-5864
■ This study was supported by a National Research Foundation of Korea (NRF) Grant funded by the Korean Government (NRF-2020R1F1A1049442).
Copyright ⓒ 2020 The Korean Society of Health Promotion and Disease Prevention
This is an Open Access article distributed under the terms of the Creative Commons Attribution Non-Commercial License (http://creativecommons.org/licenses/by-nc/3.0/), which permits unrestricted noncommercial use, distribution, and reproduction in any medium, provided the original work is properly cited.
INTRODUCTION
Cardiovascular diseases refer to a class of abnormal con-
ditions related heart or blood vessels and include hyper-
tension, ischemic heart disease, myocardial infarction, ische-
mic stroke, and arrhythmia. As low-density lipoprotein
(LDL) cholesterol is known as a strong predictor of the risk
of cardiovascular diseases, lowering LDL cholesterol level is recommended for the prevention and management of car- diovascular disease.
1)On the other hand, high-density lip- oprotein (HDL) cholesterol is considered as an anti-athero- genic factor in the development of cardiovascular diseases.
1)Therapy methods for the treatment of cardiovascular disease are usually determined based on the LDL cholesterol level, along with other cardiovascular risk factors.
To reduce LDL cholesterol level, low-fat diets, especially those low in saturated fatty acids and trans fats, are typically prescribed.
1)Several meta-analyses of randomized controlled trials have shown that low-fat diets involving carbohydrate replacement had more favorable effects on total cholesterol and LDL cholesterol levels than high-fat diets.
2-4)On the other hand, low-fat diets had less effect on HDL cholesterol or triglyceride levels compared to high-fat diets.
4)Adhering to low-fat diets also resulted in elevated triglyceride levels.
2)Recent studies have revealed that elevated triglycerides and low HDL cholesterol independently affect the develop- ment of cardiovascular disease, even in the absence of high LDL cholesterol level.
5,6)Observational studies have re- ported that high-carbohydrate, low-fat diets are consistently associated with elevated triglycerides and low HDL choles- terol levels.
7-10)Consequently, the high carbohydrate intake might also lead to increased risks for cardiovascular disease, metabolic syndrome, and type 2 diabetes.
11-14)The Korean population typically consumes high-carbohy- drate diets with low fat intake (65% carbohydrates vs. 20%
fat). Since cardiovascular disease is one of the major causes of death in Korea,
15)investigating the associations between dietary carbohydrate intake and cardiovascular risk factors by LDL cholesterol level is necessary to develop specific di- etary guidelines for reducing cardiovascular disease risks.
Therefore, the purpose of the present study was to examine the association between dietary carbohydrate intake and car- diovascular risk factors by LDL cholesterol level in Korean adults using nationwide representative samples.
METHODS
1. Data and subjects
This study used the 2007-2015 Korea National Health and Nutrition Examination Surveys (KNHANES) data. The KNHANES is a cross-sectional and nationwide representa-
tive survey performed to assess and monitor the nutritional health status of the Korean population.
16)The KNHANES uses a stratified, multi-stage probability sampling method and includes three parts: a health interview, physical exami- nation and laboratory test, and nutritional survey.
16)Of the 49,114 subjects who were aged 20 years or older and had dietary data, several were excluded because they had a pre- vious diagnosis or treatment for hypertension, dyslipidemia, or diabetes (n=13,598); had incomplete blood samples or fasting time under 8 hours (n=5,678); had no information on body mass index (BMI; n=43); were pregnant or breastfeed- ing (n=2,989); or reported implausible energy intake (<500 kcal/day or >5,000 kcal/day; n=439). In addition, subjects who had triglyceride levels ≥400 mg/dL were excluded for the calculation of LDL cholesterol level (n=442). A total of 25,925 adults (11,289 men and 14,636 women) were included in the final data analyses. Figure 1 shows the flow of study subjects selection. The our study was conducted in accordance with the Declaration of Helsinki. The study protocol was approved by the Institutional Review Board of the Korea Centers for Disease Control and Prevention (2007-02CON-04-P, 2008-04EXP-01-C, 2009-01CON-03-2C, 2010-02CON-21-C, 2011-02CON-06-C, 2012-01EXP-01-2C, 2013-07CON-03-4C, 2013-12EXP-03-5C). Written informed consent was obtained from each subject.
2. Dietary variables
Total energy and macronutrient intake was assessed using data from 1 day 24-hour dietary recall for each subject. The 24-hour dietary recall data were obtained by trained inter- viewers during the nutrition survey in a manner of repre- senting weekdays and weekends. Intakes of total energy and macronutrient were calculated based on a food composition table published by the Rural Development Administration of Korea.
17,18)Macronutrient intakes were also presented as proportions of total energy intake. To evlaute carbohydrate and fat intake, the acceptable macronutrient distribution range from the 2015 dietary reference intakes for Koreans was used: the acceptable macronutrient distribution range for carbohydrate is 55-65% and fat is 15-30% in adults.
19)3. Anthropometric and biochemical variables
During the health examination, anthropometric and bio-
Figure 1. Selection of the study subjects. KNHANES, Korea National Health and Nutrition Examination Surveys; BMI, body mass index.
chemical variables were measured by trained medical personnel.
BMI was calculated based on the measured heights and weights (kg/m
2). Waist circumference was measured at the umbilical level for each subject in a standing position using a measuring tape. Blood pressure was measured three times, and the average of the last two values was used.
Fasting blood samples were collected from each subject who had at least 8 hours of fasting time. Total cholesterol, HDL cholesterol, triglycerides, and fasting blood glucose were analyzed in a certified clinical laboratory using an ADVIA 1650 (Siemens, Tarrytown, NY, USA) for samples collected between 1 January 2007 and 15 February 2008 and a Hitachi automatic analyzer 7600 (Hitachi, Tokyo, Japan) for samples collected after 20 February 2008. LDL choles- terol was calculated using Friedwald’s equation as total cho- lesterol - (triglycerides / 5) - HDL cholesterol.
20)4. Cardiovascular risk factors
Cardiovascular risk factors included in this study were obesity, metabolic syndrome, type 2 diabetes, and dyslipide- mia (e.g., hypercholesterolemia, hypertriglyceridemia, and atherogenic dyslipidemia). According to the World Health Organization Western Pacific region classification, subjects who had BMI ≥25 kg/m
2were considered to have obesity.
21)The presence of metabolic syndrome was determined as subjects had three or more of the metabolic syndrome com- ponents according to the National Cholesterol Education Program Adult Treatment Panel III criteria:
1)1) abdominal
obesity (≥90 cm in men, ≥85 cm in women), which used a modified waist circumference cutoff for Korean adults,
22)2) elevated triglycerides (≥150 mg/dL), 3) reduced HDL cholesterol (<40 mg/dL in men, <50 mg/dL in women), 4) elevated blood pressure (systolic blood pressure ≥130 mmHg or diastolic blood pressure ≥85 mmHg), and 5) elevated fasting blood glucose (≥100 mg/dL). Type 2 dia- betes was defined as fasting blood glucose ≥126 mg/dL.
Hypercholesterolemia was defined as total cholesterol
≥ 240 mg/dL for individuals with LDL cholesterol ≥130 mg/dL and total cholesterol ≥200 mg/dL for individuals with LDL cholesterol <130 mg/dL, and hypertriglyceridemia was diag- nosed as triglycerides ≥200 mg/dL.
1)Subjects who had both elevated triglycerides and reduced HDL cholesterol were considered to have atherogenic dyslipidemia.
23)LDL choles- terol level was divided into two groups: <130 mg/dL or
≥130 mg/dL.
5. Other variables
Sociodemographic and lifestyle variables were collected
using a structured questionnaire during the health interview
part. Sociodemographic variables included sex, age, educa-
tion, household income, and residence. Lifestyle variables
included current smoking status, current alcohol drinking,
and physical activity. Current smoking status was des-
ignated as a “yes” if a subject had smoked more than 100
cigarettes during their lifetime and were smoking regularly
or occasionally. Current alcohol drinking was determined as
Total (n=25,925) Men (n=11,289) Women (n=14,636)
P
b Age, y20-29 24.2 23.6 24.8 <0.001
30-49 52.6 49.7 55.9
50-64 17.1 19.5 14.4
65-74 4.2 5.0 3.3
≥75 1.9 2.1 1.6
Education
Elementary or less 8.8 8.4 9.1 0.179
Junior high school 7.7 7.9 7.4
High school 42.7 42.7 42.7
College or more 40.9 41.0 40.8
Household income
Q1 (lowest) 10.6 10.9 10.2 0.060
Q2 25.4 25.5 25.2
Q3 31.8 32.1 31.5
Q4 (highest) 32.3 31.5 33.1
Residence
Urban 83.5 81.8 85.3 <0.001
Rural 16.5 18.2 14.7
Currently smoking
Yes 26.6 44.6 6.3 <0.001
No 73.4 55.4 93.7
Currently consuming alcohol
Yes 62.8 75.4 48.8 <0.001
No 37.2 24.6 51.2
Physical activity
Yes 42.9 44.5 40.9 <0.001
No 57.1 55.5 59.1
Cardiovascular risk factors
BMI, kg/m2 23.3±0.0 23.9±0.0 22.6±0.0 <0.001
Waist circumference, cm 79.8±0.1 83.4±0.1 75.8±0.1 <0.001
Total cholesterol, mg/dL 184.7±0.3 186.8±0.4 182.5±0.4 <0.001
Triglycerides, mg/dL 116.1±0.6 134.3±0.9 95.7±0.6 <0.001
HDL cholesterol, mg/dL 50.5±0.1 47.5±0.1 53.8±0.1 <0.001
LDL cholesterol, mg/dL 111.0±0.3 112.4±0.4 109.5±0.3 <0.001
Systolic blood pressure, mmHg 113.5±0.1 117.5±0.2 109.1±0.2 <0.001
Diastolic blood pressure, mmHg 75.2±0.1 78.3±0.1 71.8±0.1 <0.001
Fasting blood glucose, mg/dL 93.2±0.1 94.7±0.2 91.5±0.2 <0.001
Prevalence of cardiovascular risk factors
Obesity 27.6 33.6 20.8 <0.001
Metabolic syndrome 14.6 18.3 10.3 <0.001
Increased waist circumference 18.8 21.8 15.4 <0.001
Elevated triglycerides 23.4 32.6 13.1 <0.001
Reduced HDL cholesterol 31.8 24.6 40.0 <0.001
Elevated blood pressure 21.4 29.4 12.3 <0.001
Elevated fasting blood glucose 19.3 23.9 14.1 <0.001
Type 2 diabetes 2.1 2.6 1.6 <0.001
Hypercholesterolemia (≥200 mg/dL) 30.6 33.4 27.5 <0.001
Hypercholesterolemia (≥240 mg/dL) 5.9 6.3 5.4 0.008
Hypertriglyceridemia 11.8 17.3 5.7 <0.001
Atherogenic dyslipidemia 11.5 13.3 9.6 <0.001
Values are presented as mean±standard error or percentage.
Abbreviations: BMI, body mass index; HDL, high-density lipoprotein; LDL, low-density lipoprotein.
aAll analyses accounted for the complex sampling design effect and appropriate sampling weights of the national survey using the PROC SURVEY in the SAS program (SAS Institute, Cary, NC, USA).
b
P-value was obtained from the chi-square test for categorical variables and t-test for continuous variables.
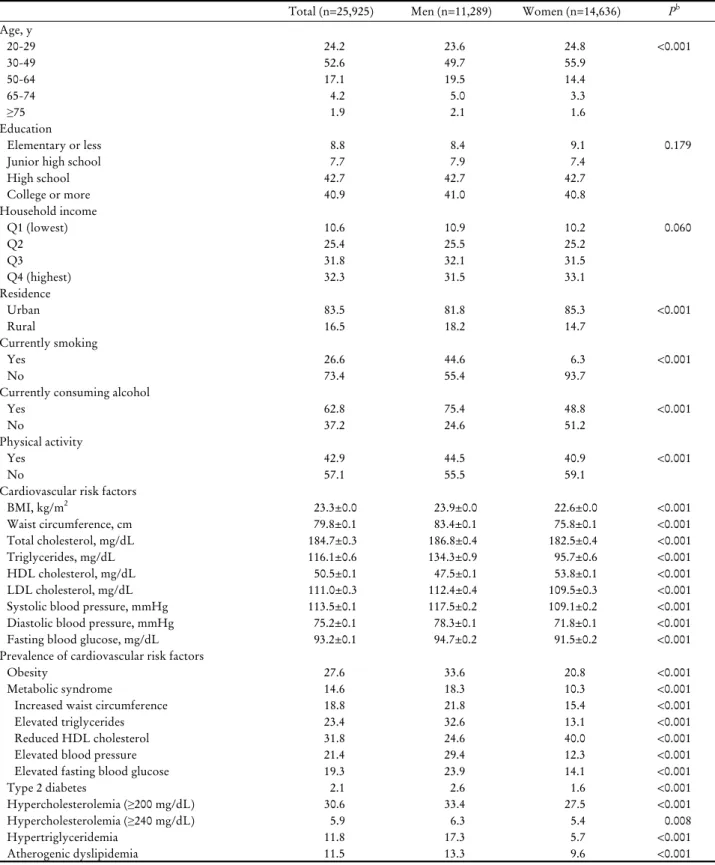
Table 1. Characteristics of the study subjects by sex
aFigure 2. Energy and macronutrient intake by sex and LDL cho- lesterol levels
a,b. LDL, low-density lipoprotein. *<0.05, **<0.01,
***<0.001 between LDL cholesterol groups.
aAll analyses ac- counted for the complex sampling design effect and appropriate sampling weights of the national survey using the PROC SURVEY in the SAS program (SAS Institute, Cary, NC, USA).
b
Macronutrient intake was presented as a percentage of total en- ergy intake. Mean and P -values were obtained from the re- gression analysis after adjustment for age, residence, education, household income, smoking, alcohol drinking, physical activity, body mass index, and total energy intake.
Figure 3. Distribution of study subjects across dietary carbohy- drate and fat intake by sex and LDL cholesterol levels.
a,bLDL, low-density lipoprotein.
aAll analyses accounted for the com- plex sampling design effect and appropriate sampling weights of the national survey using the PROC SURVEY in the SAS pro- gram (SAS Institute, Cary, NC, USA).
bPercentages of subjects according to the acceptable macronutrient distribution range from the 2015 dietary reference intakes for Koreans were presented.
P -values were obtained from the Rao-Scott chi-square test.
a ‘‘yes’’ if a subject drank a glass of alcohol or more per month over the previous year. Physical activity was assessed as a ‘‘yes’’ if a subject engaged in walking for 30 minutes or more on at least 5 days during the previous week.
6. Statistical analyses
All statistical analyses were performed using the Statistical Analysis Systems (SAS) software package, version 9.4 (SAS Institute, Cary, NC, USA). All of the analyses accounted for the complex sampling design effect and used appropriate sampling weights to obtain estimates of the entire Korean adult population from the representative survey sample.
Continuous variables were expressed as means with standard errors and categorical variables were expressed as percentages.
The t-test was used to test statistical differences in con- tinuous variables by sex and the Rao-Scott chi-square test was used to test statistical differences in categorical variables
by sex. Differences in cardiovascular risk factors and dietary variables between LDL cholesterol groups were tested using the regression analysis after adjustment for covariates.
Dietary carbohydrate intake was grouped into quintiles by
sex. A multiple logistic regression model was used to calcu-
late odds ratios (ORs), 95% confidence intervals (CIs), and
P for trends for cardiovascular risk factors across quintiles
of dietary carbohydrate intake by sex and LDL cholesterol
level. Confounding variables considered in the statistical
models were age, residence, education, household income,
current smoking status, current alcohol drinking, physical
activity, BMI, and total energy intake. Any test of significance
which was conducted in this study was two-tailed, and a
P-value of <0.05 was considered statistically significant.
LDL cholesterol, mg/dL
P
b≥130 <130
Men 3,106 8,183
BMI, kg/m2 24.7±0.1 23.5±0.1 <0.001
Waist circumference, cm 85.9±0.2 81.9±0.1 <0.001
Total cholesterol, mg/dL 225.2±0.6 172.2±0.4 <0.001
Triglycerides, mg/dL 135.9±1.5 131.1±1.2 0.008
HDL cholesterol, mg/dL 46.9±0.3 47.5±0.2 0.027
LDL cholesterol, mg/dL 151.0±0.5 98.4±0.3 <0.001
Systolic blood pressure, mmHg 119.0±0.3 117.0±0.2 <0.001
Diastolic blood pressure, mmHg 80.0±0.3 78.1±0.2 <0.001
Fasting blood glucose, mg/dL 96.0±0.4 93.4±0.2 <0.001
Women 3,507 11,129
BMI, kg/m2 24.0±0.1 22.2±0.0 <0.001
Waist circumference, cm 79.3±0.3 74.3±0.1 <0.001
Total cholesterol, mg/dL 225.5±0.6 168.8±0.3 <0.001
Triglycerides, mg/dL 111.4±1.3 89.2±0.7 <0.001
HDL cholesterol, mg/dL 52.7±0.3 53.4±0.1 0.011
LDL cholesterol, mg/dL 150.5±0.5 97.6±0.2 <0.001
Systolic blood pressure, mmHg 113.2±0.4 107.3±0.2 <0.001
Diastolic blood pressure, mmHg 74.7±0.2 71.0±0.1 <0.001
Fasting blood glucose, mg/dL 95.2±0.5 89.6±0.1 <0.001
Values are presented as mean±standard error or number.
Abbreviations: BMI, body mass index; HDL, high-density lipoprotein; LDL, low-density lipoprotein.
aAll analyses accounted for the complex sampling design effect and appropriate sampling weights of the national survey using the PROC SURVEY in the SAS program (SAS Institute, Cary, NC, USA).
bMean and P values were obtained from the regression analysis after adjustment for age, education, household income, residence, smoking, al- cohol drinking, physical activity, BMI (except for BMI and waist circumference), and total energy intake.
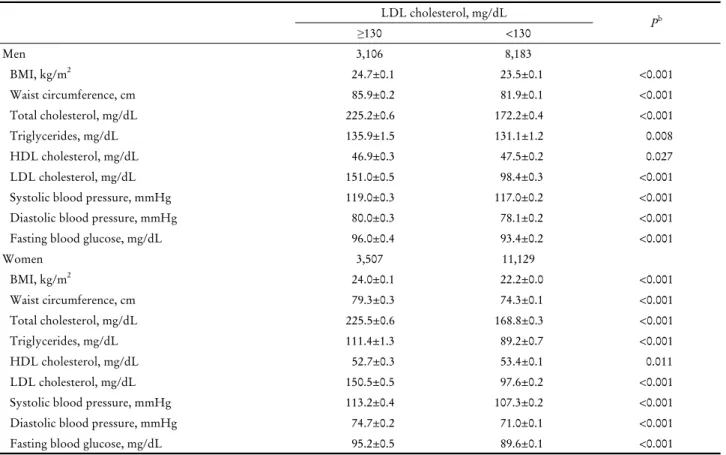
Table 2. Cardiovascular risk factors by LDL cholesterol level
aRESULTS
1. Characteristics of the study subjects by sex
Table 1 shows the characteristics of the study population by sex. Men were more likely than women to be older, live in rural areas, currently smoke and currently drink alcohol, and do physical activity. Men had higher BMI, waist cir- cumference, total cholesterol, triglycerides, LDL cholesterol, systolic and diastolic blood pressure, and fasting blood glu- cose, but a lower level of HDL cholesterol than women (P<0.001).
2. Macronutrient intake by LDL cholesterol level
Energy and macronutrient intakes by sex and LDL cho- lesterol level are shown in Figure 2. Among men, subjects
with LDL cholesterol ≥130 mg/dL consumed significantly less energy and fat than those with LDL cholesterol <130 mg/dL. Women with LDL cholesterol ≥130 mg/dL had a higher carbohydrate intake but lower energy, fat, and pro- tein intakes compared to those with LDL cholesterol <130 mg/dL. Among women, the percentage of subjects who consumed more than the recommended level of carbohy- drates (65% of energy) was higher in the higher LDL cho- lesterol group than the lower LDL cholesterol group (65.2% vs. 53.3%, P<0.001). The proportion of women who consumed more than the recommended level of fat (>30%
of energy) was lower in the higher LDL cholesterol group
compared to those in the lower LDL cholesterol group
(10.4% vs. 14.8%, P<0.001) (Figure 3).
Quintiles of dietary carbohydrate intake, g/day
Q1 Q2 Q3 Q4 Q5
P for trend
LDL cholesterol ≥130 mg/dL
Carbohydrate intake 206.6±2.0 284.2±0.7 339.5±0.8 402.9±1.0 533.9±3.8
Obesity 1.00 (Ref.) 0.92 (0.67-1.27) 0.98 (0.70-1.37) 0.76 (0.54-1.07) 0.73 (0.49-1.11) 0.082 Metabolic syndrome 1.00 (Ref.) 1.40 (0.93-2.12) 1.45 (0.93-2.27) 1.29 (0.81-2.07) 1.79 (1.01-3.20) 0.130 Increased waist circumference 1.00 (Ref.) 0.92 (0.65-1.29) 0.87 (0.60-1.26) 0.64 (0.45-0.93) 0.66 (0.42-1.03) 0.018 Elevated triglycerides 1.00 (Ref.) 1.36 (0.97-1.90) 1.16 (0.83-1.62) 1.46 (1.04-2.05) 1.29 (0.84-1.97) 0.179 Reduced HDL cholesterol 1.00 (Ref.) 1.39 (0.97-1.97) 1.18 (0.81-1.72) 1.76 (1.18-2.62) 2.33 (1.44-3.78) <0.001 Elevated blood pressure 1.00 (Ref.) 0.97 (0.70-1.35) 1.00 (0.71-1.41) 0.84 (0.58-1.20) 0.81 (0.52-1.27) 0.272 Elevated fasting blood glucose 1.00 (Ref.) 0.83 (0.58-1.18) 0.86 (0.59-1.25) 0.78 (0.53-1.16) 0.71 (0.44-1.15) 0.181 Type 2 diabetes 1.00 (Ref.) 0.75 (0.29-1.96) 1.04 (0.42-2.58) 1.20 (0.48-3.00) 0.61 (0.18-2.12) 0.875 Hypercholesterolemiac 1.00 (Ref.) 0.65 (0.45-0.94) 0.81 (0.56-1.18) 0.72 (0.49-1.07) 0.62 (0.39-0.99) 0.112 Hypertriglyceridemia 1.00 (Ref.) 1.19 (0.77-1.82) 0.95 (0.60-1.48) 1.10 (0.71-1.73) 1.02 (0.60-1.75) 0.990 Atherogenic dyslipidemia 1.00 (Ref.) 1.49 (0.92-2.40) 1.44 (0.88-2.36) 1.95 (1.17-3.25) 3.08 (1.67-5.70) <0.001 LDL cholesterol <130 mg/dL
Carbohydrate intake 202.5±1.2 285.1±0.6 341.9±0.5 404.6±0.6 540.1±2.7
Obesity 1.00 (Ref.) 0.94 (0.75-1.16) 1.00 (0.81-1.23) 0.88 (0.70-1.11) 0.86 (0.65-1.13) 0.264 Metabolic syndrome 1.00 (Ref.) 0.92 (0.69-1.23) 1.02 (0.75-1.37) 1.22 (0.90-1.65) 1.19 (0.81-1.73) 0.134 Increased waist circumference 1.00 (Ref.) 0.87 (0.67-1.12) 0.88 (0.68-1.13) 0.89 (0.68-1.18) 0.71 (0.50-1.00) 0.130 Elevated triglycerides 1.00 (Ref.) 0.95 (0.76-1.18) 0.93 (0.74-1.17) 0.93 (0.73-1.18) 1.03 (0.78-1.37) 0.990 Reduced HDL cholesterol 1.00 (Ref.) 1.27 (0.99-1.61) 1.51 (1.19-1.91) 1.77 (1.37-2.30) 2.27 (1.65-3.13) <0.001 Elevated blood pressure 1.00 (Ref.) 0.91 (0.72-1.15) 1.15 (0.90-1.47) 0.92 (0.72-1.19) 0.75 (0.55-1.02) 0.175 Elevated fasting blood glucose 1.00 (Ref.) 0.84 (0.66-1.08) 0.98 (0.76-1.28) 0.82 (0.62-1.07) 0.73 (0.53-0.99) 0.085 Type 2 diabetes 1.00 (Ref.) 0.44 (0.21-0.94) 1.19 (0.66-2.15) 0.51 (0.22-1.15) 0.64 (0.30-1.39) 0.452 Hypercholesterolemiac 1.00 (Ref.) 0.99 (0.75-1.29) 0.87 (0.65-1.16) 0.80 (0.58-1.11) 0.84 (0.58-1.22) 0.182 Hypertriglyceridemia 1.00 (Ref.) 1.33 (1.02-1.72) 1.26 (0.97-1.65) 1.23 (0.92-1.66) 1.29 (0.91-1.82) 0.318 Atherogenic dyslipidemia 1.00 (Ref.) 1.29 (0.97-1.73) 1.24 (0.92-1.66) 1.56 (1.13-2.15) 2.25 (1.50-3.37) <0.001 Values are presented as mean±standard error or OR (95% CI).
Abbreviations: CI, confidence interval; HDL, high-density lipoprotein; LDL, low-density lipoprotein; OR, odds ratio; Ref., reference.
aAll analyses accounted for the complex sampling design effect and appropriate sampling weights of the national survey using the PROC SURVEY in the SAS program (SAS Institute, Cary, NC, USA).
bORs (95% CIs) and P for trend were obtained from the logistic regression after adjustment for age, residence, education, household income, smoking, alcohol consumption, physical activity, body mass index (except for obesity and waist circumference), and total energy intake.
cHypercholesterolemia was defined as total cholesterol ≥240 mg/dL for individuals with LDL cholesterol ≥130 mg/dL and total cholesterol
≥200 mg/dL for individuals with LDL cholesterol <130 mg/dL.
Table 3. Association of dietary carbohdyrate intake with cardiovascular risk factors by LDL cholesterol level in men
a,b3. Cardiovascular risk factors by LDL cholesterol level
Table 2 presents the mean values of cardiovascular risk factors by sex and LDL cholesterol level. In both men and women, subjects with LDL cholesterol ≥130 mg/dL had higher levels of BMI, waist circumference, total cholesterol, triglycerides, systolic and diastolic blood pressure, and fast- ing blood glucose, but lower levels of HDL cholesterol, than subjects with LDL cholesterol <130 mg/dL.
4. Association between dietary carbohydrate intake and cardiovascular risk factors by LDL cholesterol level in men
Table 3 presents the association between dietary carbohy-
drate intake and cardiovascular risk factors by LDL choles-
terol in men. Among men with LDL cholesterol ≥130
mg/dL, dietary carbohydrate intake was positively asso-
ciated with reduced HDL cholesterol and atherogenic dysli-
Quintiles of dietary carbohdyrate intake, g/day
Q1 Q2 Q3 Q4 Q5
P for trend
LDL cholesterol ≥130 mg/dL
Carbohydrate intake 153.7±1.4 219.9±0.7 270.3±0.6 324.1±0.9 448.0±4.0
Obesity 1.00 (Ref.) 0.82 (0.58-1.15) 0.91 (0.63-1.33) 0.98 (0.66-1.46) 0.83 (0.47-1.46) 0.879 Metabolic syndrome 1.00 (Ref.) 1.20 (0.74-1.94) 1.20 (0.73-1.98) 1.33 (0.75-2.37) 1.04 (0.49-2.21) 0.596 Increased waist circumference 1.00 (Ref.) 0.88 (0.60-1.30) 1.17 (0.79-1.74) 1.12 (0.72-1.74) 0.88 (0.48-1.60) 0.751 Elevated triglycerides 1.00 (Ref.) 1.11 (0.74-1.68) 1.16 (0.76-1.76) 1.33 (0.84-2.11) 0.96 (0.51-1.82) 0.548 Reduced HDL cholesterol 1.00 (Ref.) 1.39 (0.99-1.94) 1.36 (0.95-1.95) 1.59 (1.06-2.37) 1.62 (0.94-2.80) 0.060 Elevated blood pressure 1.00 (Ref.) 1.32 (0.87-2.01) 0.69 (0.43-1.11) 1.15 (0.70-1.90) 0.69 (0.35-1.38) 0.436 Elevated fasting blood glucose 1.00 (Ref.) 0.84 (0.56-1.27) 0.95 (0.61-1.48) 1.04 (0.62-1.74) 1.09 (0.55-2.18) 0.687 Type 2 diabetes 1.00 (Ref.) 0.44 (0.16-1.22) 0.30 (0.11-0.83) 0.47 (0.16-1.44) 0.17 (0.03-0.93) 0.096 Hypercholesterolemiac 1.00 (Ref.) 1.18 (0.82-1.69) 1.20 (0.82-1.77) 1.09 (0.72-1.66) 0.99 (0.56-1.77) 0.977 Hypertriglyceridemia 1.00 (Ref.) 1.19 (0.68-2.09) 0.96 (0.53-1.75) 1.38 (0.66-2.88) 0.97 (0.30-3.15) 0.738 Atherogenic dyslipidemia 1.00 (Ref.) 1.14 (0.72-1.83) 1.19 (0.73-1.94) 1.40 (0.80-2.42) 1.29 (0.62-2.67) 0.312 LDL cholesterol <130 mg/dL
Carbohydrate intake 153.4±0.8 219.9±0.4 268.9±0.4 324.6±0.4 445.3±2.4
Obesity 1.00 (Ref.) 0.81 (0.65-1.02) 0.82 (0.64-1.06) 0.84 (0.64-1.12) 0.81 (0.57-1.17) 0.344 Metabolic syndrome 1.00 (Ref.) 1.27 (0.89-1.82) 0.90 (0.59-1.37) 1.02 (0.65-1.60) 0.86 (0.48-1.54) 0.476 Increased waist circumference 1.00 (Ref.) 0.84 (0.64-1.10) 0.83 (0.62-1.11) 0.95 (0.69-1.29) 0.82 (0.55-1.22) 0.618 Elevated triglycerides 1.00 (Ref.) 1.12 (0.85-1.47) 1.05 (0.77-1.43) 1.00 (0.71-1.42) 1.14 (0.74-1.75) 0.878 Reduced HDL cholesterol 1.00 (Ref.) 1.08 (0.89-1.30) 1.18 (0.97-1.44) 1.26 (1.01-1.57) 1.33 (0.99-1.78) 0.025 Elevated blood pressure 1.00 (Ref.) 0.94 (0.71-1.23) 0.88 (0.65-1.20) 0.80 (0.56-1.14) 0.83 (0.52-1.32) 0.282 Elevated fasting blood glucose 1.00 (Ref.) 1.06 (0.80-1.41) 1.13 (0.83-1.55) 0.96 (0.69-1.33) 0.74 (0.48-1.12) 0.294 Type 2 diabetes 1.00 (Ref.) 1.95 (0.63-6.10) 2.26 (0.66-7.72) 1.15 (0.32-4.08) 2.06 (0.29-14.58) 0.723 Hypercholesterolemiac 1.00 (Ref.) 0.84 (0.63-1.12) 0.89 (0.66-1.20) 0.51 (0.36-0.72) 0.62 (0.41-0.94) 0.002 Hypertriglyceridemia 1.00 (Ref.) 0.89 (0.62-1.29) 0.94 (0.61-1.43) 0.67 (0.43-1.04) 0.73 (0.41-1.29) 0.146 Atherogenic dyslipidemia 1.00 (Ref.) 1.30 (0.95-1.78) 1.25 (0.87-1.78) 1.20 (0.80-1.80) 1.46 (0.88-2.41) 0.328 Values are presented as mean±standard error or OR (95% CI).
Abbreviations: CI, confidence interval; HDL, high-density lipoprotein; LDL, low-density lipoprotein; OR, odds ratio; Ref., reference.
aAll analyses accounted for the complex sampling design effect and appropriate sampling weights of the national survey using the PROC SURVEY in the SAS program (SAS Institute, Cary, NC, USA).
bORs (95% CIs) and P for trend were obtained from the logistic regression after adjustment for age, residence, education, household income, smoking, alcohol drinking, physical activity, body mass index (except for obesity and waist circumference), and total energy intake.
cHypercholesterolemia was defined as total cholesterol ≥240 mg/dL for individuals with LDL cholesterol ≥130 mg/dL and total cholesterol
≥200 mg/dL for individuals with LDL cholesterol <130 mg/dL.