Association between Promoter Polymorphisms of TFF1, TFF2, and TFF3 and the Risk of Gastric and Diffuse Gastric Cancers in a Korean Population
Gastric cancer is one of the most common cancers in the world. The aims of this study were to evaluate the association between polymorphisms in TFF gene family, TFF1, TFF2, and TFF3 and the risk of gastric cancer (GC) and GC subgroups in a Korean population via a case-control study. The eight polymorphisms in TFF gene family were identified by sequencing and genotyped with 377 GC patients and 396 controls by using TaqMan genotyping assay. The rs184432 TT genotype of TFF1 was significantly associated with a reduced risk of GC (odds ratio, [OR) = 0.45; 95% confidence interval, [CI] = 0.25-0.82;
P = 0.009), more protective against diffuse-type GC (OR = 0.20; 95% CI = 0.05-0.89;
P = 0.035) than GC (OR = 0.34; 95% CI = 0.14-0.82; P = 0.017) in subjects aged
< 60 yr, and correlated with lymph node metastasis negative GC and diffuse-type GC (OR = 0.44; 95% CI = 0.23-0.86; P = 0.016 and OR = 0.20; 95% CI = 0.05-0.87;
P = 0.031, respectively). In addition, a decreased risk of lymph node metastasis negative GC and diffuse-type GC was observed for rs225359 TT genotype of TFF1 (OR = 0.46, 95%
CI = 0.24-0.88; P = 0.020 and OR = 0.21, 95% CI = 0.05-0.88; P = 0.033, respectively).
These findings suggest that the rs184432 and rs225359 polymorphisms in TFF1 have protective effects for GC and contribute to the development of GC in Korean individuals.
Keywords: Control-case Studies; Diffuse Type; Gastric Neoplasms; Polymorphism; TFF1 Protein, Human; TFF2 Protein, Human; TFF3 Protein, Human
Eun-Heui Jin,1* Sang-Il Lee,2* JaeWoo Kim,1 Eun Young Seo,3 Su Yel Lee,4 Gang Min Hur,5 Sanghee Shin,5 and Jang Hee Hong1,5
1Clinical Trials Center, 2Department of Surgery, Chungnam National University Hospital, Daejeon,
3Department of Dermatology, Seoul National University College of Medicine, Seoul, 4National Biobank of Korea, Chungnam National University Hospital, Daejeon, 5Department of Pharmacology, College of Medicine, Chungnam National University, Daejeon, Korea
* Eun-Heui Jin and Sang-Il Lee contributed equally to this work.
Received: 17 December 2014 Accepted: 17 April 2015 Address for Correspondence:
Jang Hee Hong, MD
Department of Pharmacology, College of Medicine, Chungnam National University, 266 Munhwa-ro, Jung-gu, Daejeon 301-131, Korea
Tel: +82.42-280-8718, Fax: +82.42-280-8716 E-mail: [email protected]
Funding: This research was supported by a grant of the Korea Health Technology R&D Project Ministry of Health & Welfare, Republic of Korea (grant number: HI14C1731), a research fund of Chungnam National University, and Basic Science Research Program through the National Research Foundation of Korea (NRF) funded by the Ministry of Education (grant numbe: NRF- 2014R1A6A1029617).
http://dx.doi.org/10.3346/jkms.2015.30.8.1035 • J Korean Med Sci 2015; 30: 1035-1041
INTRODUCTION
Gastric cancer (GC) is one of the most common cancers affect- ing people worldwide. In the past few decades, the incidence and mortality rates of GC have steadily declined in several coun- tries. However, these rates continue to be high in Asian coun- tries. Particularly, in Korea, GC is the third-most common can- cer, with 34,478 new cases and 7,876 deaths recorded in 2014, as per the report of the Korea National Cancer Center (1-3).
Until date, several studies have reported that genetic altera- tion including single nucleotide polymorphisms (SNPs) in tu- mor suppressor genes such as those encoding adenomatous polyposis coli, tumor protein p53, tumor protein p73, deleted in colon cancer, and fragile histidine triad may play an important role in defining susceptibility to GC (4-13).
In addition, trefoil factor 1 (TFF1) is a tumor suppressor gene (14) belonging to the TFF family. The TFF protein family consists of TFF1, TFF2, and TFF3, which are expressed and secreted in the mucous cells of the human stomach and protect the gastro- intestinal epithelium (15-17). TFF are clustered in a 50-kb region of the chromosome 21q22.3 (18, 19). The abnormal expression levels of TFF proteins have been reported to be associated with the progression and development of several cancers such as co- lon cancer (20, 21), breast cancer (22, 23), prostate cancer (24, 25), and lung cancer (26). Some evidence suggests that TFF ex- pression is involved in GC progression. TFF1-knockout mice developed antral adenomas, and 30% of them further developed multiple gastric carcinomas (27). TFF1 was normally expressed in gastric mucosa, but the expression of TFF1 and TFF2 was sig- nificantly lower in carcinomas than in normal tissues (28, 29).
Human Genetics & Genomics
Both decreased TFF1 and TFF2 expression and increased TFF3 expression have been reported in gastric carcinoma (30). Fur- thermore, downregulation of TFF1 expression and upregulation of TFF3 expression have also been reported in GC (31). Recently, association studies between polymorphisms of TFF and GC susceptibility were reported in two different ethnic groups: a polymorphism in the promoter region of TFF1 was associated with GC development in an Iranian population, and promoter polymorphisms of TFF2 and TFF3 were associated with GC sus- ceptibility in a Chinese population (32, 33). Therefore, we hy- pothesized that the polymorphisms in TFF play a critical role in GC progression and development.
In the present study, we elucidated the relevance of polymor- phisms in the coding and promoter regions of the TFF family to the risk of GC and GC subgroups in order to clarify our hypoth- esis in the Korean population.
MATERIALS AND METHODS Subjects
This case-control study group included 377 patients with GC (267 men, 110 women) with a mean age of 60.1 ± 11.8 yr and 396 healthy controls (132 men, 264 women) with a mean age of 58.7 ± 9.0 yr. The blood samples used in this study were provid- ed by the Chungnam National Hospital Biobank, which is a mem- ber of the National Biobank of Korea and is supported and au- dited by the Ministry of Health and Welfare of Korea. GC patients were recruited from the outpatient clinic at the Chungnam Na- tional University Hospital and classified according to Lauren’s classification (34). The healthy controls were randomly selected from among healthy volunteers visiting the Chungnam Nation- al University Hospital medical center for their annual physical examinations and who had no history of cancer.
DNA preparation and SNP identification
Genomic DNA was extracted from the peripheral blood by us- ing the QIAamp DNA Blood Mini Kit (Qiagen GmbH, Hilden, Germany) according to the manufacturer’s instructions. To iden- tify polymorphic sites in TFF1, TFF2, and TFF3, all exons includ- ing intron-exon boundaries, 1.5 kb of the 5′-flanking region, and the 3′-untranslated region (UTR) were amplified by polymerase chain reaction (PCR) with genomic DNA in 24 GC patients and 24 healthy controls. PCR was performed with 50 ng of genomic DNA, Taq DNA polymerase (EF Taq, SolGent, Daejon, Korea), and 0.5 pM of each primer under the following conditions: 30 cycles of denaturation for 10 sec at 98°C, annealing for 30 sec at 65°C, extension for 2 min at 72°C, and a final extension for 10 min at 72°C in a thermocycler (Gene Amp PCR System 9700;
Applied Biosystems, Foster, CA, USA). The PCR product was used as a template for sequencing. The SNPs of TFF1, TFF2, and TFF3 were detected by a sequence analysis based on the refer-
ence sequence of human chromosome 21 (GenBank accession number: NT_011512.12).
Genotyping
Genotyping for the SNPs in TFF1 (rs184432, rs35448902, rs225359, and rs2156310), TFF2 (rs3814896, rs13052596, and rs225334), and TFF3 (rs225362) was performed by using the Applied Biosystems TaqMan SNP Genotyping Assay with the StepOnePlus Real-time PCR System (Applied Biosystems).
Statistical analysis
Chi-square tests were used to estimate the Hardy-Weinberg equilibrium (HWE) of each SNP and to detect age and gender in the GC and control groups. The association between the GC and control groups was analyzed by chi-square test. We used binary logistic regression to estimate the GC risk by odds ratios (OR) and 95% confidence intervals (CI). All statistical analyses were performed by using the SPSS (SPSS Inc., Chicago, IL, USA), version 20.0 for windows. P < 0.05 was considered statistically significant.
Ethics statement
All individuals enrolled in this study provided their written in- formed consent for blood collection and use. The study proto- col was approved by the institutional review board of the Chun- gnam National University Hospital (IRB No. 2013-08-008).
RESULTS
The characteristics of the 377 GC cases and 396 controls are shown in Table 1. No significant difference was noted between GC cases and controls in the distribution of age (P = 0.063), whereas the distribution of gender of GC case differed from that of controls (P < 0.001). Of the 377 GC cases, 194 (51.5%) were classified as intestinal type, 138 (36.6 %) as diffuse-type, 39 (10.3%) as mixed-type, and 6 (1.6%) were unclassified. GC cas- es comprised of 264 (30.0%) negative cases and 113 (70%) posi- tive cases for lymph node metastasis.
We conducted sequencing to detect SNPs with a minor allele frequency greater than 5% in 24 GC patients and 24 healthy con- trols (35). We identified 4 SNPs in TFF1 (rs184432, rs35448902, and rs225359 in the promoter region and rs2156310 in the 5′UTR), 3 SNPs in TFF2 (rs3814896 and rs13052596 in the pro- moter region and rs225334 in the 3′UTR), and 1 SNP in TFF3 (rs225362 in the promoter region) through gene sequencing.
The genotype frequencies of 8 SNPs (rs184432, rs35448902, rs22535, rs2156310, rs3814896, rs13052596, rs225334, and rs225362) were in the HWE in both GC cases and controls (P >
0.05; data not shown).
To determine whether TFF1, TFF2, and TFF3 variations were associated with the risk of GC or GC subgroups, we analyzed the
genotypes and allele frequencies of TFF SNPs. The genotype and allele frequencies of rs184432 in TFF1 were significantly associat- ed with a decreased GC risk (OR = 0.45, 95% CI = 0.25-0.82, P = 0.009 and OR = 0.75, 95% CI = 0.59-0.94, P = 0.012, respectively), whereas the remaining SNPs showed no association (Table 2, Supplementary Table 1).
Furthermore, stratification analyses were performed to eval- uate the possible correlation of genetic variations of TFF1, TFF2, and TFF3 with the risk of GC or GC subgroups according to the age. Stratified analysis revealed that the genotype and allele fre- quencies of TFF1 rs184432 were significantly associated with a decreased risk of GC among subjects aged < 60 yr (OR = 0.34, 95% CI = 0.14-0.82, P = 0.017 and OR = 0.69, 95% CI = 0.49-0.96, P = 0.028, respectively), but not in subjects aged ≥ 60 yr. In ad- dition, we found that the genotype and allele frequencies of TFF1 rs184432 were related to a reduced risk of the develop- ment of diffuse-type GC in subjects aged < 60 yr (OR = 0.20, 95% CI = 0.05-0.89, P = 0.035 and OR = 0.60, 95% CI = 0.38- 0.95, P = 0.028, respectively), but not in subjects aged ≥ 60 yr (Table 3). We observed the lack of association between TFF2 (rs3814896, rs13052596, and rs225334) and TFF3 (rs225362) SNPs, GC risk, and age (data not shown).
In the present study, we investigated whether TFF SNPs were related to lymph node metastasis of GC or GC subgroups. The frequencies of CT and TT genotypes and T allele were associat- ed with a decreased risk of GC, indicating negative lymph node metastasis (OR = 0.71, 95% CI = 0.51-1.00, P = 0.048; OR = 0.44, 95% CI = 0.23-0.86, P = 0.016 and OR = 0.68, 95% CI = 0.52-0.88, P = 0.003, respectively). In addition, an association of the TFF1 rs225359 TT genotype and T allele with a decreased risk of GC was noted, indicating negative lymph node metastasis, as com- pared to that of the TFF1 rs225359 CC genotype and C allele, re- spectively (OR = 0.46, 95% CI = 0.24-0.88, P = 0.020 and
OR = 0.77, 95% CI = 0.59-0.99, P = 0.041, respectively) (Table 4).
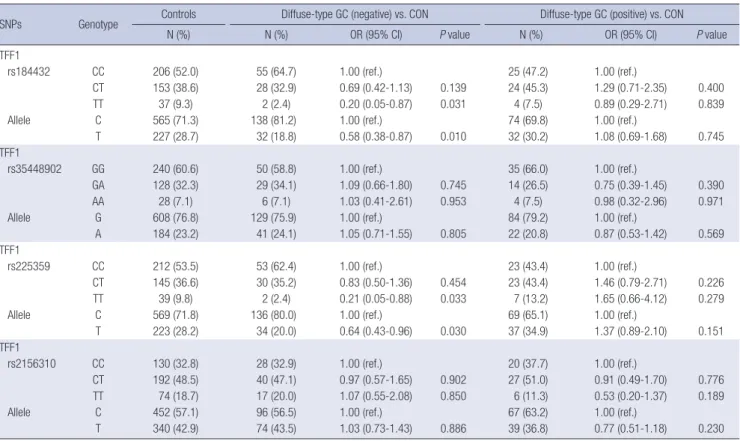
To estimate the relevance of TFF variations and lymph node metastasis in intestinal and diffuse-type GC, we conducted a lo- gistic regression analysis. The TFF1 rs184432 TT genotype and T allele were related to a decreased risk of diffuse-type GC, indi- cating negative lymph node metastasis (OR = 0.20, 95% CI = 0.05-0.87, P = 0.031 and OR = 0.58, 95% CI = 0.38-0.87, P = 0.01, respectively). Further analyses revealed a significant association of TFF1 rs225359 TT genotype and T allele with a decreased risk of diffuse-type GC, indicating negative lymph node metastasis (OR = 0.21, 95% CI = 0.05-0.88, P = 0.033 and OR = 0.64, 95%
CI = 0.43-0.96, P = 0.030, respectively) (Table 5). No association was observed between TFF2 (rs3814896, rs13052596, and rs 225334) and TFF3 (rs225362) SNPs and lymph node metastasis of GC and GC subgroups (data not shown).
DISCUSSION
Until date, it has been implicated that alteration of TFF expres- sion affects the development of several types of cancers. Re- cently, the association between polymorphisms of TFF and the development of GC was reported in Iranian and Chinese popu- lations, but not in a Korean population (32,33). In the present study, we focused on TFF polymorphisms. The aim of this study Table 1. Characteristics of gastric cancer patients and controls enrolled in the genet-
ic analyses
Variables Case
N (%)
Control
N (%) P value*
All subjects 377 (100) 396 (100)
Age (yr) (mean ± SD) 60.1 ± 11.8 58.7 ± 9.0
< 60 169 (44.8) 204 (51.5) 0.063
≥ 60 208 (55.2) 192 (48.5)
Gender
Male 267 (70.8) 132 (33.3) < 0.001
Female 110 (29.2) 264 (66.7)
Histological type
Intestinal 194 (51.5)
Diffuse 138 (36.6)
Mixed 39 (10.3)
Unclassified 6 (1.6)
Lymph node metastasis
Negative 264 (70.0)
Positive 113 (30.0)
*Two-sided chi-square test.
Table 2. Genotype and allele frequencies of TFF1 polymorphisms among gastric cancer patients and controls and their association with gastric cancer risk
SNPs Geno-
type
Controls GC vs. CON
N (%) N (%) OR (95% CI) P value
TFF1
rs184432 CC 206 (52.0) 221 (58.6) 1.00 (ref.)
CT 153 (38.6) 138 (36.6) 0.84 (0.62-1.13) 0.254 TT 37 (9.3) 18 (4.8) 0.45 (0.25-0.82) 0.009 Allele C 565 (71.3) 580 (76.9) 1.00 (ref.)
T 227 (28.7) 174 (23.1) 0.75 (0.59-0.94) 0.012 TFF1
rs35448902 GG 240 (60.6) 228 (60.5) 1.00 (ref.)
GA 128 (32.3) 125 (33.2) 1.03 (0.76-1.40) 0.860 AA 28 (7.1) 24 (6.4) 0.90 (0.51-1.60) 0.726 Allele G 608 (76.8) 581 (77.1) 1.00 (ref.)
A 184 (23.2) 173 (22.9) 0.98 (0.78-1.25) 0.893 TFF1
rs225359 CC 212 (53.5) 209 (55.4) 1.00 (ref.)
CT 145 (36.6) 145 (38.5) 1.01 (0.75-1.37) 0.926 TT 39 (9.8) 23 (6.1) 0.60 (0.35-1.04) 0.067 Allele C 569 (71.8) 563 (74.7) 1.00 (ref.)
T 223 (28.2) 191 (25.3) 0.87 (0.69-1.09) 0.210 TFF1
rs2156310 CC 130 (32.8) 130 (34.5) 1.00 (ref.)
CT 192 (48.5) 179 (47.5) 0.93 (0.68-1.28) 0.665 TT 74 (18.7) 68 (18.0) 0.92 (0.61-1.38) 0.686 Allele C 452 (57.1) 439 (58.2) 1.00 (ref.)
T 340 (42.9) 315 (41.8) 0.95 (0.78-1.17) 0.647 SNPs, single nucleotide polymorphism; GC, gastric cancer; CON, controls; OR, odds ratio; CI, confidence interval.
was to investigate whether polymorphisms in TFF were associ- ated with the risk of GC or GC subgroups in the Korean popula- tion. We scanned a Korean-specific polymorphism by sequenc- ing the functional region of TFF that directly affect the gene ex- pression, such as an exon, an exon boundary, and a promoter region. However, we did not detect any Korean-specific novel SNP. We finally selected 8 SNPs, 6 SNPs in the promoter region, 1 SNP in 5′UTR, and 1 SNP in 3′UTR after eliminating the SNP in tight LD (|D’| = 1 or r2= 1) for genotyping. The proportion of
men in the test cases was higher than that in the control cases, whereas the trend in women was reverse (Table 1). To evaluate whether the difference of the proportion of gender is associated with GC risk, we attempted stratified analysis by gender, but any association between TFF SNPs, GC risk, and gender was not ob- served (data not shown). This result represented that the corre- lation between TFF SNPs and GC risk is not affected by gender.
In our study, TT genotype and T allele of rs184432 in the pro- moter region of TFF1 was significantly associated with a reduced Table 3. Stratified analysis of TFF1 polymorphisms in gastric cancer patients and controls by age
SNPs Genotype Controls GC vs. CON Diffuse-type GC vs. CON
N (%) N (%) OR (95% CI) P value N (%) OR (95% CI) P value
TFF1
rs184432 CC 109 (53.4) 103 (60.9) 1.00 (ref.) 49 (63.6) 1.00 (ref.)
Age CT 73 (35.8) 59 (34.9) 0.86 (0.55-1.32) 0.482 26 (33.8) 0.79 (0.45-1.39) 0.415
< 60 TT 22 (10.8) 7 (4.1) 0.34 (0.14-0.82) 0.017 2 (2.6) 0.20 (0.05-0.89) 0.035
Allele C 291 (71.3) 265 (78.4) 1.00 (ref.) 124 (80.5) 1.00 (ref.)
T 117 (28.7) 73 (21.6) 0.69 (0.49-0.96) 0.028 30 (19.5) 0.60 (0.38-0.95) 0.028
≥ 60 CC 97 (50.5) 118 (56.7) 1.00 (ref.) 31 (50.8) 1.00 (ref.)
CT 80 (41.7) 79 (38.0) 0.81 (0.54-1.22) 0.320 23 (37.7) 0.90 (0.49-1.66) 0.736
TT 15 (7.8) 11 (5.3) 0.60 (0.27-1.37) 0.228 7 (11.5) 1.46 (0.55-3.91) 0.451
Allele C 274 (71.4) 315 (75.7) 1.00 (ref.) 85 (69.7) 1.00 (ref.)
T 110 (28.6) 101 (24.3) 0.80 (0.58-1.09) 0.162 37 (30.3) 1.08 (0.70-1.69) 0.722
TFF1
rs35448902 GG 119 (58.3) 93 (55.0) 1.00 (ref.) 44 (57.1) 1.00 (ref.)
Age GA 72 (35.3) 64 (37.9) 1.14 (0.74-1.75) 0.560 27 (35.1) 1.01 (0.58-1.78) 0.961
< 60 AA 13 (6.4) 12 (7.1) 1.18 (0.52-2.71) 0.694 6 (7.8) 1.25 (0.45-3.49) 0.672
Allele G 310 (76.0) 250 (74.0) 1.00 (ref.) 115 (74.7) 1.00 (ref.)
A 98 (24.0) 88 (26.0) 1.11 (0.80-1.55) 0.526 39 (25.3) 1.07 (0.70-1.65) 0.748
≥ 60 GG 121 (63.0) 135 (64.9) 1.00 (ref.) 41 (67.2) 1.00 (ref.)
GA 56 (29.2) 61 (29.3) 0.98 (0.63-1.51) 0.915 16 (26.2) 0.84 (0.44-1.63) 0.612
AA 15 (7.8) 12 (5.8) 0.72 (0.32-1.59) 0.414 4 (6.6) 0.79 (0.25-2.51) 0.685
Allele G 298 (77.6) 331 (79.6) 1.00 (ref.) 98 (80.3) 1.00 (ref.)
A 86 (22.4) 85 (20.4) 0.89 (0.64-1.25) 0.499 24 (19.7) 0.85 (0.51-1.41) 0.525
TFF1
rs225359 CC 110 (53.9) 94 (55.6) 1.00 (ref.) 44 (57.1) 1.00 (ref.)
Age CT 73 (35.8) 65 (38.5) 1.04 (0.68-1.61) 0.852 30 (39.0) 1.03 (0.59-1.78) 0.923
< 60 TT 21 (10.3) 10 (5.9) 0.56 (0.25-1.24) 0.153 3 (3.9) 0.36 (0.10-1.26) 0.109
Allele C 293 (71.8) 253 (74.9) 1.00 (ref.) 118 (76.6) 1.00 (ref.)
T 115 (28.2) 85 (25.1) 0.86 (0.62-1.19) 0.351 36 (23.4) 0.78 (0.51-1.20) 0.252
≥ 60 CC 102 (53.1) 115 (55.3) 1.00 (ref.) 32 (52.5) 1.00 (ref.)
CT 72 (37.5) 80 (38.5) 0.99 (0.65-1.49) 0.945 23 (37.7) 1.02 (0.55-1.88) 0.954
TT 18 (9.4) 13 (6.3) 0.64 (0.30-1.37) 0.252 6 (9.8) 1.06 (0.39-2.91) 0.906
Allele C 276 (71.9) 310 (74.5) 1.00 (ref.) 87 (71.3) 1.00 (ref.)
T 108 (28.1) 106 (25.5) 0.87 (0.64-1.20) 0.399 35 (28.7) 1.03 (0.66-1.61) 0.904
TFF1
rs2156310 CC 64 (31.4) 57 (33.7) 1.00 (ref.) 28 (36.4) 1.00 (ref.)
Age CT 99 (48.5) 83 (49.1) 0.94 (0.59-1.49) 0.797 35 (45.4) 0.81 (0.45-1.46) 0.478
< 60 TT 41 (20.1) 29 (17.2) 0.79 (0.44-1.44) 0.448 14 (18.2) 0.78 (0.37-1.66) 0.518
Allele C 227 (55.6) 197 (58.3) 1.00 (ref.) 91 (59.1) 1.00 (ref.)
T 181 (44.4) 141 (41.7) 0.90 (0.67-1.20) 0.468 63 (40.9) 0.87 (0.60-1.26) 0.461
≥ 60 CC 66 (34.4) 73 (35.1) 1.00 (ref.) 20 (32.8) 1.00 (ref.)
CT 93 (48.4) 96 (46.2) 0.93 (0.60-1.45) 0.757 32 (52.4) 1.14 (0.60-2.16) 0.698
TT 33 (17.2) 39 (18.7) 1.07 (0.60-1.89) 0.820 9 (14.8) 0.90 (0.37-2.19) 0.817
Allele C 225 (58.6) 242 (58.2) 1.00 (ref.) 72 (59.0) 1.00 (ref.)
T 159 (41.4) 174 (41.8) 1.02 (0.77-1.35) 0.904 50 (41.0) 0.98 (0.65-1.49) 0.934
SNPs, single nucleotide polymorphism; GC, gastric cancer; CON, controls; OR, odds ratio; CI, confidence interval.
Table 4. Association of genetic polymorphisms in TFF1 with lymph node metastasis of gastric cancer
SNPs Genotype Controls GC (negative) vs. CON GC (positive) vs. CON
N (%) N (%) OR (95% CI) P value N (%) OR (95% CI) P value
TFF1
rs184432 CC 206 (52.0) 164 (62.1) 1.00 (ref.) 57 (50.4) 1.00 (ref.)
CT 153 (38.6) 87 (33.0) 0.71 (0.51-1.00) 0.048 51 (45.2) 1.21 (0.78-1.86) 0.398
TT 37 (9.3) 13 (4.9) 0.44 (0.23-0.86) 0.016 5 (4.4) 0.49 (0.18-1.30) 0.151
Allele C 565 (71.3) 415 (78.6) 1.00 (ref.) 165 (73.0) 1.00 (ref.)
T 227 (28.7) 113 (21.4) 0.68 (0.52-0.88) 0.003 61 (27.0) 0.92 (0.66-1.28) 0.623
TFF1
rs35448902 GG 240 (60.6) 155 (58.7) 1.00 (ref.) 73 (64.6) 1.00 (ref.)
GA 128 (32.3) 94 (35.6) 1.14 (0.81-1.59) 0.451 31 (27.4) 0.80 (0.50-1.28) 0.344
AA 28 (7.1) 15 (5.7) 0.83 (0.43-1.60) 0.578 9 (8.0) 1.06 (0.48-2.34) 0.892
Allele G 608 (76.8) 404 (76.5) 1.00 (ref.) 177 (78.3) 1.00 (ref.)
A 184 (23.2) 124 (23.5) 1.01 (0.78-1.32) 0.915 49 (21.7) 0.92 (0.64-1.31) 0.625
TFF1
rs225359 CC 212 (53.5) 155 (58.7) 1.00 (ref.) 54 (47.8) 1.00 (ref.)
CT 145 (36.6) 96 (36.4) 0.91 (0.65-1.26) 0.557 49 (43.4) 1.33 (0.85-2.06) 0.209
TT 39 (9.8) 13 (4.9) 0.46 (0.24-0.88) 0.020 10 (8.8) 1.01 (0.47-2.14) 0.986
Allele C 569 (71.8) 406 (76.9) 1.00 (ref.) 157 (69.5) 1.00 (ref.)
T 223 (28.2) 122 (23.1) 0.77 (0.59-0.99) 0.041 69 (30.5) 1.12 (0.81-1.55) 0.486
TFF1
rs2156310 CC 130 (32.8) 86 (32.6) 1.00 (ref.) 44 (38.9) 1.00 (ref.)
CT 192 (48.5) 127 (48.1) 1.00 (0.70-1.42) 0.999 52 (46.1) 0.80 (0.51-1.27) 0.341
TT 74 (18.7) 51 (19.3) 1.04 (0.67-1.63) 0.858 17 (15.0) 0.68 (0.36-1.27) 0.227
Allele C 452 (57.1) 299 (56.6) 1.00 (ref.) 140 (61.9) 1.00 (ref.)
T 340 (42.9) 229 (43.4) 1.02 (0.82-1.27) 0.874 86 (38.1) 0.82 (0.60-1.11) 0.190
SNPs, single nucleotide polymorphism; GC, gastric cancer; CON, controls; OR, odds ratio; CI, confidence interval.
Table 5. Association of genetic polymorphisms in TFF1 with lymph node metastasis of diffuse-type gastric cancer
SNPs Genotype Controls Diffuse-type GC (negative) vs. CON Diffuse-type GC (positive) vs. CON
N (%) N (%) OR (95% CI) P value N (%) OR (95% CI) P value
TFF1
rs184432 CC 206 (52.0) 55 (64.7) 1.00 (ref.) 25 (47.2) 1.00 (ref.)
CT 153 (38.6) 28 (32.9) 0.69 (0.42-1.13) 0.139 24 (45.3) 1.29 (0.71-2.35) 0.400
TT 37 (9.3) 2 (2.4) 0.20 (0.05-0.87) 0.031 4 (7.5) 0.89 (0.29-2.71) 0.839
Allele C 565 (71.3) 138 (81.2) 1.00 (ref.) 74 (69.8) 1.00 (ref.)
T 227 (28.7) 32 (18.8) 0.58 (0.38-0.87) 0.010 32 (30.2) 1.08 (0.69-1.68) 0.745
TFF1
rs35448902 GG 240 (60.6) 50 (58.8) 1.00 (ref.) 35 (66.0) 1.00 (ref.)
GA 128 (32.3) 29 (34.1) 1.09 (0.66-1.80) 0.745 14 (26.5) 0.75 (0.39-1.45) 0.390
AA 28 (7.1) 6 (7.1) 1.03 (0.41-2.61) 0.953 4 (7.5) 0.98 (0.32-2.96) 0.971
Allele G 608 (76.8) 129 (75.9) 1.00 (ref.) 84 (79.2) 1.00 (ref.)
A 184 (23.2) 41 (24.1) 1.05 (0.71-1.55) 0.805 22 (20.8) 0.87 (0.53-1.42) 0.569
TFF1
rs225359 CC 212 (53.5) 53 (62.4) 1.00 (ref.) 23 (43.4) 1.00 (ref.)
CT 145 (36.6) 30 (35.2) 0.83 (0.50-1.36) 0.454 23 (43.4) 1.46 (0.79-2.71) 0.226
TT 39 (9.8) 2 (2.4) 0.21 (0.05-0.88) 0.033 7 (13.2) 1.65 (0.66-4.12) 0.279
Allele C 569 (71.8) 136 (80.0) 1.00 (ref.) 69 (65.1) 1.00 (ref.)
T 223 (28.2) 34 (20.0) 0.64 (0.43-0.96) 0.030 37 (34.9) 1.37 (0.89-2.10) 0.151
TFF1
rs2156310 CC 130 (32.8) 28 (32.9) 1.00 (ref.) 20 (37.7) 1.00 (ref.)
CT 192 (48.5) 40 (47.1) 0.97 (0.57-1.65) 0.902 27 (51.0) 0.91 (0.49-1.70) 0.776
TT 74 (18.7) 17 (20.0) 1.07 (0.55-2.08) 0.850 6 (11.3) 0.53 (0.20-1.37) 0.189
Allele C 452 (57.1) 96 (56.5) 1.00 (ref.) 67 (63.2) 1.00 (ref.)
T 340 (42.9) 74 (43.5) 1.03 (0.73-1.43) 0.886 39 (36.8) 0.77 (0.51-1.18) 0.230
SNPs, single nucleotide polymorphisms; GC, gastric cancer; CON, controls; OR, odds ratio; CI, confidence interval.
risk of GC. In addition, in our age-stratified analysis, TT genotype and T allele of rs184432 were associated with a decreased risk of GC and diffuse-type GC in subjects aged < 60 yr. This stratified analysis elucidated that rs184432 SNP is more protective against diffuse-type GC than GC in subjects aged < 60 yr. Furthermore, our stratified study on lymph node metastasis revealed that CT or TT genotypes, and T allele of rs184432 SNP were associated with a reduced risk of lymph node metastasis-negative GC and neg- ative diffuse-type GC. The TT genotype and T allele of rs225359 promoter SNP were associated with a decreased risk of lymph node metastasis-negative GC and negative diffuse-type GC. We demonstrated that the genetic variation at rs184432 and rs225359 may have a protective effect only on lymph node metastasis-neg- ative GC and negative diffuse-type GC. More recently, a study reported that rs3814896 SNP of TFF2 and rs9981660 SNP of TFF3 selected from a meta-analysis of the Chinese Han Beijing eth- nic group were associated with a decreased risk of GC in a Chi- nese population (33). Nevertheless, although a positive associa- tion of TFF2 and TFF3 has been reported in the Chinese popu- lation, we did not detect any association between TFF2 and TFF3 polymorphisms and the risk of GC in the studied Korean popu- lation (Supplementary Table 1). In our haplotype analysis of 8 SNPs of the TFF family, no statistical association between hap- lotypes and the risk of cancer was found (P > 0.05) (data not shown).
Our study has some limitations. First, the sample size was in- adequate for stratified analysis and for analyzing the associa- tion in mixed-type GC patients. Second, although Helicobacter pylori is an independent risk factor (36, 37), we did not investi- gate the relevance of TFF polymorphism for H. pylori in GC ow- ing to some ethical considerations. Third, we did not investigate whether genetic factors influence smoking, drinking, and diet associated with GC risk due to the lack of data from the GC and control groups. In our future study, the effect of these factors on GC risk will need to be assessed.
In conclusion, our data suggest that single nucleotide change of the rs184432 and rs225359 promoter SNPs of TFF1 might be associated with the susceptibility of diffuse-type GC in the Ko- rean population. However, further functional studies are neces- sary to clarify the effect of rs184432 and rs225359 polymorphisms on TFF1 gene expression and research in other ethnic groups with larger sample size is recommended to confirm our findings.
DISCLOSURE
The authors have no conflicts of interest to disclose.
AUTHOR CONTRIBUTION
Designed the experiment: Jin EH, Lee SI, Hur GM, Hong JH.
Performed the experiments and analyzed the data: Jin EH, Lee
SI. Contributed reagents/materials/analysis tools: Kim JW, Seo EY, Lee SY, Shin S. Wrote the manuscript and final decision to submit for publication: Jin EH, Lee SI, Hong JH. All authors read and approved the final manuscript.
ORCID
Jang Hee Hong http://orcid.org/0000-0002-0623-5455
REFERENCES
1. Bertuccio P, Chatenoud L, Levi F, Praud D, Ferlay J, Negri E, Malvezzi M, La Vecchia C. Recent patterns in gastric cancer: a global overview. Int J Cancer 2009; 125: 666-73.
2. Jemal A, Bray F, Center MM, Ferlay J, Ward E, Forman D. Global cancer statistics. CA Cancer J Clin 2011; 61: 69-90.
3. Jung KW, Won YJ, Kong HJ, Oh CM, Lee DH, Lee JS. Prediction of cancer incidence and mortality in Korea, 2014. Cancer Res Treat 2014; 46:
124-30.
4. Nakatsuru S, Yanagisawa A, Furukawa Y, Ichii S, Kato Y, Nakamura Y, Horii A. Somatic mutations of the APC gene in precancerous lesion of the stomach. Hum Mol Genet 1993; 2: 1463-5.
5. Fang DC, Luo YH, Yang SM, Li XA, Ling XL, Fang L. Mutation analysis of APC gene in gastric cancer with microsatellite instability. World J Gas- troenterol 2002; 8: 787-91.
6. Mingchao., Devereux TR, Stockton P, Sun K, Sills RC, Clayton N, Portier M, Flake G. Loss of E-cadherin expression in gastric intestinal metapla- sia and later stage p53 altered expression in gastric carcinogenesis. Exp Toxicol Pathol 2001; 53: 237-46.
7. Morgan C, Jenkins GJ, Ashton T, Griffiths AP, Baxter JN, Parry EM, Parry JM. Detection of p53 mutations in precancerous gastric tissue. Br J Can- cer 2003; 89: 1314-9.
8. Yokozaki H, Shitara Y, Fujimoto J, Hiyama T, Yasui W, Tahara E. Altera- tions of p73 preferentially occur in gastric adenocarcinomas with foveo- lar epithelial phenotype. Int J Cancer 1999; 83: 192-6.
9. Tomkova K, Belkhiri A, El-Rifai W, Zaika AI. p73 isoforms can induce T- cell factor-dependent transcription in gastrointestinal cells. Cancer Res 2004; 64: 6390-3.
10. Sato K, Tamura G, Tsuchiya T, Endoh Y, Usuba O, Kimura W, Motoyama T. Frequent loss of expression without sequence mutations of the DCC gene in primary gastric cancer. Br J Cancer 2001; 85: 199-203.
11. Baffa R, Veronese ML, Santoro R, Mandes B, Palazzo JP, Rugge M, San- toro E, Croce CM, Huebner K. Loss of FHIT expression in gastric carci- noma. Cancer Res 1998; 58: 4708-14.
12. Noguchi T, Müller W, Wirtz HC, Willers R, Gabbert HE. FHIT gene in gastric cancer: association with tumour progression and prognosis. J Pathol 1999; 188: 378-81.
13. Lee SH, Kim WH, Kim HK, Woo KM, Nam HS, Kim HS, Kim JG, Cho MH. Altered expression of the fragile histidine triad gene in primary gas- tric adenocarcinomas. Biochem Biophys Res Commun 2001; 284: 850-5.
14. Emami S, Rodrigues S, Rodrigue CM, Le Floch N, Rivat C, Attoub S, Bruy- neel E, Gespach C. Trefoil factor family (TFF) peptides and cancer pro- gression. Peptides 2004; 25: 885-98.
15. Thim L. A new family of growth factor-like peptides. ‘Trefoil’ disulphide
loop structures as a common feature in breast cancer associated peptide (pS2), pancreatic spasmolytic polypeptide (PSP), and frog skin peptides (spasmolysins). FEBS Lett 1989; 250: 85-90.
16. Rio MC, Chenard MP, Wolf C, Marcellin L, Tomasetto C, Lathe R, Bel- locq JP, Chambon P. Induction of pS2 and hSP genes as markers of mu- cosal ulceration of the digestive tract. Gastroenterology 1991; 100: 375-9.
17. Hanby AM, Poulsom R, Singh S, Elia G, Jeffery RE, Wright NA. Spasmo- lytic polypeptide is a major antral peptide: distribution of the trefoil pep- tides human spasmolytic polypeptide and pS2 in the stomach. Gastro- enterology 1993; 105: 1110-6.
18. Theisinger B, Welter C, Grzeschik KH, Blin N. Assignment of the gene for human spasmolytic protein (hSP/SML1) to chromosome 21. Hum Genet 1992; 89: 681-2.
19. Tomasetto C, Rockel N, Mattei MG, Fujita R, Rio MC. The gene encoding the human spasmolytic protein (SML1/hSP) is in 21q 22.3, physically linked to the homologous breast cancer marker gene BCEI/pS2. Genom- ics 1992; 13: 1328-30.
20. Taupin D, Ooi K, Yeomans N, Giraud A. Conserved expression of intesti- nal trefoil factor in the human colonic adenoma-carcinoma sequence.
Lab Invest 1996; 75: 25-32.
21. Huang YG, Li YF, Pan BL, Wang LP, Zhang Y, Lee WH, Zhang Y. Trefoil factor 1 gene alternations and expression in colorectal carcinomas. Tu- mori 2013; 99: 702-7.
22. Speiser P, Stolzlechner J, Haider K, Heinzl H, Jakesz R, Pecherstorfer M, Rosen H, Sevelda P, Zeilliger R. pS2 protein status fails to be an indepen- dent prognostic factor in an average breast cancer population. Antican- cer Res 1994; 14: 2125-30.
23. May FE, Westley BR. Expression of human intestinal trefoil factor in ma- lignant cells and its regulation by oestrogen in breast cancer cells. J Pathol 1997; 182: 404-13.
24. Luo J, Duggan DJ, Chen Y, Sauvageot J, Ewing CM, Bittner ML, Trent JM, Isaacs WB. Human prostate cancer and benign prostatic hyperplasia:
molecular dissection by gene expression profiling. Cancer Res 2001; 61:
4683-8.
25. Vestergaard EM, Borre M, Poulsen SS, Nexø E, Tørring N. Plasma levels of trefoil factors are increased in patients with advanced prostate cancer.
Clin Cancer Res 2006; 12: 807-12.
26. Qu Y, Yang Y, Ma D, Xiao W. Increased trefoil factor 3 levels in the serum
of patients with three major histological subtypes of lung cancer. Oncol Rep 2012; 27: 1277-83.
27. Lefebvre O, Chenard MP, Masson R, Linares J, Dierich A, LeMeur M, Wendling C, Tomasetto C, Chambon P, Rio MC. Gastric mucosa abnor- malities and tumorigenesis in mice lacking the pS2 trefoil protein. Sci- ence 1996; 274: 259-62.
28. Wu MS, Shun CT, Wang HP, Lee WJ, Wang TH, Lin JT. Loss of pS2 pro- tein expression is an early event of intestinal-type gastric cancer. Jpn J Cancer Res 1998; 89: 278-82.
29. Kim H, Eun JW, Lee H, Nam SW, Rhee H, Koh KH, Kim H. Gene expres- sion changes in patient-matched gastric normal mucosa, adenomas, and carcinomas. Exp Mol Pathol 2011; 90: 201-9.
30. Leung WK, Yu J, Chan FK, To KF, Chan MW, Ebert MP, Ng EK, Chung SC, Malfertheiner P, Sung JJ. Expression of trefoil peptides (TFF1, TFF2, and TFF3) in gastric carcinomas, intestinal metaplasia, and non-neo- plastic gastric tissues. J Pathol 2002; 197: 582-8.
31. Im S, Yoo C, Jung JH, Choi HJ, Yoo J, Kang CS. Reduced expression of TFF1 and increased expression of TFF3 in gastric cancer: correlation with clinicopathological parameters and prognosis. Int J Med Sci 2013;
10: 133-40.
32. Moghanibashi M, Mohamadynejad P, Rasekhi M, Ghaderi A, Moham- madianpanah M. Polymorphism of estrogen response element in TFF1 gene promoter is associated with an increased susceptibility to gastric cancer. Gene 2012; 492: 100-3.
33. Xu Q, Chen MY, He CY, Sun LP, Yuan Y. Promoter polymorphisms in tre- foil factor 2 and trefoil factor 3 genes and susceptibility to gastric cancer and atrophic gastritis among Chinese population. Gene 2013; 529: 104-12.
34. Lauren P. The two histological main types of gastric carcinoma: diffuse and so-called intestinal-type carcinoma. an attempt at a histo-clinical classification. Acta Pathol Microbiol Scand 1965; 64: 31-49.
35. Kruglyak L, Nickerson DA. Variation is the spice of life. Nat Genet 2001;
27: 234-6.
36. Solcia E, Fiocca R, Luinetti O, Villani L, Padovan L, Calistri D, Ranzani GN, Chiaravalli A, Capella C. Intestinal and diffuse gastric cancers arise in a different background of Helicobacter pylori gastritis through differ- ent gene involvement. Am J Surg Pathol 1996; 20: S8-22.
37. Parkin DM. The global health burden of infection-associated cancers in the year 2002. Int J Cancer 2006; 118: 3030-44.
Supplementary Table 1. Genotype and allele frequencies of TFF2 and TFF3 poly- morphisms among gastric cancer patients and controls and their association with gastric cancer risk
SNPs Geno-
type
Controls GC vs. CON
N (%) N (%) OR (95% CI) P value
TFF2
rs3814896 TT 288 (72.7) 283 (75.1) 1.00 (ref.)
TC 94 (23.8) 84 (22.2) 0.91 (0.65-1.27) 0.581 CC 14 (3.5) 10 (2.7) 0.73 (0.32-1.66) 0.450 Allele T 670 (84.6) 650 (86.2) 1.00 (ref.)
C 122 (15.4) 104 (13.8) 0.88 (0.66-1.17) 0.370 TFF2
rs13052596 GG 183 (46.2) 190 (50.4) 1.00 (ref.)
GT 166 (41.9) 145 (38.5) 0.84 (0.62-1.14) 0.261 TT 47 (11.9) 42 (11.1) 0.86 (0.54-1.37) 0.525 Allele G 532 (67.2) 525 (69.6) 1.00 (ref.)
T 260 (32.8) 229 (30.4) 0.89 (0.72-1.11) 0.300 TFF2
rs225334 CC 208 (52.5) 215 (57.0) 1.00 (ref.)
CT 153 (38.7) 142 (37.7) 0.90 (0.67-1.21) 0.478 TT 35 (8.8) 20 (5.3) 0.55 (0.31-0.99) 0.046 Allele C 569 (71.8) 572 (75.9) 1.00 (ref.)
T 223 (28.2) 182 (24.1) 0.81 (0.65-1.02) 0.073 TFF3
rs225362 TT 376 (94.9) 363 (96.3) 1.00 (ref.)
TC 20 (5.1) 14 (3.7) 0.73 (0.36-1.46) 0.367
CC 0 (0) 0 (0) - -
Allele T 772 (97.5) 740 (98.1) 1.00 (ref.)
C 20 (2.5) 14 (1.9) 0.73 (0.37-1.46) 0.372 SNPs, single nucleotide polymorphisms; GC, gastric cancer; CON, controls; OR, odds ratio; CI, confidence interval.